Insuring Against the Four Horsemen: Does Global Equity Diversification Reduce Deep Risk for Indian Portfolios?
The rupee cushioned Indian crashes. It did not lift the worst 20-year ending.
finfire Quantitative Research Series · Paper #9 · November 2026
In one minute
Many Indian investors keep all their equity in the Nifty 50. Their reason is simple: India grows faster. The writer William Bernstein argues the other way. In his view you hold foreign shares not for higher returns but as insurance against a deep crisis at home. We tested that idea on ₹1 Cr, bought at the end of every month from June 1999 and held for 10 or 20 years. The test counts LRS, TCS, fund costs, US withholding tax and tax at sale. Every number is in real rupees, which means after Indian inflation. This history has no 30-year window, so every 30-year figure in this paper is a simulation of the same years.
- The rupee does fall when India falls. The monthly correlation between the rupee's move and the Nifty 50's real return is −0.51. In every 36-month stretch since 1999, the link stayed negative. In the Nifty's worst 10% of months, the rupee fell 1.69% a month. In other months it fell 0.08%.
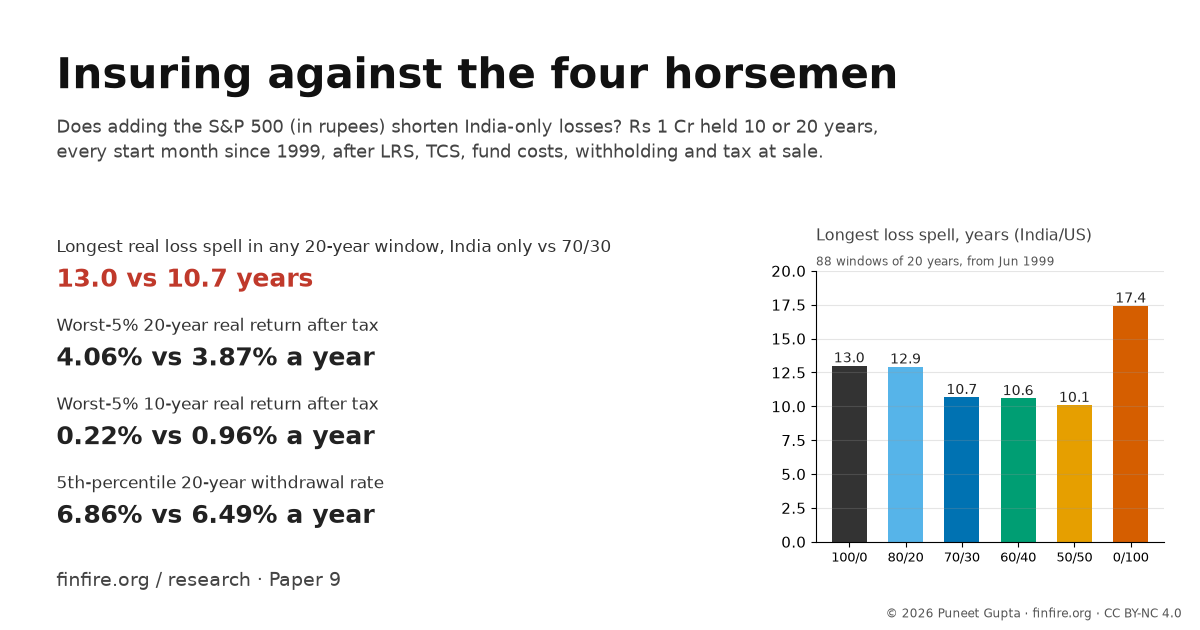
- That made the ride shorter. With 30% in an S&P 500 fund (70/30), the longest real loss spell in any 20-year window fell from 13.0 years to 10.7. The Ulcer Index of the median window fell from 25.0 to 22.6. Of the India-only 20-year windows, 20% ended below an earlier peak. No 70/30 window did (0%).
- It did not make the worst 20-year ending better. The worst-5% real return went from 4.06% a year (India only) to 3.87% (70/30). The 5th-percentile withdrawal rate over 20 years went from 6.86% to 6.49%. Past 80/20, every step abroad lowered both.
- The reason: no extra return and no currency bonus. From June 1999 the Nifty 50 TRI returned 12.91% a year. The S&P 500 in rupees returned 11.67%. The rupee fell 2.96% a year, which is less than the 3.21% gap between Indian and US inflation. So the cushion was all timing, and timing does not change where a buy-and-hold portfolio ends.
- Over 10 years, the US share did lift the bad end. The worst-5% 10-year real return rose from 0.22% (India only) to 0.96% (70/30) and 1.34% (50/50).
- The cushion has gaps. The rupee showed no clear link with Indian inflation (correlation 0.08). It cushioned share-market crashes, not inflation. And when the shock started in America (2000–01, 2022), the S&P 500 fell too. After the February 2000 peak, 70/30 took 64 months to get back to ₹1 Cr. India only took 46.
- Frictions were not the problem. All frictions together cut the 70/30 worst-5% 20-year return from 4.67% to 3.87%. Most of that was tax at sale, which an India-only investor pays too.
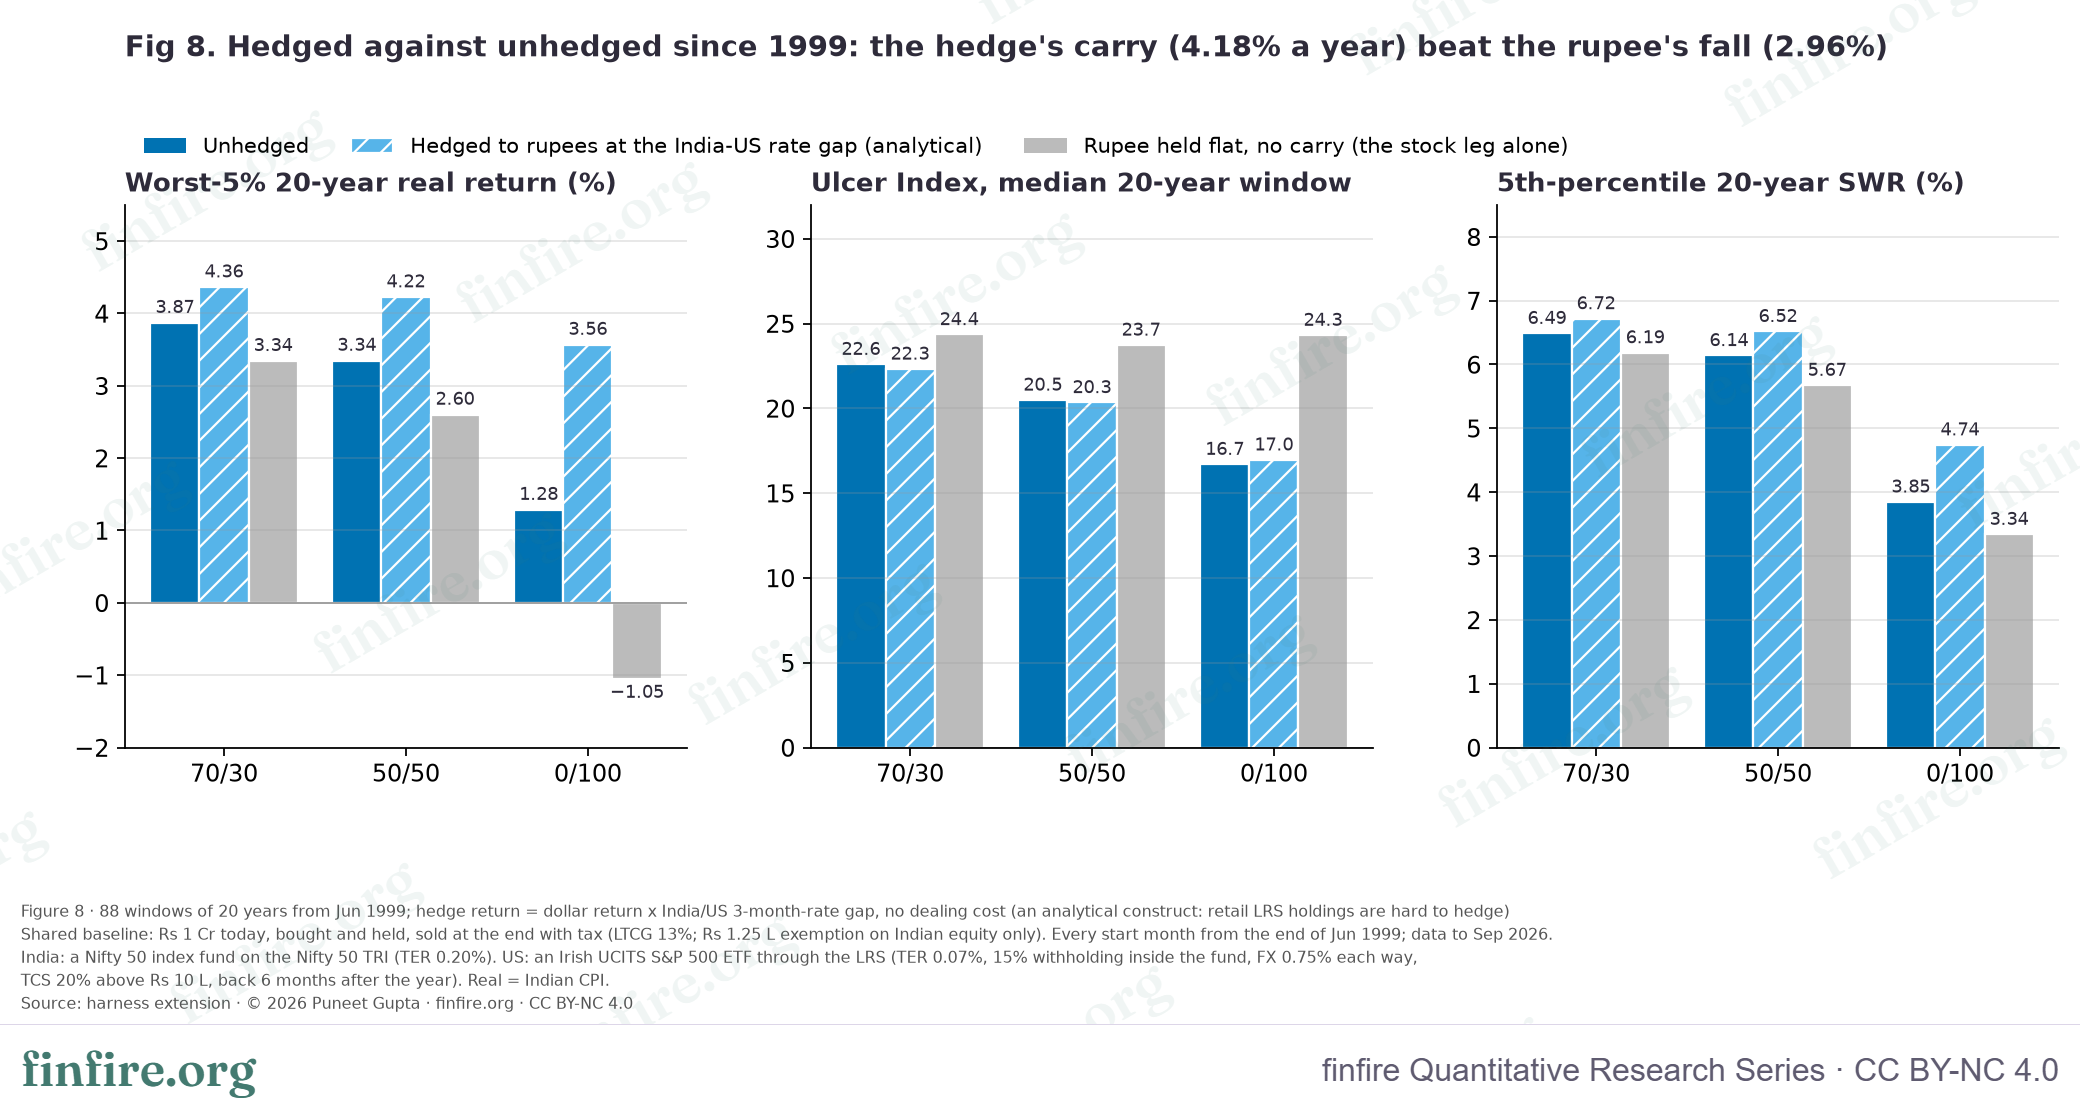
- A hedge would have done better than no hedge. The India–US interest-rate gap earned 4.18% a year, more than the rupee's fall of 2.96%. A hedged 70/30 had a worst-5% 20-year return of 4.36%. Today that gap is only 1.45 points.
The short version. Since 1999, a US share bought a shorter stay below the peak, not a richer worst case. "Nifty 50 alone is enough" was half right. India alone, or 80/20, gave the best worst-case 20-year ending. India alone also gave the longest stretch below its peak.
The question
William Bernstein calls them deep risks: inflation, deflation, confiscation and devastation. These are the "four horsemen". His argument runs like this. Over long periods, shares in your own country cover ordinary inflation. But one country can have a deep crisis of its own: stagflation, a fiscal crisis, a currency collapse, or a sudden change in tax or rules. Shares abroad are the insurance against that. You buy them to survive the bad case, not to earn more.
Indian forums often say the opposite: "India grows faster, so the Nifty 50 is enough."
This paper asks two questions. First, does adding S&P 500 shares, held in rupees, to an Indian portfolio shorten the worst real recoveries and lift the worst-decile outcomes? We count every real friction: LRS and TCS, Indian tax on foreign assets, fund costs and dividend withholding. Second, if there is a benefit, where does it come from: the US shares, the rupee, or both?
The idea we test is this: the rupee tends to weaken when India is under stress, so a foreign holding rises in rupees just when Indian shares fall. If that is true, it should show up at the bad end. So we look at the worst 5% and 10% of holding periods, the Ulcer Index and the longest time spent below a past peak, not at the median.
One limit shapes everything below. We use index data only, from June 1999 to September 2026: 27 years. That history holds no 30-year window. Every 30-year number in this paper is a simulation (a block bootstrap) of those same 27 years, and is marked as one.
Words used
| Term | Meaning |
|---|---|
| Blend (India/US) | The share in a Nifty 50 index fund / the share in an S&P 500 fund. 100/0 is India only; 0/100 is US only. |
| Real | After Indian inflation (CPI), in today's money. |
| CAGR | Growth a year, compounded. |
| TRI | Total return index: the index with its dividends put back in. |
| S&P 500 in rupees | The S&P 500's dollar return, turned into rupees at each month's exchange rate. |
| The rupee's fall | How much more a dollar costs in rupees, a year. |
| Inflation gap | Indian inflation less US inflation. If the rupee fell by exactly this much, a dollar would keep the same buying power in India. |
| Window | A holding period bought at the close of a given month. A window "starting 2007-12" buys at the end of December 2007. The 88 windows of 20 years start in each month from June 1999 to September 2006. |
| 5th percentile ("worst 5%") | 95 in 100 windows did at least this well. |
| Mean of the worst 5% (CVaR) | The average of the worst 5% of windows. |
| Below a past peak | Real, after-tax wealth under its own earlier high. The longest spell is the time from a peak back to it. |
| Ulcer Index | How deep and how long wealth sat below its own peak: the square root of the average squared % fall below the peak, month by month. Higher is worse. |
| SWR (safe withdrawal rate) | The highest yearly withdrawal, as a share of the starting ₹1 Cr and raised with inflation, that kept every month funded. |
| LRS | Liberalised Remittance Scheme: the route for an Indian resident to send money abroad, up to $2,50,000 a person a year. |
| TCS | Tax collected at source on money sent abroad: 20% above ₹10 L a year for investment. It is credited back later. |
| UCITS fund | An Ireland-listed fund (CSPX-type) that keeps its dividends inside the fund. |
| Withholding | US tax on dividends: 15% inside an Irish fund, 25% on a US-listed fund. |
| Hedged | The dollar exposure sold forward. The holder earns the India–US interest-rate gap instead of the rupee's fall. |
| Carry | What the hedge earns: the India–US short-term interest-rate gap. |
| Block bootstrap | A simulation that strings together random 24-month blocks of the real history. |
| Independent window | A stretch of history that shares no months with another. |
The set-up and paths
Every path starts with ₹1 Cr in today's money. It buys the blend in one go at the end of a month, holds it, and sells everything at the end of the window, paying tax. We repeat this for every start month in the history. The shared baseline:
- Blends (India/US): 100/0, 80/20, 70/30, 60/40, 50/50 and 0/100.
- Horizons: 10 and 20 years of history. 30 years by simulation only.
- Start months: every month end from June 1999. Data to September 2026.
- Indian leg: a Nifty 50 index fund with a TER of 0.20%.
- US leg: an Irish UCITS S&P 500 ETF with a TER of 0.07% and 15% withholding inside the fund. Money crosses at an FX spread of 0.75% each way, plus 0.05% commission.
- TCS: 20% above ₹10 L, paid out of the ₹1 Cr, and back 6 months after the year ends.
- Tax at sale: 13% (12.5% plus 4% cess). Indian equity gets the ₹1.25 L a year exemption. Foreign funds held over 24 months get no exemption.
- Thresholds stay constant in real terms. Real means after Indian CPI. USD/INR today: ₹96.30, the calculator's default.
| Path | What it does | Engine |
|---|---|---|
| Base | ₹1 Cr bought and held in the blend, UCITS route, sold at the end with tax | harness extension |
| A | US share hedged to rupees at the India–US 3-month rate gap (analytical) | harness extension |
| B | Rebalanced to the blend every year, tax paid on each sale, TCS on money sent abroad | harness extension |
| C | US-listed (VOO-type) route: dividends taxed at 31.2% each year; expected US estate tax | harness extension |
| D | Indian fund of funds (no LRS, TER 0.50%) | harness extension |
| E | Surcharge on the sale (salary ₹30 L) | harness extension |
| F | No frictions at all | harness extension |
| Steady returns | Each blend on the 1999–2026 average returns, with the rupee inside the fund's return | calculator |
| Simulated markets | 2,000 markets; the fund abroad moves with Indian equity | calculator |
Assumptions and method
- Calculator: accumulate.finfire.org, with Investing abroad (Pro) and Simulated markets (Pro). It runs each blend on steady 1999–2026 average returns. It moves the fund abroad with Indian equity, and it cannot run history, hedge, or tax a final sale.
- Harness extension: every start month on monthly history; lots sold first in, first out; LRS remittance with TCS locked up; fund costs, withholding, FX costs and tax at sale. Under the calculator's own rules it matches the calculator to the paisa (35 plans). An independent plain-Python check re-computed 61 headline numbers with 0 differences.
- Data: Nifty 50 TRI (NSE) from June 1999; S&P 500 total return (S&P Dow Jones Indices, via Yahoo Finance); rupees per dollar (IMF); Indian CPI (IMF: CPI for industrial workers to Nov 2011, CPI Combined from Dec 2011; Aug–Sep 2026 from MoSPI, September provisional); US CPI (OECD).
- SWR: the highest real withdrawal with every month funded and tax paid each April (Paper 4's definition of success), then the 5th percentile across start months. No 30-year window exists. The 30-year figures come from a block bootstrap (2,000 paths, 24-month blocks): simulation, not history.
- Not modelled: the nil slab set against gains, the 87A rebate, interest on TCS refunds, the cost of Schedule FA compliance, exit loads, hedge dealing costs, and rule changes after FY 2026-27. Past markets run with today's rules (LRS began in 2004).
The worst windows: returns over 10 and 20 years
Start with what the thesis promises: a better bad end. Table 1 shows real returns after every friction and tax.
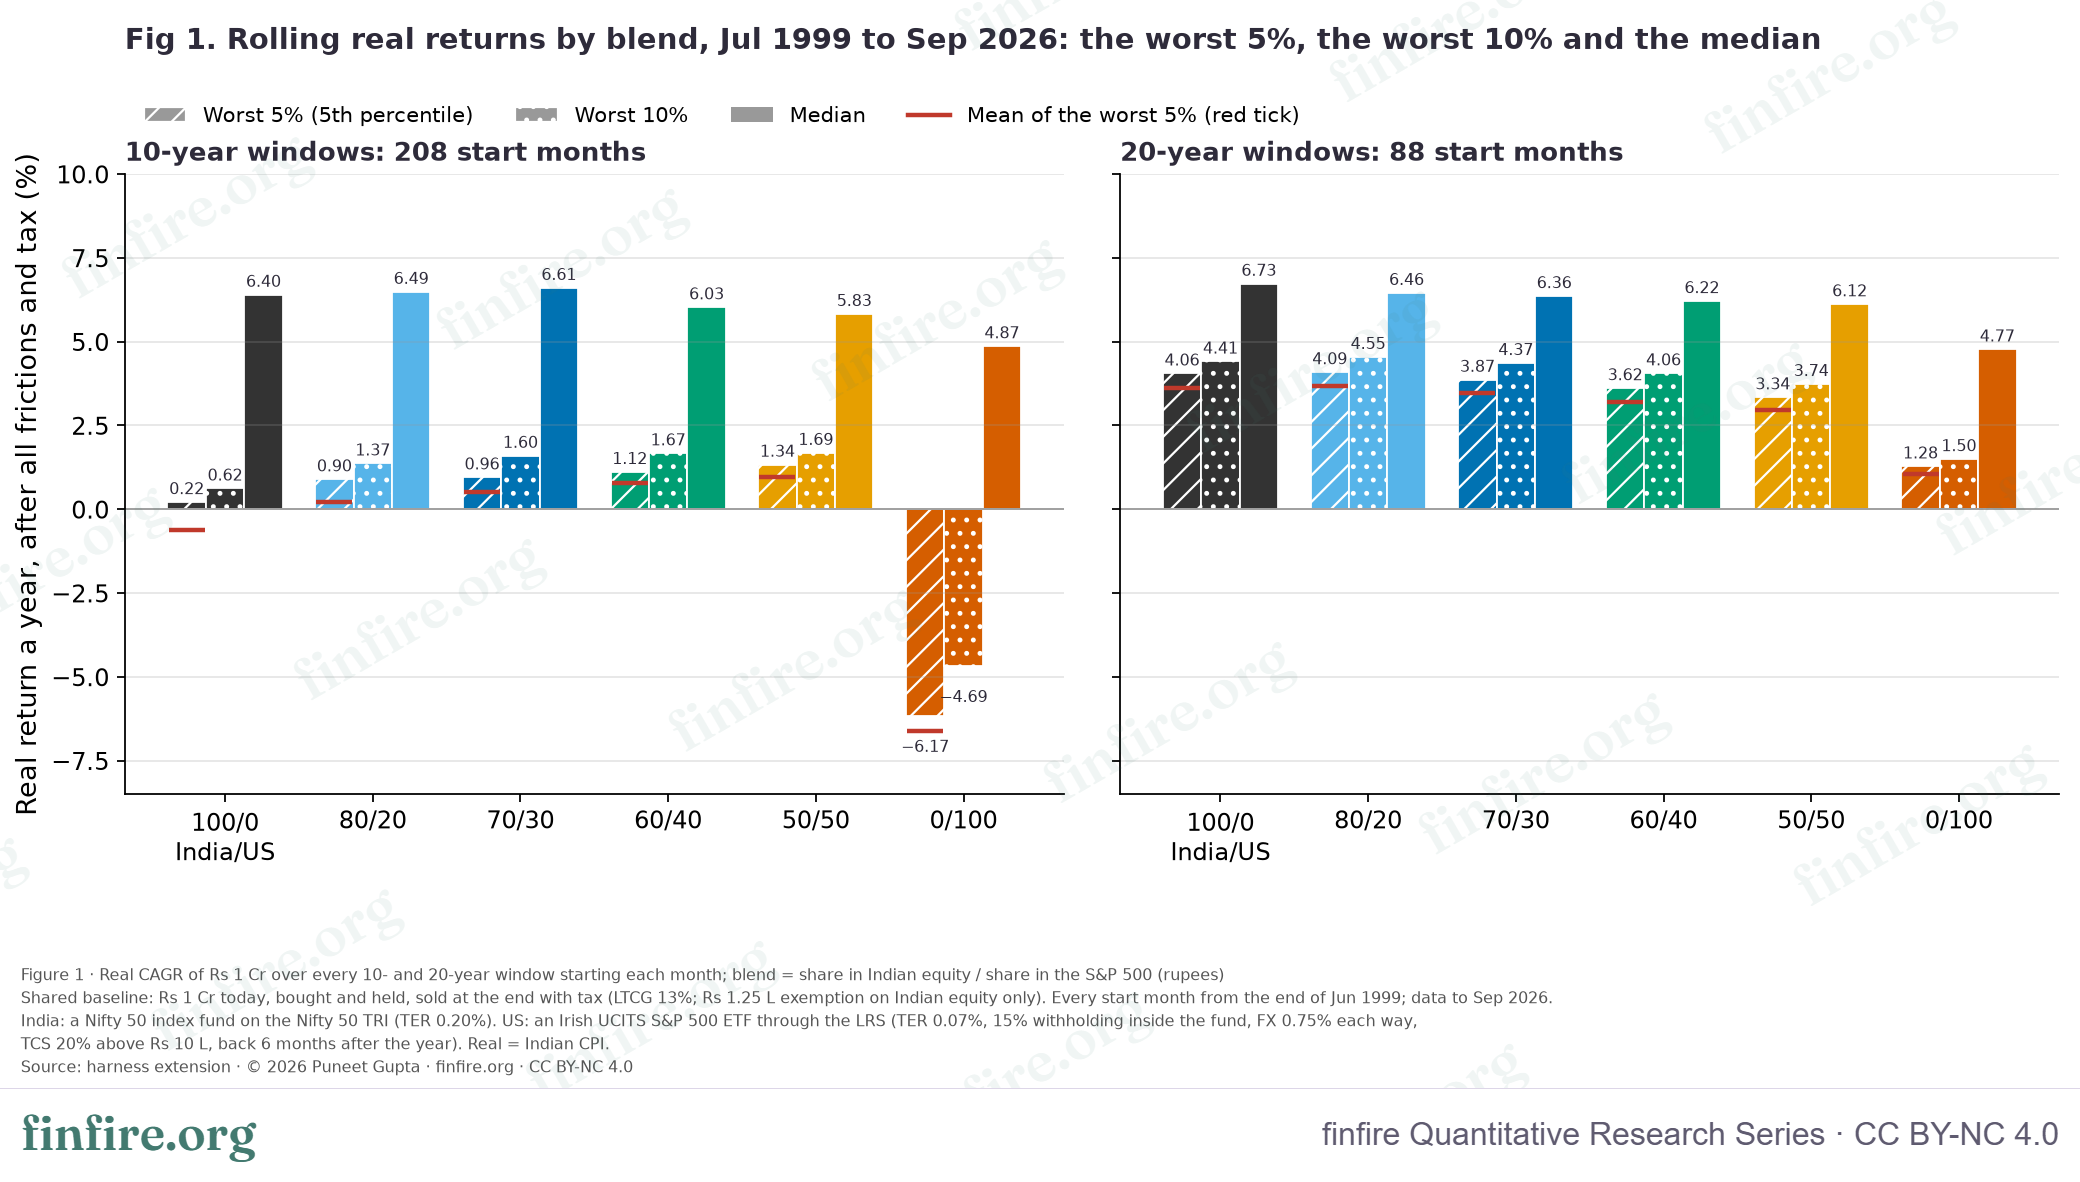
At 20 years, the worst 5% of India-only windows returned 4.06% a year. 80/20 was a hair better at 4.09%. After that, each step abroad lowered it: 3.87% at 70/30, 3.62% at 60/40, 3.34% at 50/50 and 1.28% for US only. The mean of the worst 5% tells the same story: 3.61%, 3.68%, 3.46%, 3.21%, 2.95% and 1.05%. The median fell too, from 6.73% to 6.46% and 6.36%.
At 10 years the picture turns. The worst 5% rose from 0.22% (India only) to 0.90%, 0.96%, 1.12% and 1.34% as the US share grew to 50%. US only fell to −6.17%. The mean of the worst 5% went from −0.61% to 0.50% at 70/30 and 0.96% at 50/50. The median barely moved: 6.40% for India only, 6.61% for 70/30, 5.83% for 50/50.
The worst 20-year window for every blend started in March 2000, near the top of the dot-com bubble. The worst India-only 10-year window started in December 2007, just before the global financial crisis.
Table 1. Rolling real CAGR of ₹1 Cr after all frictions and tax (UCITS route, buy and hold). 208 windows of 10 years and 88 of 20 years. Source: harness extension.
| Years | Blend (India/US) | Median | 10th pct | 5th pct | Mean of worst 5% | Worst (window starts) |
|---|---|---|---|---|---|---|
| 10 | 100/0 | 6.40% | 0.62% | 0.22% | −0.61% | −1.88% (2007-12) |
| 10 | 80/20 | 6.49% | 1.37% | 0.90% | 0.22% | −0.39% (2007-12) |
| 10 | 70/30 | 6.61% | 1.60% | 0.96% | 0.50% | 0.19% (2007-10) |
| 10 | 60/40 | 6.03% | 1.67% | 1.12% | 0.78% | 0.46% (2006-04) |
| 10 | 50/50 | 5.83% | 1.69% | 1.34% | 0.96% | 0.55% (2006-04) |
| 10 | 0/100 | 4.87% | −4.69% | −6.17% | −6.62% | −7.37% (2000-08) |
| 20 | 100/0 | 6.73% | 4.41% | 4.06% | 3.61% | 3.32% (2000-03) |
| 20 | 80/20 | 6.46% | 4.55% | 4.09% | 3.68% | 2.87% (2000-03) |
| 20 | 70/30 | 6.36% | 4.37% | 3.87% | 3.46% | 2.64% (2000-03) |
| 20 | 60/40 | 6.22% | 4.06% | 3.62% | 3.21% | 2.39% (2000-03) |
| 20 | 50/50 | 6.12% | 3.74% | 3.34% | 2.95% | 2.12% (2000-03) |
| 20 | 0/100 | 4.77% | 1.50% | 1.28% | 1.05% | 0.46% (2000-03) |
charts/fig1_rolling_real_cagr_data.csv.The ride: how long and how deep below the peak
The end value is one thing. The road to it is another. A retiree, or anyone who might need the money early, lives through the road.
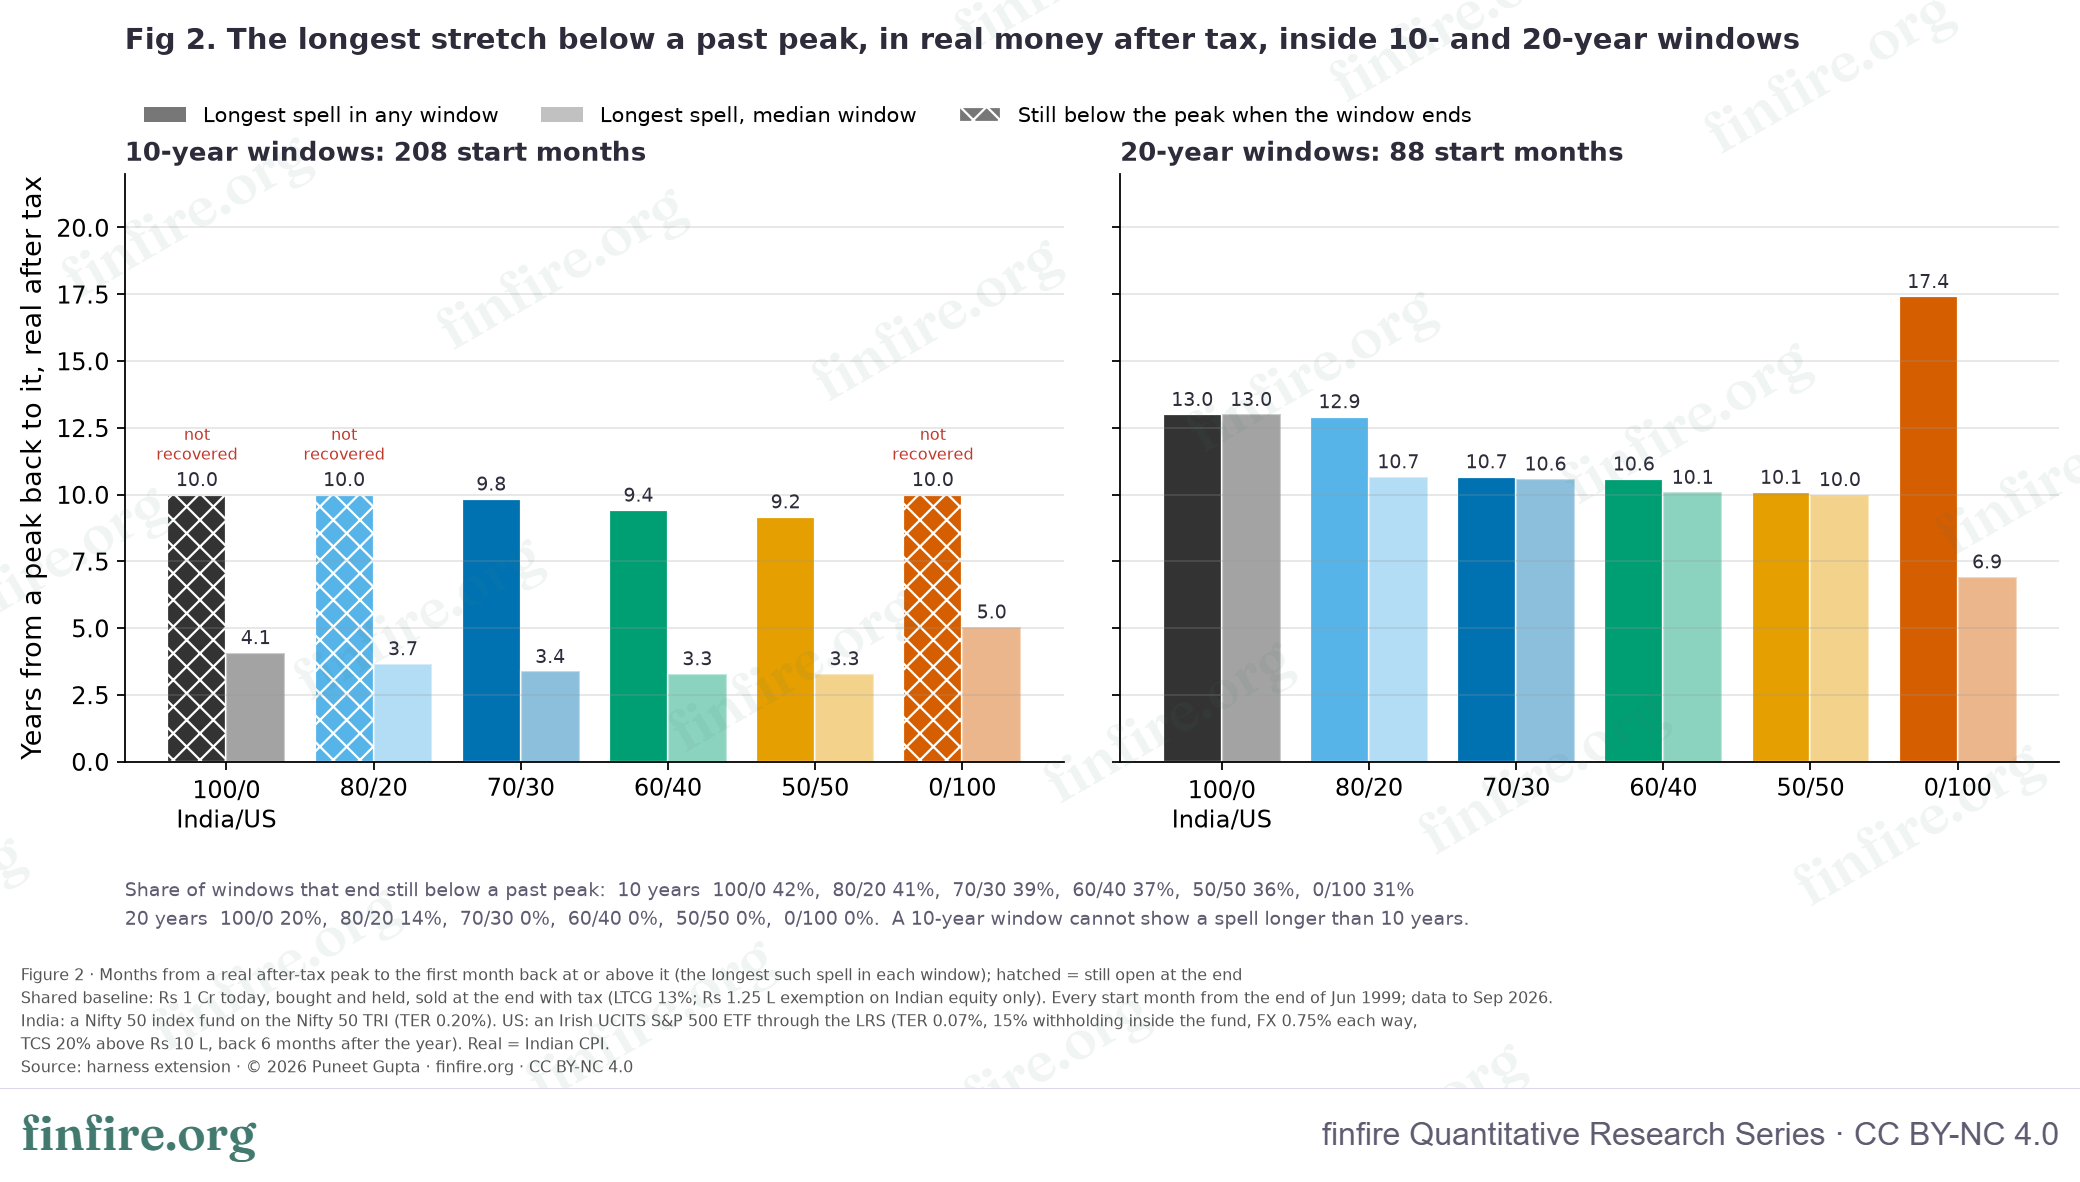
Here the US share helped. In any 20-year window, the longest real after-tax spell below a past peak was 13.0 years for India only. It was 12.9 years at 80/20, 10.7 at 70/30, 10.6 at 60/40 and 10.1 at 50/50. In the median 20-year window it fell from 13.0 years to 10.6 at 70/30. The Ulcer Index of the median 20-year window fell from 25.0 to 22.6 at 70/30 and 20.5 at 50/50. And 20% of India-only 20-year windows ended below an earlier peak, against 14% at 80/20 and none from 70/30 on.
Over 10 years, the longest spell for India only, 80/20 and US only ran the whole decade and was still open at the end. 70/30 got back after 9.8 years, 60/40 after 9.4 and 50/50 after 9.2.
The depth of the worst fall barely changed. The 5th-percentile deepest fall was −58.0% for India only and −56.2% at 70/30. The US share shortened the time below the peak far more than it softened the fall.
US only is the odd one. It had the lowest Ulcer Index in the median 20-year window (16.7). But it also had the longest single spell of any blend: 17.4 years, in the window that starts in December 1999.
Table 2. Path risk: real, after-tax wealth below its own past peak. Source: harness extension.
| Years | Blend | Ulcer Index, median window | Ulcer Index, 95th pct | Longest spell, median window (years) | Longest spell, any window (years) | Windows ending below a past peak | Deepest fall, 5th pct |
|---|---|---|---|---|---|---|---|
| 10 | 100/0 | 22.7 | 33.8 | 4.1 | 10.0 (not recovered by window end) | 42% | −58.0% |
| 10 | 80/20 | 20.4 | 29.9 | 3.7 | 10.0 (not recovered by window end) | 41% | −56.8% |
| 10 | 70/30 | 18.9 | 28.5 | 3.4 | 9.8 | 39% | −56.2% |
| 10 | 60/40 | 17.6 | 27.1 | 3.3 | 9.4 | 37% | −55.5% |
| 10 | 50/50 | 16.6 | 25.8 | 3.3 | 9.2 | 36% | −54.5% |
| 10 | 0/100 | 16.1 | 32.8 | 5.0 | 10.0 (not recovered by window end) | 31% | −58.6% |
| 20 | 100/0 | 25.0 | 28.6 | 13.0 | 13.0 | 20% | −58.0% |
| 20 | 80/20 | 23.5 | 26.9 | 10.7 | 12.9 | 14% | −56.8% |
| 20 | 70/30 | 22.6 | 25.9 | 10.6 | 10.7 | 0% | −56.2% |
| 20 | 60/40 | 21.6 | 25.0 | 10.1 | 10.6 | 0% | −55.5% |
| 20 | 50/50 | 20.5 | 23.9 | 10.0 | 10.1 | 0% | −54.6% |
| 20 | 0/100 | 16.7 | 31.7 | 6.9 | 17.4 | 0% | −59.6% |
charts/fig2_max_drawdown_duration_data.csv.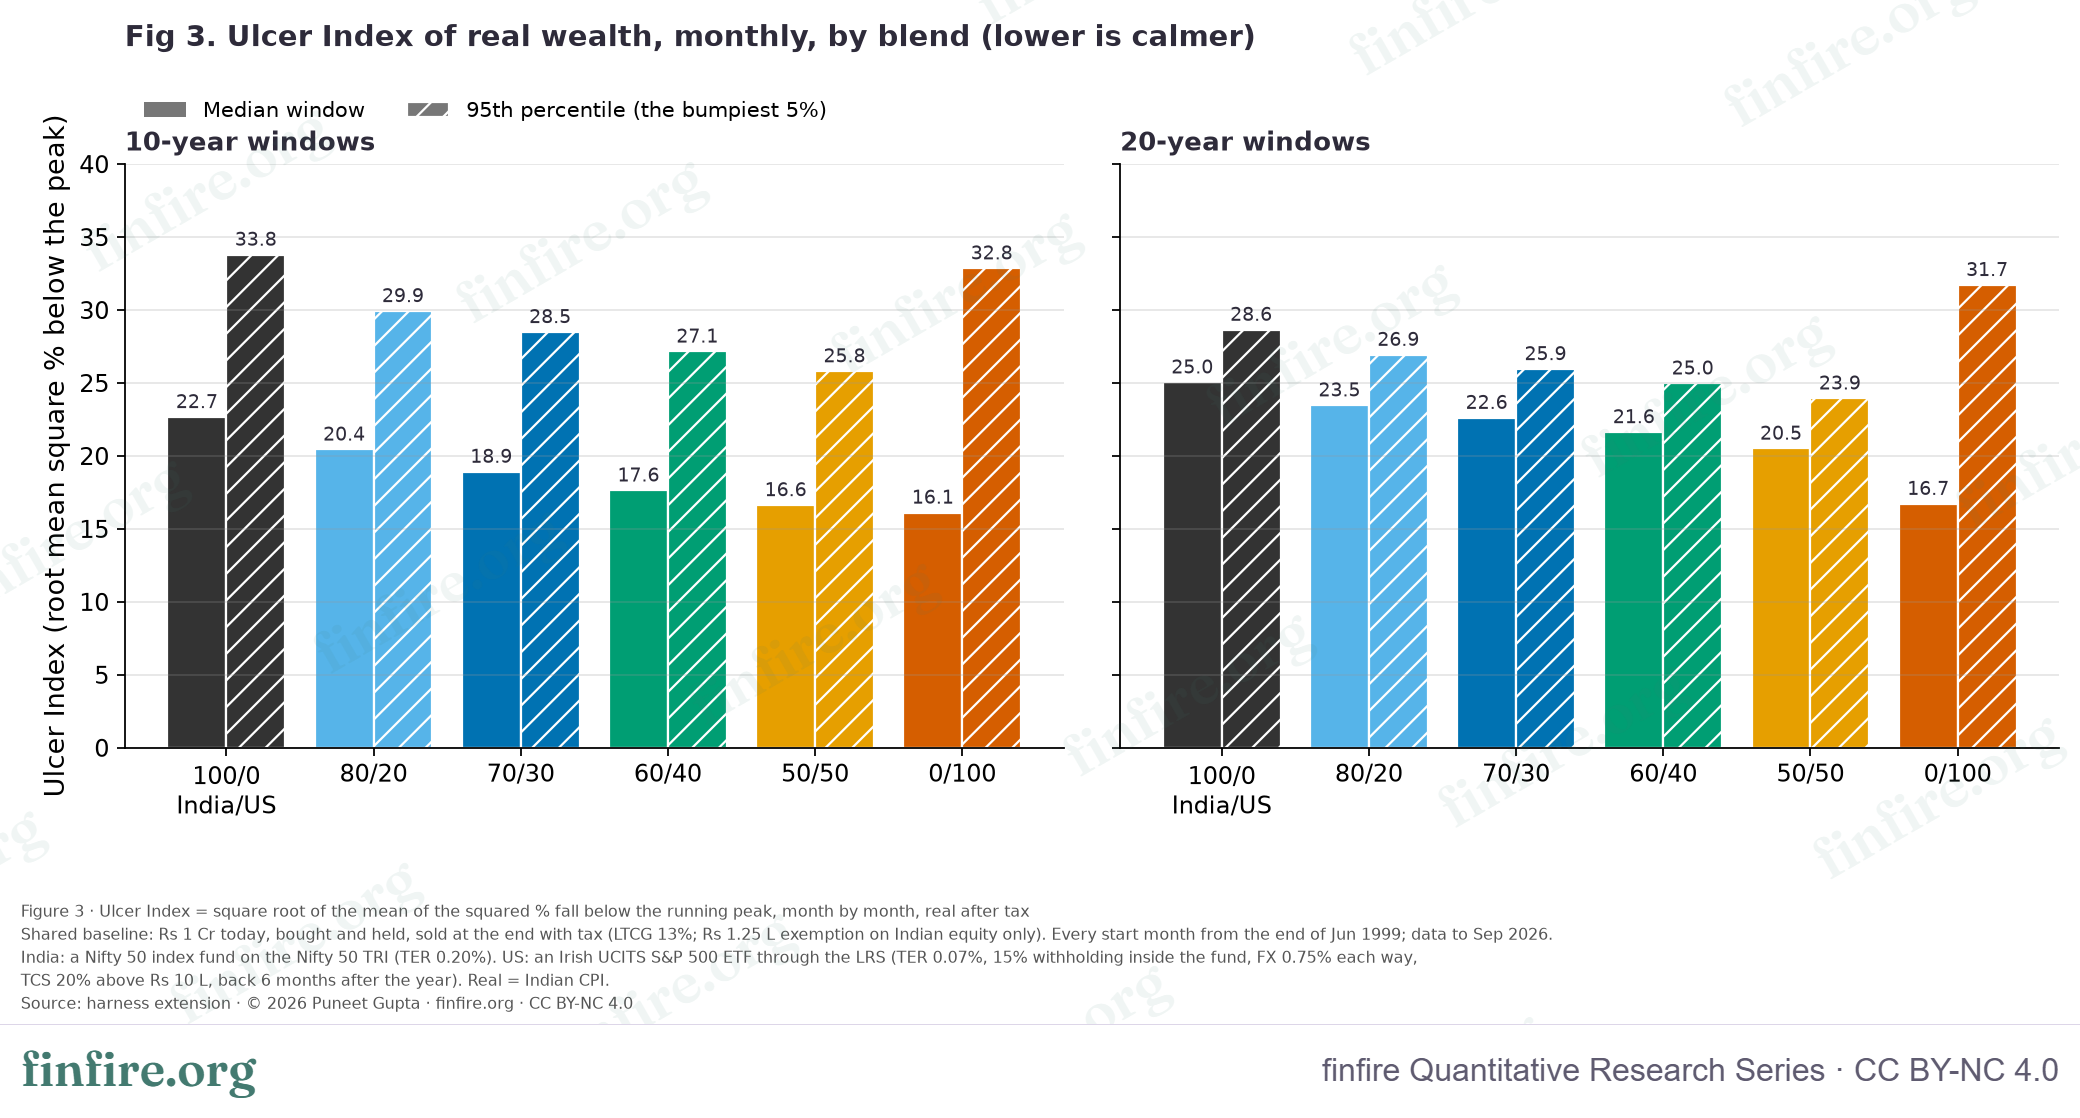
charts/fig3_ulcer_index_data.csv.Does the rupee really fall when India falls?
Yes, and steadily. Table 3 has the numbers. When the Nifty 50 has a bad month in real terms, the rupee usually weakens in the same month (correlation −0.51). Across calendar years the link is stronger (−0.80, over 26 years). It held in every 36-month stretch since 1999: the rolling correlation was below zero 100% of the time, between −0.80 and −0.16. In the Nifty's worst 10% of months, the rupee fell 1.69% a month, against 0.08% in other months. While the Nifty sat 20% or more below its real peak (145 months), the rupee fell 3.49% a year, against 2.54% at other times.
There is a catch for the stagflation story. The rupee's move had almost no link with Indian inflation: 0.08 by month and 0.09 by year. In this history, the rupee reacted to stress in the share market, not to rising prices. It cushioned equity crashes. It was not an inflation hedge.
Table 3. The rupee and Indian stress, as observed (July 1999 to September 2026). Source: harness extension (data).
| Measure | Value |
|---|---|
| Monthly: rupee move vs Nifty 50 real return (correlation) | −0.51 |
| Monthly: rupee move vs Indian CPI inflation | 0.08 |
| Monthly: rupee move vs S&P 500 dollar return | −0.35 |
| Monthly: Nifty 50 real vs S&P 500 dollar return | 0.51 |
| Calendar years (26): rupee move vs Nifty 50 real | −0.80 |
| Calendar years: rupee move vs Indian CPI | 0.09 |
| Rupee's fall a month in the Nifty's worst 10% of months | 1.69% |
| Rupee's fall a month in the other months | 0.08% |
| Rupee's fall a year while the Nifty sits 20% or more below its real peak (145 months) | 3.49% |
| Rupee's fall a year at other times | 2.54% |
| 36-month rolling correlation (rupee vs Nifty real): share of months below zero | 100% |
| 36-month rolling correlation: lowest; highest | −0.80; −0.16 |
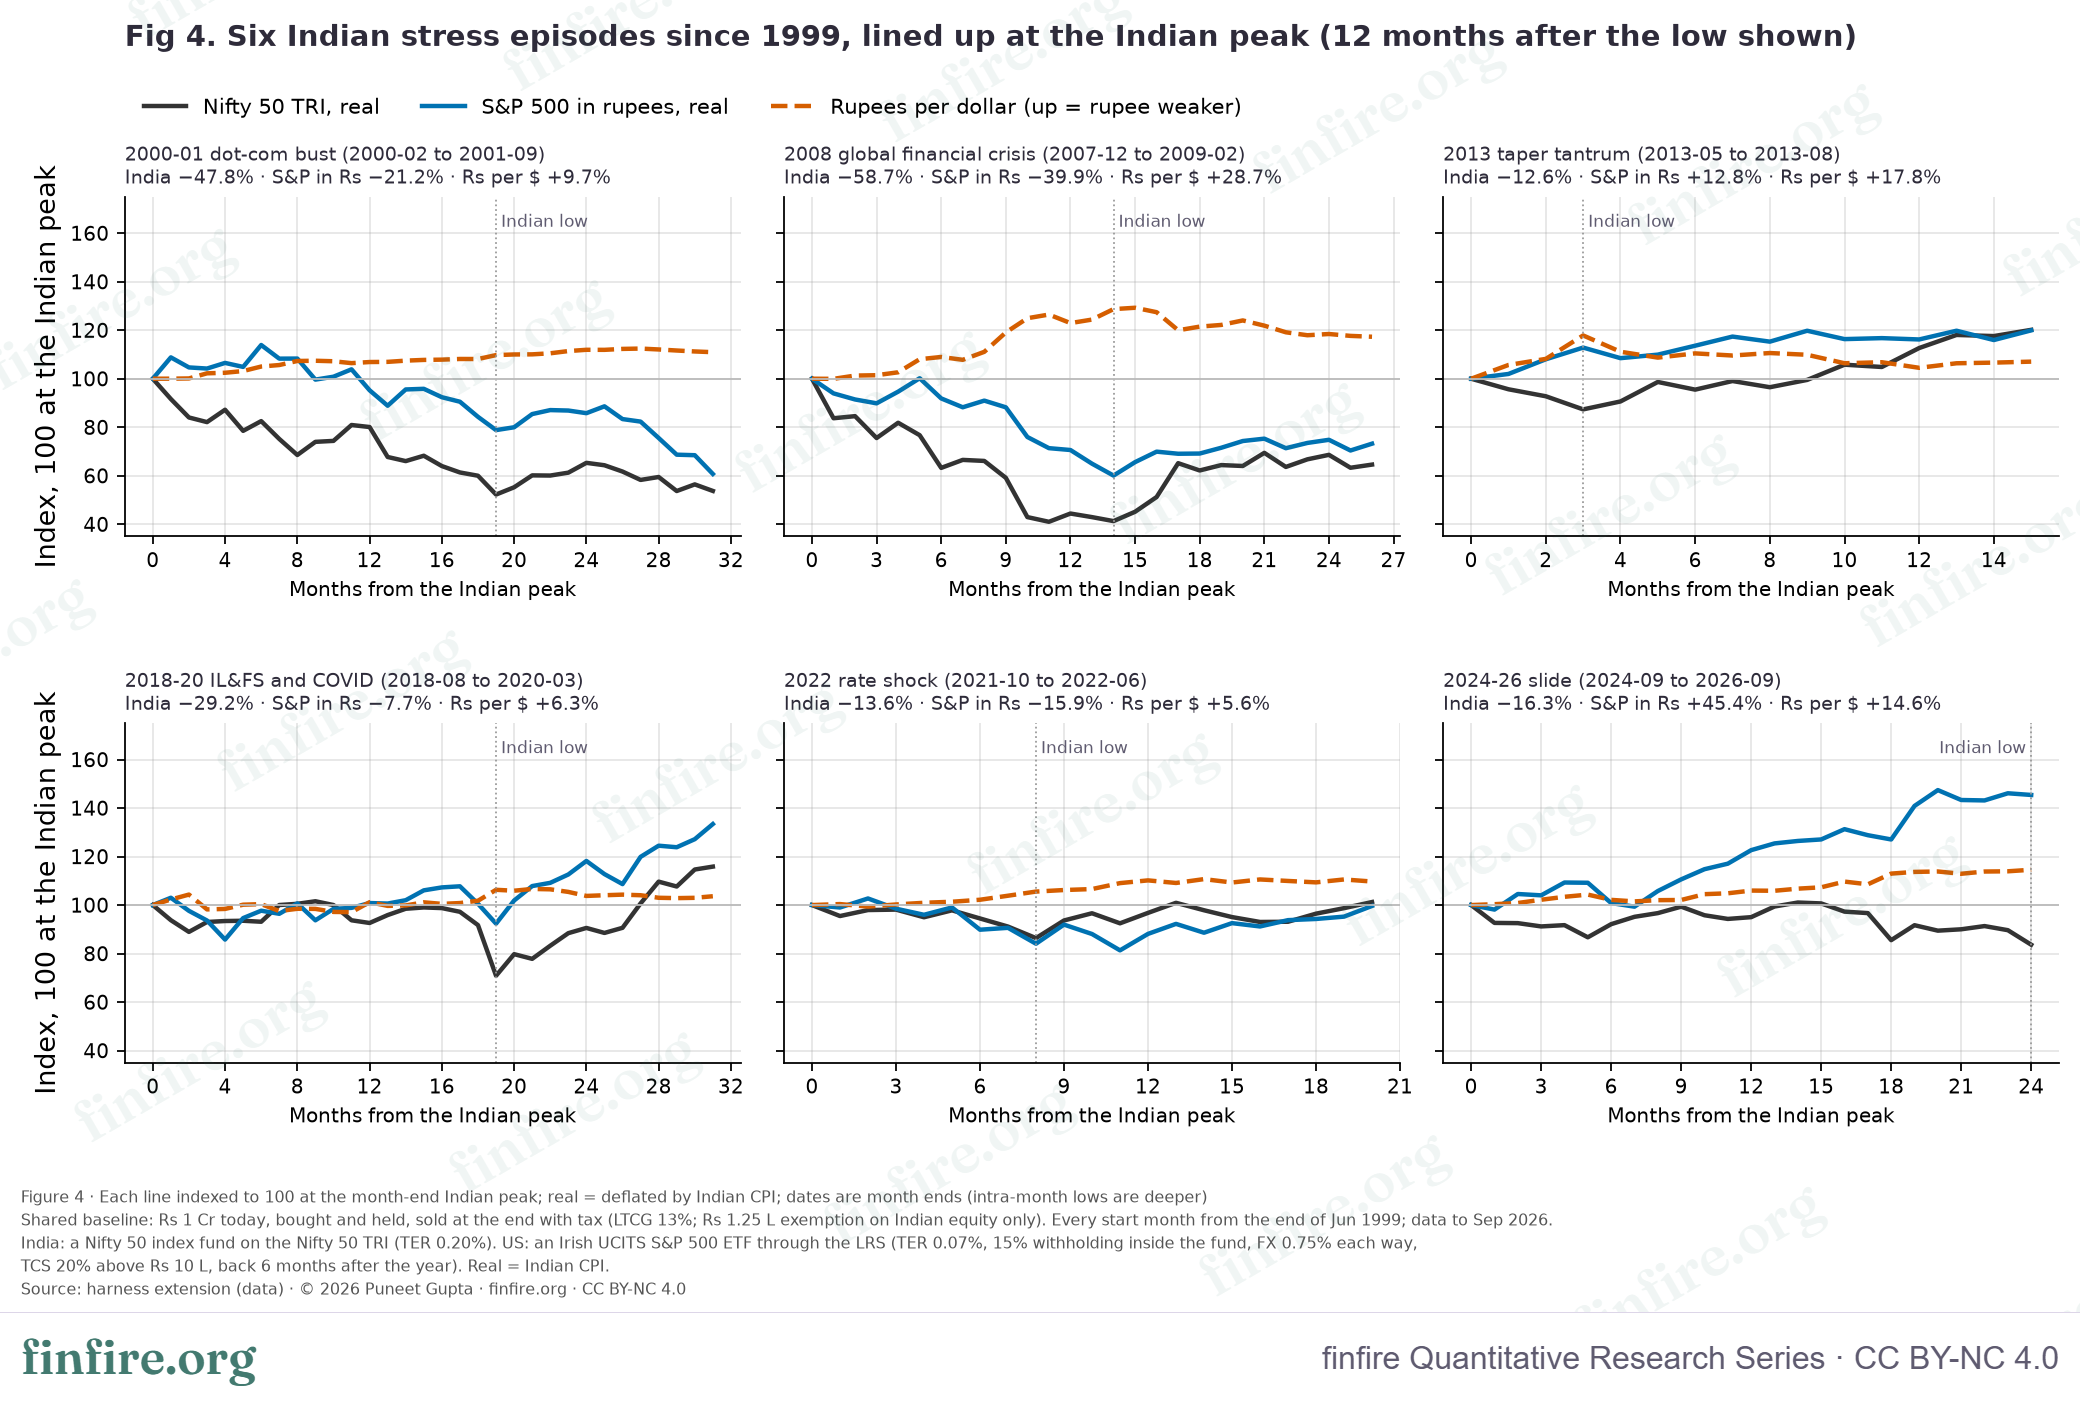
The six episodes in Table 4 show the cushion at work, and where it failed.
- 2008 global financial crisis. The real Nifty fell 58.7%. The S&P 500 fell 48.5% in dollars, but the dollar rose 28.7% against the rupee, so in rupees the S&P fell 39.9%. At the Indian low, 70/30 was down 52.9% against 58.8% for India only. ₹1 Cr invested at the December 2007 peak took 158 months to be worth ₹1 Cr again in real terms for India only, 118 months at 70/30 and 83 at 50/50. The real Nifty itself took 156 months, to December 2020.
- 2013 taper tantrum. This was an Indian scare. The Nifty fell 12.6%, the dollar rose 17.8%, and the S&P 500 in rupees rose 12.8%. 70/30 was down only 6.2%.
- 2024–26 slide. The Nifty fell 16.3%, the dollar rose 14.6%, and the S&P 500 in rupees rose 45.4%. 70/30 was down 1.2%, and 50/50 was up 8.8%. The low in this episode is the last month of the data, so it may not be over.
- 2018–20, IL&FS and COVID. The Nifty fell 29.2%; the S&P 500 in rupees fell 7.7%. 70/30 was down 23.5% against 29.4%.
- 2000–01 dot-com bust: no shelter. The crash started in America. The S&P 500 fell 22.3% in dollars, and a 9.7% rise in the dollar left it down 21.2% in rupees. At the Indian low, 70/30 was down 40.1% against 47.9%. But the US kept falling after India turned. After the February 2000 peak, 70/30 took 64 months to get back to ₹1 Cr, against 46 for India only.
- 2022 rate shock: no shelter. The S&P 500 in rupees fell 15.9%, more than the Nifty's 13.6%. 70/30 was down 14.4% against 13.7%.
The pattern: when the trouble was Indian, or when the world ran to the dollar (2008), the cushion worked. When the trouble started in the US, it did not.
Table 4. Named Indian stress episodes, peak to low (month ends; real = after Indian CPI; blend values after tax). Source: harness extension.
| Episode | Indian peak → low | Nifty 50, real | S&P 500 in rupees, real | Rupees per dollar | S&P 500 in dollars | 100/0 at the low | 70/30 at the low | 50/50 at the low |
|---|---|---|---|---|---|---|---|---|
| 2000-01 dot-com bust | 2000-02 → 2001-09 | −47.8% | −21.2% | +9.7% | −22.3% | −47.9% | −40.1% | −35.1% |
| 2008 global financial crisis | 2007-12 → 2009-02 | −58.7% | −39.9% | +28.7% | −48.5% | −58.8% | −52.9% | −49.1% |
| 2013 taper tantrum | 2013-05 → 2013-08 | −12.6% | +12.8% | +17.8% | +0.7% | −12.7% | −6.2% | −2.2% |
| 2018-20 IL&FS and COVID | 2018-08 → 2020-03 | −29.2% | −7.7% | +6.3% | −8.1% | −29.4% | −23.5% | −19.6% |
| 2022 rate shock | 2021-10 → 2022-06 | −13.6% | −15.9% | +5.6% | −17.0% | −13.7% | −14.4% | −14.8% |
| 2024-26 slide | 2024-09 → 2026-09 | −16.3% | +45.4% | +14.6% | +36.1% | −16.7% | −1.2% | +8.8% |
charts/fig4_stress_episodes_data.csv.Why the worst ending did not improve
If the rupee falls at the right time, why is the worst 20-year ending not better? Two reasons: the US shares returned less, and the rupee fell less than it "should" have.
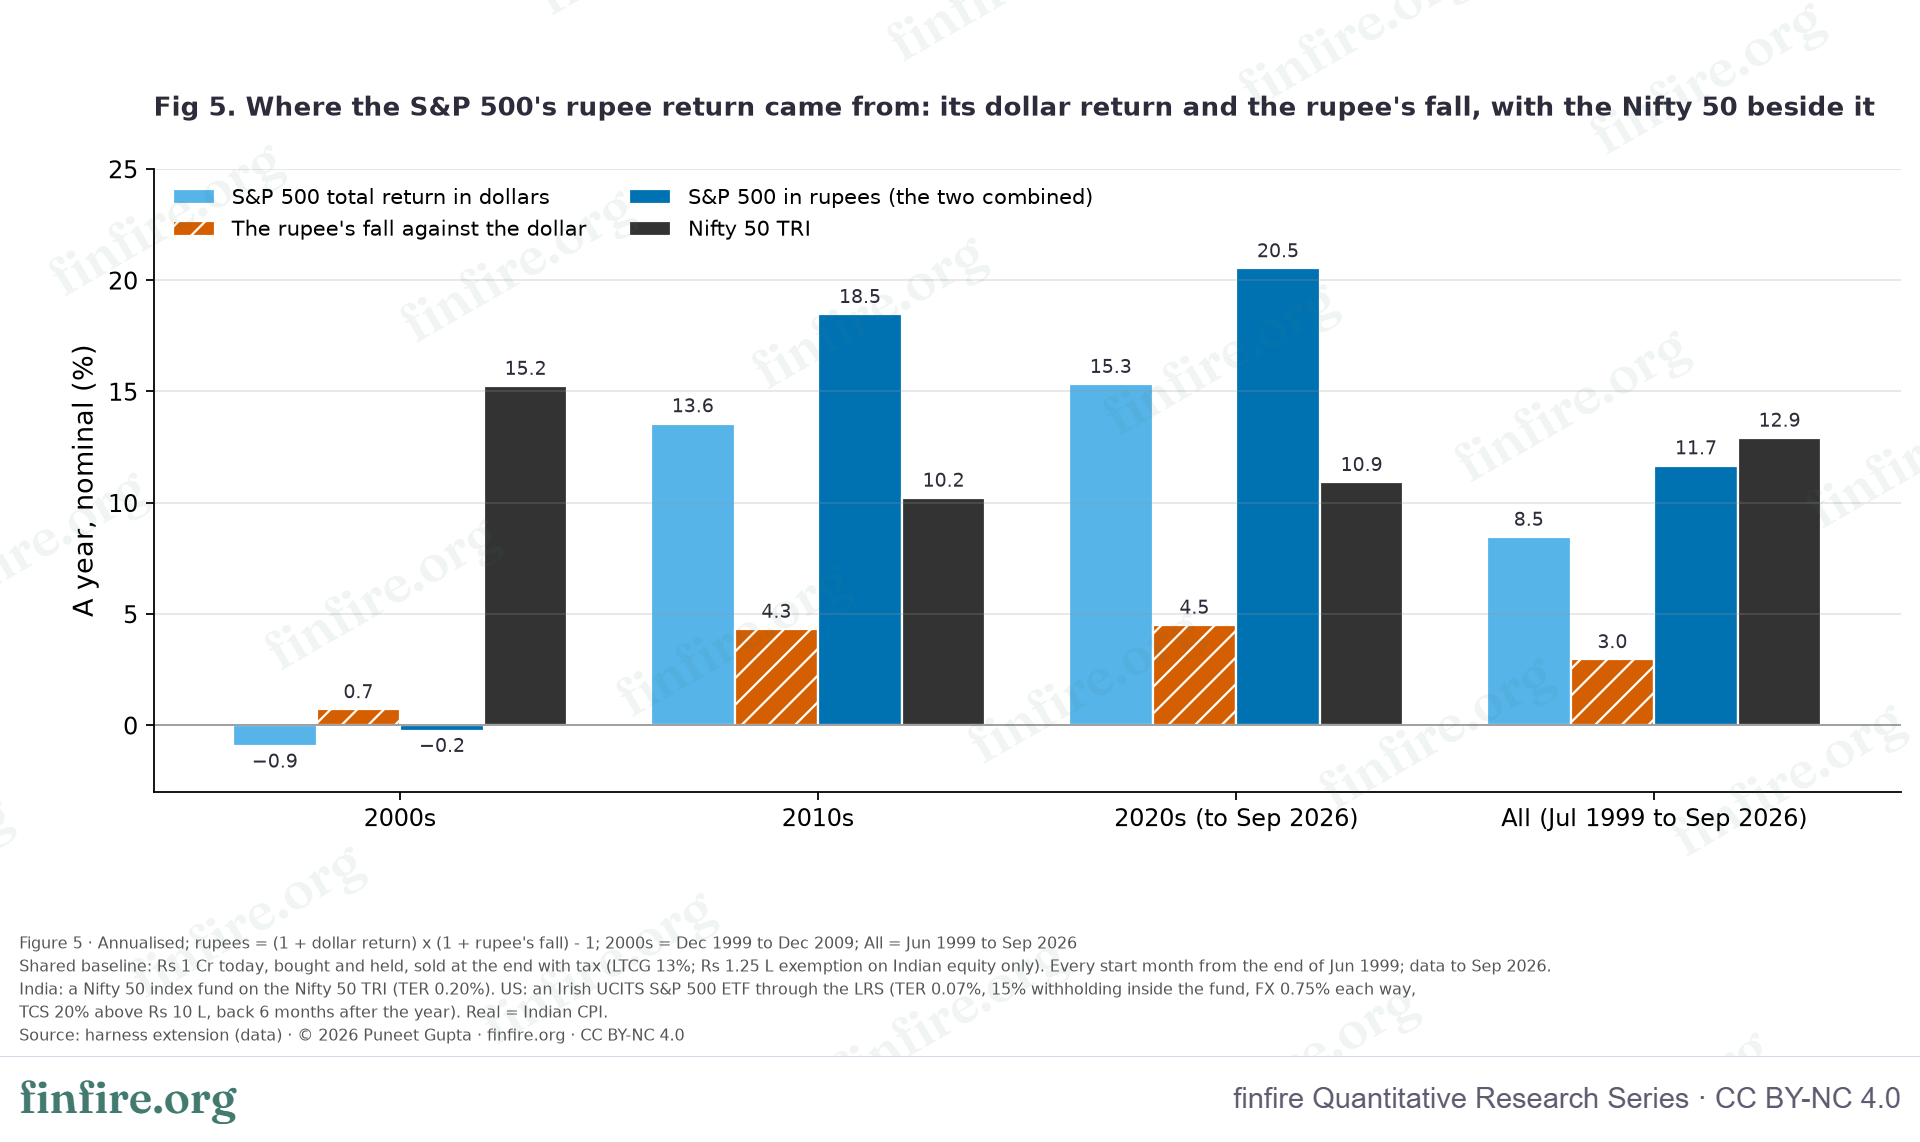
The S&P 500 in rupees returned less than the Nifty. Its rupee return is its dollar return plus the rupee's fall, plus a small cross term. From July 1999 to September 2026 that was 8.46% plus 2.96%, giving 11.67% a year. The Nifty 50 TRI returned 12.91%. The whole Nifty lead came from the 2000s, when the S&P 500 lost 0.25% a year in rupees and the Nifty made 15.24%. The S&P won the 2010s (18.47% against 10.21%) and the 2020s so far (20.53% against 10.92%). Every 20-year window in this history starts between 1999 and 2006, so each one holds part of that stretch.
The rupee gave no bonus. Indian inflation averaged 5.92% and US inflation 2.63%: a gap of 3.21% a year. The rupee fell 2.96% a year, from ₹43.36 to ₹95.98 a dollar. That is less than the gap, so in real terms the rupee rose 0.25% a year. An Indian holder of US shares was paid for the dollar's fall, but not quite in full for the inflation difference.
Table 5. The S&P 500 in rupees = its dollar return plus the rupee's fall, by decade. Source: harness extension (data).
| Period | S&P 500 in dollars | Rupee's fall | S&P 500 in rupees | Nifty 50 TRI | Indian CPI | Nifty 50, real | S&P 500 in rupees, real |
|---|---|---|---|---|---|---|---|
| 2000s | −0.95% | 0.71% | −0.25% | 15.24% | 6.11% | 8.61% | −5.99% |
| 2010s | 13.56% | 4.32% | 18.47% | 10.21% | 6.44% | 3.55% | 11.30% |
| 2020s (to Sep 2026) | 15.33% | 4.51% | 20.53% | 10.92% | 4.94% | 5.70% | 14.85% |
| All (Jul 1999 to Sep 2026) | 8.46% | 2.96% | 11.67% | 12.91% | 5.92% | 6.60% | 5.42% |
charts/fig5_usd_vs_currency_by_decade_data.csv.To separate the parts, we re-ran 70/30 four ways (Table 6). Each column changes one thing.
- Add the S&P 500 but hold the rupee flat. The worst-5% 20-year return drops from 4.06% to 3.34% (−0.71 points). The S&P's own return was too low.
- Let the rupee fall at the inflation gap. The worst 5% rises to 4.17% (+0.83). With a "fair" rupee, 70/30 would have edged past India only.
- Use each window's own steady rupee fall. The worst 5% drops to 3.87% (−0.30). The rupee fell less than the inflation gap.
- Use the real month-by-month rupee. The worst 5% stays at 3.87% (0.00). Timing cannot lift the end value of a buy-and-hold portfolio.
The timing shows up in the path instead. With the rupee's actual trend but no timing, the longest 20-year spell is 12.9 years. With the real month-by-month rupee, it is 10.7 years. That gap is the shock absorber at work: the rupee falling when the Nifty fell. The Ulcer Index moves the same way (23.3 to 22.6). The withdrawal rate does not (6.54% to 6.49%).
Table 6. Where the 70/30 result comes from. Each column adds one piece. All blends are in Appendix A1. Source: harness extension.
| Measure | India only (100/0) | + S&P 500, rupee held flat | + rupee moving with the inflation gap | + the window's own steady rupee fall | Actual (trend + timing) |
|---|---|---|---|---|---|
| 5th-percentile real CAGR, 20 years | 4.06% | 3.34% | 4.17% | 3.87% | 3.87% |
| Median real CAGR, 20 years | 6.73% | 5.67% | 6.53% | 6.36% | 6.36% |
| Mean of worst 5%, 20 years | 3.61% | 3.05% | 3.75% | 3.46% | 3.46% |
| 5th-percentile real CAGR, 10 years | 0.22% | −0.13% | 1.56% | 0.94% | 0.96% |
| Ulcer Index, median 20-year window | 25.0 | 24.4 | 21.8 | 23.3 | 22.6 |
| Longest spell, any 20-year window (years) | 13.0 | 13.0 | 10.6 | 12.9 | 10.7 |
| 5th-percentile SWR, 20 years | 6.86% | 6.19% | 6.69% | 6.54% | 6.49% |
Withdrawal rates
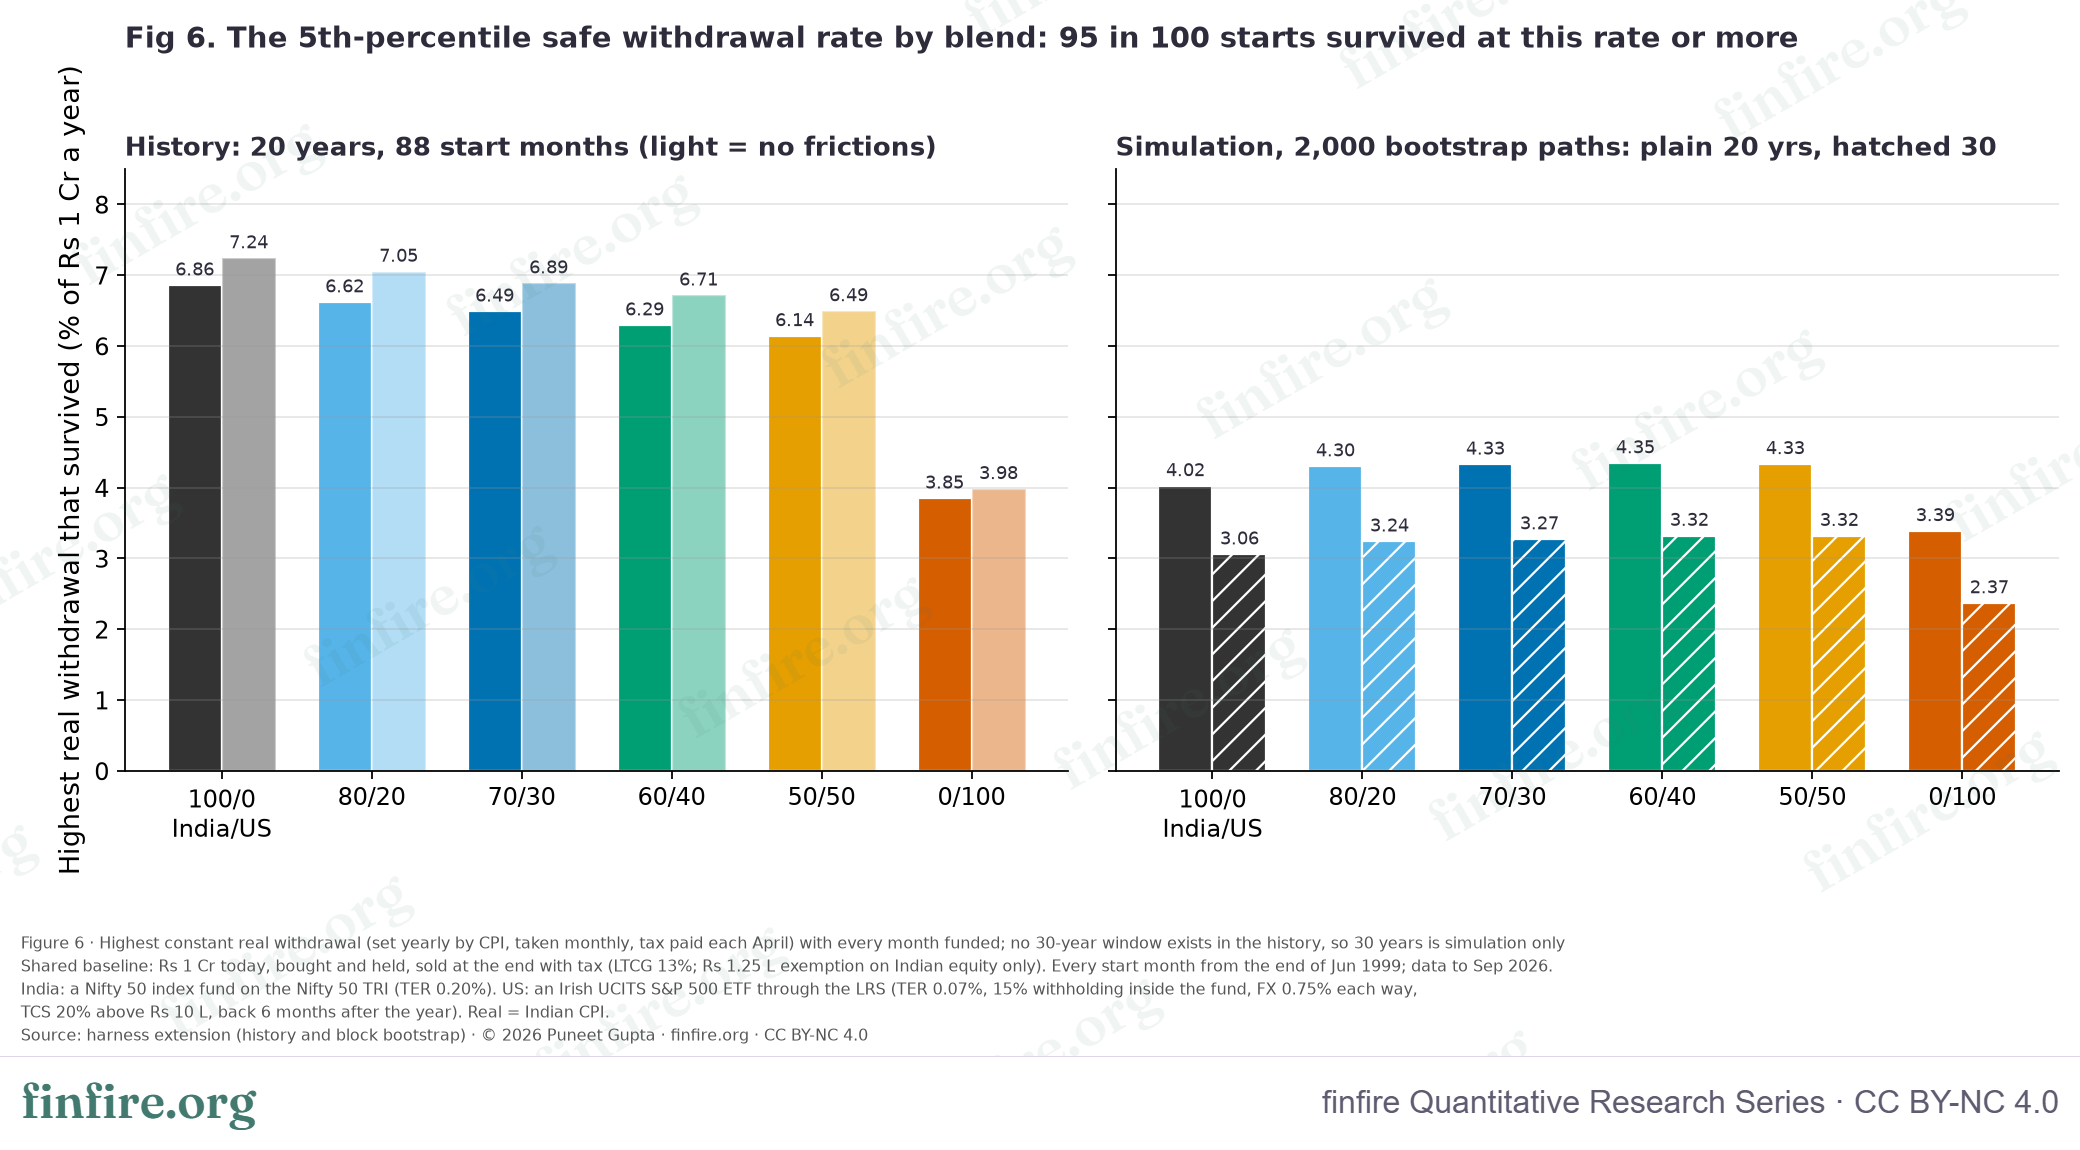
The thesis also says a foreign share should raise the 5th-percentile safe withdrawal rate. Over 20 years of history it did not. The 5th-percentile rate was 6.86% for India only, then 6.62%, 6.49%, 6.29% and 6.14% as the US share grew to 50%, and 3.85% for US only. Lower with every step abroad. Without frictions the order is the same (7.24% for India only, 6.89% at 70/30).
These 20-year rates are high because 20 years is a short retirement. Do not compare them with 30- or 40-year rates such as those in Paper 4 (Stress Testing India's Safe Withdrawal Rate).
The block bootstrap (simulation, not history) tells a slightly different story. Its 5th-percentile 20-year rates are 4.02% for India only and 4.33% at 70/30. At 30 years they are 3.06% for India only, 3.24% at 80/20, 3.27% at 70/30, 3.32% at 60/40 and 50/50, and 2.37% for US only. In simulation, a US share helps a little. One likely reason: shuffling 24-month blocks breaks up the one long stretch, the 2000s, in which the S&P 500 lost money in rupees while the Nifty boomed. The simulation also builds worse paths than history did, which is why its rates are lower.
Table 7. The 5th-percentile safe withdrawal rate (% of ₹1 Cr a year, real; every month funded, tax paid each April). Source: harness extension.
| Blend | History, 20 years: frictions on | History, 20 years: no frictions | Worst start month (frictions on) | Median (frictions on) | Bootstrap, 20 years | Bootstrap, 30 years |
|---|---|---|---|---|---|---|
| 100/0 | 6.86% | 7.24% | 6.29% (2006-04) | 9.66% | 4.02% | 3.06% |
| 80/20 | 6.62% | 7.05% | 6.26% (2006-04) | 8.93% | 4.30% | 3.24% |
| 70/30 | 6.49% | 6.89% | 6.22% (2006-04) | 8.58% | 4.33% | 3.27% |
| 60/40 | 6.29% | 6.71% | 6.04% (2000-02) | 8.23% | 4.35% | 3.32% |
| 50/50 | 6.14% | 6.49% | 5.80% (2000-02) | 7.86% | 4.33% | 3.32% |
| 0/100 | 3.85% | 3.98% | 3.69% (2000-08) | 5.77% | 3.39% | 2.37% |
charts/fig6_swr_p5_by_blend_data.csv.What the frictions cost
Forums often say the costs of investing abroad eat the benefit. In this test they were small next to tax at sale, and tax at sale hits an India-only investor too.
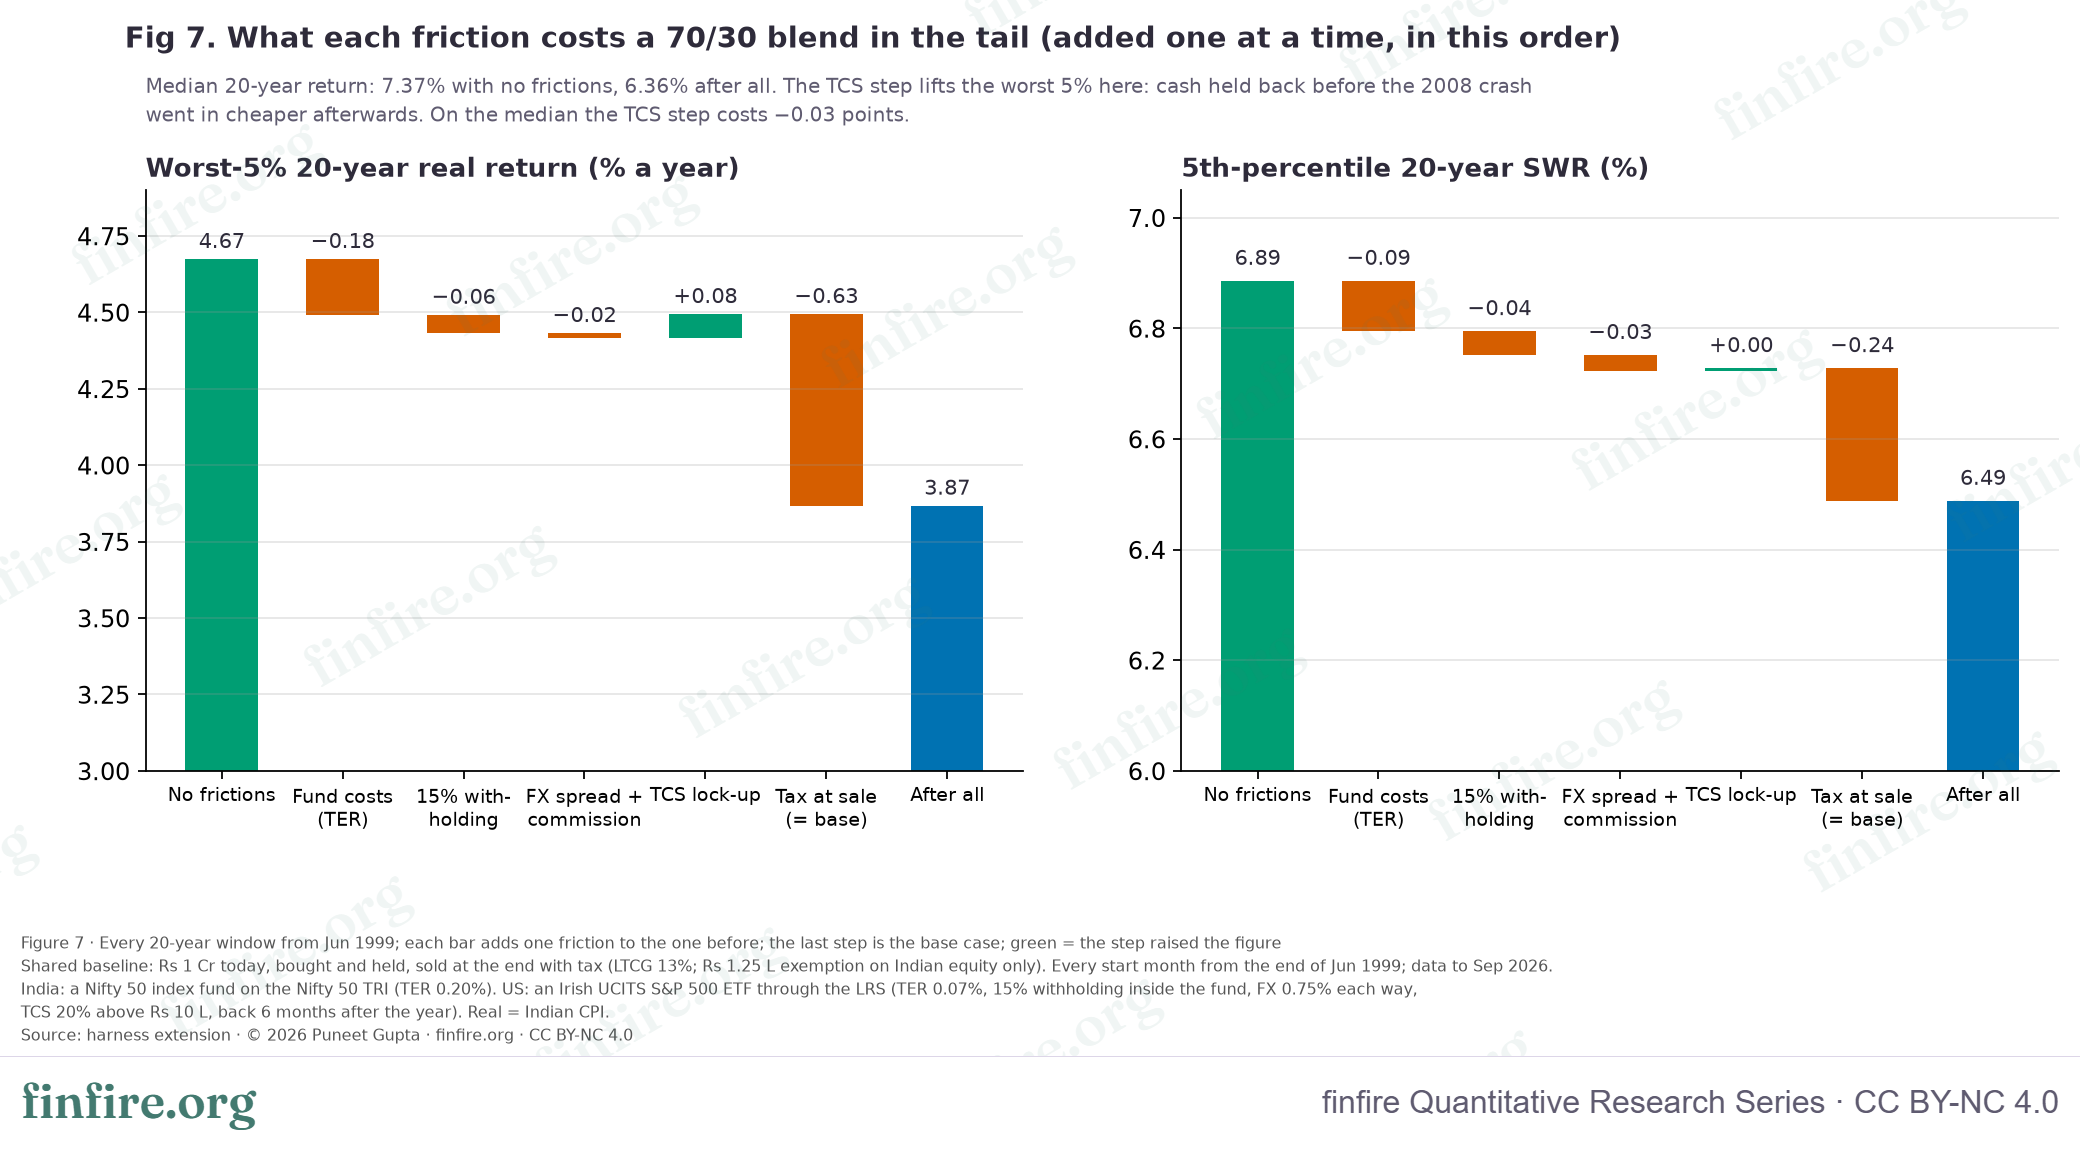
For 70/30, the worst-5% 20-year return is 4.67% with no frictions and 3.87% after all of them (−0.81 points). Fund costs take −0.18, withholding −0.06, and the FX spread and commission −0.02. Tax at sale takes −0.63. The TCS lock-up added +0.08, by luck of timing: cash held back before the 2008 crash went in cheaper. On the median window, TCS cost −0.03. For India only, all frictions together cost −0.84 points. The 20-year withdrawal rate for 70/30 goes from 6.89% to 6.49%. For 70/30, ₹3,77,358 of TCS is paid at the start (median window) and locked up until the refund.
Table 8. What each friction does to 70/30, added one at a time in this order. Other blends are in Appendix A2. Source: harness extension.
| Step | Median 20-year real CAGR | 5th pct | Mean of worst 5% | 5th-pct SWR, 20 years |
|---|---|---|---|---|
| No frictions | 7.37% | 4.67% | 4.26% | 6.89% |
| + fund costs (Nifty fund 0.20%, UCITS 0.07%) | 7.20% | 4.49% | 4.08% | 6.79% |
| + 15% withholding inside the fund | 7.10% | 4.43% | 4.02% | 6.75% |
| + FX spread 0.75% each way and 0.05% commission | 7.08% | 4.42% | 4.00% | 6.72% |
| + TCS 20% above ₹10 L, back 6 months after the year | 7.05% | 4.49% | 4.07% | 6.73% |
| + tax at sale (13%; ₹1.25 L exemption on Indian equity) = base | 6.36% | 3.87% | 3.46% | 6.49% |
charts/fig7_friction_waterfall_data.csv.The route matters less than the blend (Table 9). For 70/30, the worst-5% 20-year return is 3.87% through an Irish UCITS fund, 3.83% through a US-listed (VOO-type) fund and 3.69% through an Indian fund of funds with a 0.50% TER. Indian funds also face industry limits on overseas investing (US$1 bn per fund house and US$7 bn for the industry), and some paused new money in 2026, so a lump sum may not be accepted. The US-listed route carries US estate tax. Its expected cost over 20 years, from age 40, is ₹0.56 L at 70/30 and ₹4.05 L for US only (median window, real). Paper 7 explains this risk in detail.
Two changes did better than the base. Rebalancing to 70/30 every year, with tax paid on each sale, lifted the worst 5% to 4.00% and smoothed the ride (Ulcer Index 19.4, longest spell 10.0 years). Using the Nifty 500 TRI as the Indian leg lifted every blend. With it, 70/30 (4.43%) edged past India only (4.39%).
Table 9. Routes and variants, 20-year windows: median / 5th-percentile real CAGR. All variants and blends are in Appendix A3. Source: harness extension.
| Path | 100/0 | 70/30 | 50/50 |
|---|---|---|---|
| Base: UCITS (Ireland) route, buy and hold, unhedged | 6.73% / 4.06% | 6.36% / 3.87% | 6.12% / 3.34% |
| US-listed fund (VOO-type), dividends paid out and taxed | 6.73% / 4.06% | 6.31% / 3.83% | 6.02% / 3.27% |
| Indian fund of funds (no LRS, TER 0.50%) | 6.73% / 4.06% | 6.25% / 3.69% | 5.94% / 3.03% |
| Surcharge on (salary ₹30 L + the gains) | 6.62% / 3.95% | 6.25% / 3.77% | 6.01% / 3.25% |
| TCS set off at once against tax due (no lock-up) | 6.73% / 4.06% | 6.39% / 3.79% | 6.19% / 3.22% |
| TCS back 18 months after the year ends | 6.73% / 4.06% | 6.31% / 3.89% | 6.10% / 3.40% |
| Rebalanced every year, tax paid on each sale | 6.73% / 4.06% | 6.56% / 4.00% | 6.34% / 3.45% |
| Nifty 500 TRI for the Indian leg | 7.45% / 4.39% | 6.71% / 4.43% | 6.42% / 3.77% |
| No frictions (no costs, no withholding, no TCS, no tax) | 7.64% / 4.90% | 7.37% / 4.67% | 7.21% / 4.13% |
Hedged or unhedged?
The thesis says the dollar exposure must stay unhedged, because the rupee's fall is the shock absorber. A hedge sells the dollar forward. It removes the rupee's moves and earns the India–US short-term rate gap instead.
In this history, the hedge would have won. The rate gap earned 4.18% a year; the rupee fell 2.96%. A hedged 70/30 had a worst-5% 20-year return of 4.36%, against 3.87% unhedged and 3.34% with the rupee held flat. Its 20-year withdrawal rate was 6.72% against 6.49%. Even the 20-year Ulcer Index was slightly lower (22.3 against 22.6). For US only, hedging lifted the worst 5% from 1.28% to 3.56%.
Over 10 years, the trade-off the thesis describes does appear. A hedged 70/30 had the better worst 5% (1.55% against 0.96%), but the unhedged one had the smoother ride (Ulcer Index 18.9 against 20.2).
Two cautions. The hedge's past edge rests on a wide rate gap, and today that gap is only 1.45 points (India 3-month 5.27%, US 3.82%, August 2026). And the hedged path is an analytical construct: it has no dealing costs, and this paper does not test whether an individual investor can set one up.
Table 10. Hedged against unhedged US share, 20-year windows (the hedged path is analytical). 10-year rows are in Appendix A3. Source: harness extension.
| Blend | US share | Median real CAGR | 5th pct | Mean of worst 5% | Ulcer Index (median) | Longest spell, any window (years) | 5th-pct SWR |
|---|---|---|---|---|---|---|---|
| 80/20 | hedged | 6.69% | 4.37% | 3.99% | 23.2 | 10.7 | 6.82% |
| 80/20 | unhedged | 6.46% | 4.09% | 3.68% | 23.5 | 12.9 | 6.62% |
| 80/20 | rupee held flat | 6.07% | 3.63% | 3.31% | 24.6 | 13.0 | 6.43% |
| 70/30 | hedged | 6.75% | 4.36% | 3.93% | 22.3 | 10.1 | 6.72% |
| 70/30 | unhedged | 6.36% | 3.87% | 3.46% | 22.6 | 10.7 | 6.49% |
| 70/30 | rupee held flat | 5.67% | 3.34% | 3.05% | 24.4 | 13.0 | 6.19% |
| 50/50 | hedged | 6.76% | 4.22% | 3.80% | 20.3 | 9.6 | 6.52% |
| 50/50 | unhedged | 6.12% | 3.34% | 2.95% | 20.5 | 10.1 | 6.14% |
| 50/50 | rupee held flat | 4.87% | 2.60% | 2.18% | 23.7 | 13.0 | 5.67% |
| 0/100 | hedged | 6.72% | 3.56% | 3.25% | 17.0 | 13.9 | 4.74% |
| 0/100 | unhedged | 4.77% | 1.28% | 1.05% | 16.7 | 17.4 | 3.85% |
| 0/100 | rupee held flat | 2.04% | −1.05% | −1.33% | 24.3 | 20.0 | 3.34% |
charts/fig8_hedged_vs_unhedged_data.csv.How much history stands behind these numbers
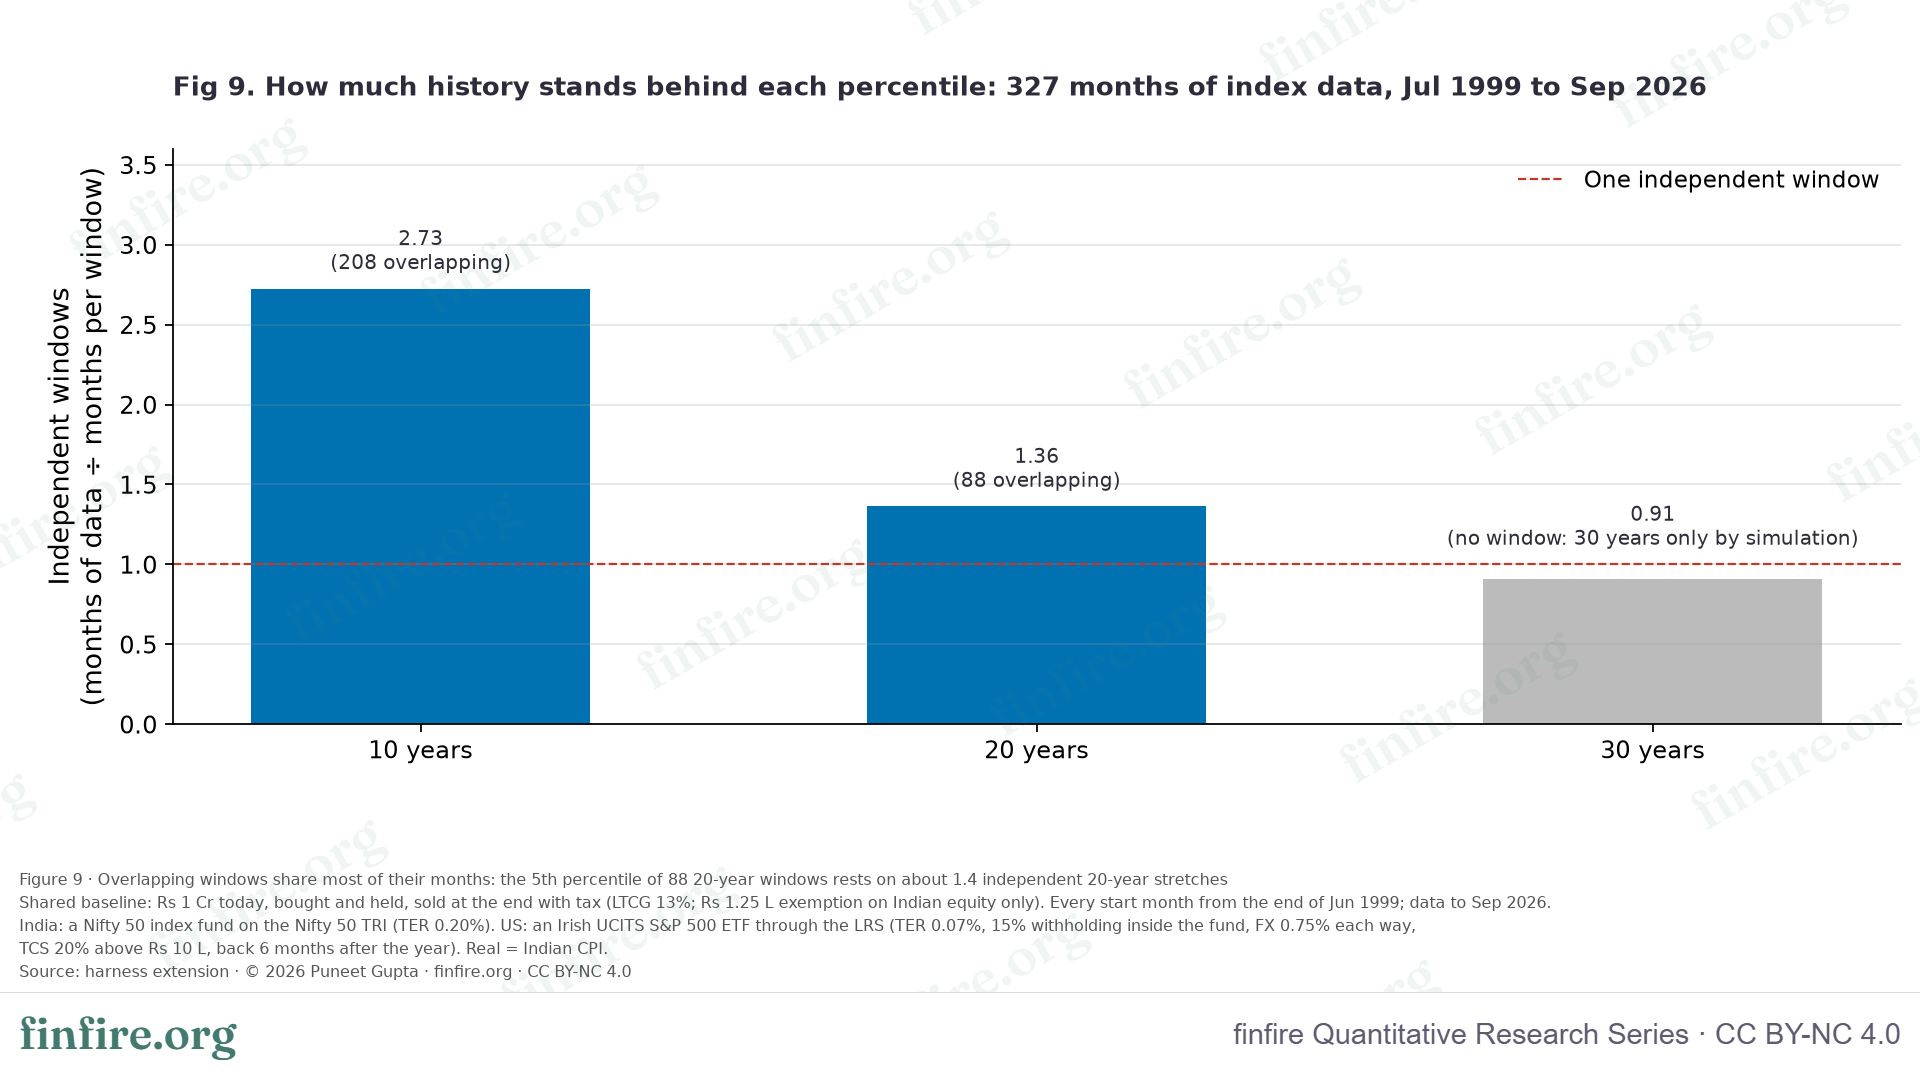
Not much, and this matters. The 88 twenty-year windows overlap heavily: neighbouring windows share almost every month. Together they hold about 1.36 independent 20-year stretches. The 208 ten-year windows hold about 2.73. There is no 30-year window at all (0.91 of one).
So "the worst 5% of 20-year windows" is not a measured probability. It is, in effect, one bad stretch: 2008 for India, and the 2000s for the US. All 88 twenty-year windows start between June 1999 and September 2006. A different 27 years could give a different answer.
Table 11. Sample size. Source: harness extension.
| Horizon | Overlapping windows | Non-overlapping windows | Independent equivalent (months ÷ horizon) |
|---|---|---|---|
| 10 years | 208 | 2 | 2.73 |
| 20 years | 88 | 1 | 1.36 |
| 30 years | 0 | 0 | 0.91 |
charts/fig9_sample_size_data.csv.What the calculator shows
The calculator runs one steady return, not history. On the June 1999 to September 2026 averages, ₹1 Cr held for 20 years ends at ₹3.46 Cr in today's money for India only, ₹3.21 Cr at 70/30, ₹3.05 Cr at 50/50 and ₹2.69 Cr for US only. Over 30 years it ends at ₹6.45 Cr for India only and ₹5.76 Cr at 70/30.
In its simulated markets, the calculator moves the fund abroad together with Indian equity. So it cannot show the rupee's cushion. For 70/30, "9 in 10 end with at least" ₹69.66 L, against ₹75.14 L for India only, and the gap comes only from the lower steady return. The calculator agrees with history on the average. By design, it does not see the timing. The drawdown and withdrawal results in this paper come from the history runs.
What this means for you
This paper describes what happened from 1999 to 2026. It does not tell you what to hold.
- If your worry is a long stay below your peak, the history is on Bernstein's side. A 30% to 50% S&P 500 share cut the longest real loss spell in a 20-year window from 13.0 years to between 10.1 and 10.7 years. Over 10 years, India only, 80/20 and US only each had a window that never got back to its peak.
- If your worry is the worst 20-year ending, or the withdrawal rate, the history is on the forums' side. India only, or 80/20, did as well as anything since 1999.
- The cushion came from timing, not from extra return. The rupee fell when the Nifty fell in every 36-month stretch of this history. Whether the S&P 500 also adds return depends on the decade: it lost to the Nifty in the 2000s and beat it in the 2010s and the 2020s so far.
- The cushion is against equity crashes, not inflation. The rupee showed no clear link with Indian inflation. And it gave no shelter when the crash started in the US, as in 2000–01 and 2022.
- All-US was the worst of both. It had the longest single spell (17.4 years) and the lowest worst-5% 20-year return (1.28%).
- Cross-border costs were small. Fund costs, withholding, FX and TCS together cost less than the tax at sale, which India-only investors pay too.
- The hedged result rests on a rate gap that has shrunk. The past gap was 4.18% a year; today it is 1.45 points.
Limitations
- Short history. 27 years of index data: about 1.36 independent 20-year stretches. All 88 twenty-year windows start between June 1999 and September 2006 and share most of their months.
- No 30-year history. The 30-year figures are a block bootstrap of the same 27 years. A simulation cannot create a crisis the history does not contain.
- One pair of markets. India against the US only. We could not run a global index without India (MSCI ACWI ex-India), because we found no free monthly source.
- Index data, not funds. Tracking error and fund-level cash drag are ignored, apart from the TERs stated.
- Lump sum only. ₹1 Cr invested at once. Monthly investing (SIPs) was not tested.
- Today's rules on past markets. LRS began in 2004, and TCS, its threshold and the limits on overseas funds have all changed over time. The insurance itself sits inside Indian rules, and a change in those rules is one of the risks it is meant to cover. This history cannot test that.
- Bernstein's other horsemen. Confiscation and devastation did not happen in this history, so the paper says nothing about them.
- The hedge is analytical. No dealing costs, and no test of whether an individual can set one up.
- Not modelled: the nil slab set against gains, the 87A rebate, interest on TCS refunds, the cost of Schedule FA compliance, exit loads, and rule changes after FY 2026-27.
Try this scenario yourself
The calculator runs one steady return, so it shows the average effect of holding part of your savings abroad. It does not show the drawdown and withdrawal results above; those come from this paper's history runs. Sign in to open the links. All three scenarios need Pro (Investing abroad, Compare).
Scenario 1 · Nothing abroad against 30% in an Ireland-listed S&P 500 fund, 20 years · Pro
Step 1 · Open the India-only plan. Open This is ₹1 Cr held for 20 years at the June 1999 to September 2026 average returns. The page shows: After 20 years you will have ₹10.95 Cr — ₹3.46 Cr in today’s money.
Step 2 · Pin it (Pro). Under Compare (Pro), press Pin this plan (create a baseline plan to compare). It becomes Plan A.
Step 3 · Hold 30% abroad (Pro). Open Investing abroad (Pro). Tick Hold part of my equity abroad. Set Share of your savings held abroad to 30. Under Where the fund is listed, choose Ireland (such as CSPX): dividends kept in the fund. Set Its return to 11.6, Dividends to 1.85 and The rupee's fall to 2.96.
Step 4 · Read the answer. The page shows: After 20 years you will have ₹10.15 Cr — ₹3.21 Cr in today’s money. The Compare card says: Both plans stop working in the same year, with ₹25.21 L less in today’s money. (In accumulate, "stop working" is the year the saving ends: here, the end of the holding period.)
Scenario 2 · The same switch over 30 years · Pro
Step 1 · Open the 30-year India-only plan. Open The page shows: After 30 years you will have ₹36.21 Cr — ₹6.45 Cr in today’s money.
Step 2 · Pin it (Pro). Under Compare (Pro), press Pin this plan (create a baseline plan to compare). It becomes Plan A.
Step 3 · Hold 30% abroad (Pro). Open Investing abroad (Pro) and make the same changes as in Scenario 1, Step 3.
Step 4 · Read the answer. The page shows: After 30 years you will have ₹32.33 Cr — ₹5.76 Cr in today’s money. The Compare card says: Both plans stop working in the same year, with ₹69.10 L less in today’s money.
Scenario 3 · Simulated markets: the calculator moves the fund abroad with Indian equity · Pro
Step 1 · Open the India-only plan with simulated markets on (Pro). Open The page shows: In 2,000 simulated markets, 9 in 10 end with at least ₹75.14 L, half with at least ₹3.20 Cr, and 1 in 10 with ₹15.49 Cr or more (in today’s money).
Step 2 · Pin it (Pro). Under Compare (Pro), press Pin this plan (create a baseline plan to compare). It becomes Plan A.
Step 3 · Hold 30% abroad (Pro). Open Investing abroad (Pro) and make the same changes as in Scenario 1, Step 3.
Step 4 · Read the answer. The page shows: In 2,000 simulated markets, 9 in 10 end with at least ₹69.66 L, half with at least ₹2.97 Cr, and 1 in 10 with ₹14.37 Cr or more (in today’s money). The Compare card says: Both plans stop working in the same year, with ₹25.21 L less in today’s money. The card compares the two plans on their steady returns; the simulated-markets line is what changes with the markets.
Other blends (Pro: Investing abroad). Each link opens ₹1 Cr for 20 years at the 1999–2026 averages:
- 80/20: Open The page shows: After 20 years you will have ₹10.41 Cr — ₹3.29 Cr in today’s money.
- 70/30: Open The page shows: After 20 years you will have ₹10.15 Cr — ₹3.21 Cr in today’s money.
- 60/40: Open The page shows: After 20 years you will have ₹9.90 Cr — ₹3.13 Cr in today’s money.
- 50/50: Open The page shows: After 20 years you will have ₹9.65 Cr — ₹3.05 Cr in today’s money.
- 0/100: Open The page shows: After 20 years you will have ₹8.50 Cr — ₹2.69 Cr in today’s money.
- 70/30 over 30 years: Open The page shows: After 30 years you will have ₹32.33 Cr — ₹5.76 Cr in today’s money.
- 70/30 with simulated markets (Pro: Investing abroad, Simulated markets): Open The page shows: In 2,000 simulated markets, 9 in 10 end with at least ₹69.66 L, half with at least ₹2.97 Cr, and 1 in 10 with ₹14.37 Cr or more (in today’s money).
Reproducibility
Every calculator link in this paper was reopened in a fresh copy of the page and gave the same answer to the paisa. The links are listed in urls.csv. The history runs match the calculator to the paisa under the calculator's own rules (35 plans). They were re-computed independently in plain Python: 61 numbers, 0 differences. Everything was regenerated from saved inputs twice, with identical results. The data behind each figure is in the CSV named in its caption.
Appendix
A1. Where the result comes from, every blend
Each column adds one piece to India only. Source: harness extension.
| Blend | Measure | India only (100/0) | + S&P 500, rupee held flat | + rupee moving with the inflation gap | + the window's own steady rupee fall | Actual (trend + timing) |
|---|---|---|---|---|---|---|
| 80/20 | 5th-percentile real CAGR, 20 years | 4.06% | 3.63% | 4.22% | 4.09% | 4.09% |
| 80/20 | Median real CAGR, 20 years | 6.73% | 6.07% | 6.57% | 6.46% | 6.46% |
| 80/20 | Mean of worst 5%, 20 years | 3.61% | 3.31% | 3.87% | 3.68% | 3.68% |
| 80/20 | 5th-percentile real CAGR, 10 years | 0.22% | −0.03% | 1.29% | 0.90% | 0.90% |
| 80/20 | Ulcer Index, median 20-year window | 25.0 | 24.6 | 22.9 | 23.9 | 23.5 |
| 80/20 | Longest spell, any 20-year window (years) | 13.0 | 13.0 | 11.3 | 13.0 | 12.9 |
| 80/20 | 5th-percentile SWR, 20 years | 6.86% | 6.43% | 6.81% | 6.66% | 6.62% |
| 70/30 | 5th-percentile real CAGR, 20 years | 4.06% | 3.34% | 4.17% | 3.87% | 3.87% |
| 70/30 | Median real CAGR, 20 years | 6.73% | 5.67% | 6.53% | 6.36% | 6.36% |
| 70/30 | Mean of worst 5%, 20 years | 3.61% | 3.05% | 3.75% | 3.46% | 3.46% |
| 70/30 | 5th-percentile real CAGR, 10 years | 0.22% | −0.13% | 1.56% | 0.94% | 0.96% |
| 70/30 | Ulcer Index, median 20-year window | 25.0 | 24.4 | 21.8 | 23.3 | 22.6 |
| 70/30 | Longest spell, any 20-year window (years) | 13.0 | 13.0 | 10.6 | 12.9 | 10.7 |
| 70/30 | 5th-percentile SWR, 20 years | 6.86% | 6.19% | 6.69% | 6.54% | 6.49% |
| 60/40 | 5th-percentile real CAGR, 20 years | 4.06% | 3.05% | 4.04% | 3.62% | 3.62% |
| 60/40 | Median real CAGR, 20 years | 6.73% | 5.25% | 6.49% | 6.22% | 6.22% |
| 60/40 | Mean of worst 5%, 20 years | 3.61% | 2.64% | 3.61% | 3.22% | 3.21% |
| 60/40 | 5th-percentile real CAGR, 10 years | 0.22% | −0.41% | 1.84% | 1.11% | 1.12% |
| 60/40 | Ulcer Index, median 20-year window | 25.0 | 24.1 | 20.7 | 22.7 | 21.6 |
| 60/40 | Longest spell, any 20-year window (years) | 13.0 | 13.0 | 10.1 | 11.3 | 10.6 |
| 60/40 | 5th-percentile SWR, 20 years | 6.86% | 5.92% | 6.62% | 6.37% | 6.29% |
| 50/50 | 5th-percentile real CAGR, 20 years | 4.06% | 2.60% | 3.88% | 3.35% | 3.34% |
| 50/50 | Median real CAGR, 20 years | 6.73% | 4.87% | 6.45% | 6.12% | 6.12% |
| 50/50 | Mean of worst 5%, 20 years | 3.61% | 2.18% | 3.47% | 2.96% | 2.95% |
| 50/50 | 5th-percentile real CAGR, 10 years | 0.22% | −0.74% | 2.15% | 1.33% | 1.34% |
| 50/50 | Ulcer Index, median 20-year window | 25.0 | 23.7 | 19.4 | 22.0 | 20.5 |
| 50/50 | Longest spell, any 20-year window (years) | 13.0 | 13.0 | 9.8 | 10.7 | 10.1 |
| 50/50 | 5th-percentile SWR, 20 years | 6.86% | 5.67% | 6.39% | 6.24% | 6.14% |
| 0/100 | 5th-percentile real CAGR, 20 years | 4.06% | −1.05% | 2.73% | 1.32% | 1.28% |
| 0/100 | Median real CAGR, 20 years | 6.73% | 2.04% | 5.94% | 4.73% | 4.77% |
| 0/100 | Mean of worst 5%, 20 years | 3.61% | −1.33% | 2.46% | 1.07% | 1.05% |
| 0/100 | 5th-percentile real CAGR, 10 years | 0.22% | −6.61% | −3.57% | −6.10% | −6.17% |
| 0/100 | Ulcer Index, median 20-year window | 25.0 | 24.3 | 14.1 | 18.6 | 16.7 |
| 0/100 | Longest spell, any 20-year window (years) | 13.0 | 20.0 | 14.0 | 17.5 | 17.4 |
| 0/100 | 5th-percentile SWR, 20 years | 6.86% | 3.34% | 4.54% | 4.17% | 3.85% |
A2. Frictions, step by step
One friction added at a time, in this order; then the alternatives, each on the base. 20-year windows. Source: harness extension.
| Blend | Step | Median 20-year real CAGR | 5th pct | Mean of worst 5% | 5th-pct SWR, 20 years |
|---|---|---|---|---|---|
| 100/0 | No frictions | 7.64% | 4.90% | 4.44% | 7.24% |
| 100/0 | + fund costs (Nifty fund 0.20%, UCITS 0.07%) | 7.42% | 4.69% | 4.24% | 7.12% |
| 100/0 | + 15% withholding inside the fund | 7.42% | 4.69% | 4.24% | 7.12% |
| 100/0 | + FX spread 0.75% each way and 0.05% commission | 7.42% | 4.69% | 4.24% | 7.12% |
| 100/0 | + TCS 20% above ₹10 L, back 6 months after the year | 7.42% | 4.69% | 4.24% | 7.12% |
| 100/0 | + tax at sale (13%; ₹1.25 L exemption on Indian equity) = base | 6.73% | 4.06% | 3.61% | 6.86% |
| 100/0 | Surcharge on | 6.62% | 3.95% | 3.51% | 6.86% |
| 70/30 | No frictions | 7.37% | 4.67% | 4.26% | 6.89% |
| 70/30 | + fund costs (Nifty fund 0.20%, UCITS 0.07%) | 7.20% | 4.49% | 4.08% | 6.79% |
| 70/30 | + 15% withholding inside the fund | 7.10% | 4.43% | 4.02% | 6.75% |
| 70/30 | + FX spread 0.75% each way and 0.05% commission | 7.08% | 4.42% | 4.00% | 6.72% |
| 70/30 | + TCS 20% above ₹10 L, back 6 months after the year | 7.05% | 4.49% | 4.07% | 6.73% |
| 70/30 | + tax at sale (13%; ₹1.25 L exemption on Indian equity) = base | 6.36% | 3.87% | 3.46% | 6.49% |
| 70/30 | US-listed route instead (VOO-type) | 6.31% | 3.83% | 3.42% | 6.46% |
| 70/30 | Indian fund of funds instead | 6.25% | 3.69% | 3.29% | 6.45% |
| 70/30 | Surcharge on | 6.25% | 3.77% | 3.36% | 6.49% |
| 70/30 | Rebalanced every year (taxed) | 6.56% | 4.00% | 3.63% | 6.49% |
| 70/30 | Hedged to rupees (analytical) | 6.75% | 4.36% | 3.93% | 6.72% |
| 50/50 | No frictions | 7.21% | 4.13% | 3.73% | 6.49% |
| 50/50 | + fund costs (Nifty fund 0.20%, UCITS 0.07%) | 7.07% | 3.97% | 3.58% | 6.41% |
| 50/50 | + 15% withholding inside the fund | 6.91% | 3.86% | 3.47% | 6.37% |
| 50/50 | + FX spread 0.75% each way and 0.05% commission | 6.87% | 3.83% | 3.44% | 6.33% |
| 50/50 | + TCS 20% above ₹10 L, back 6 months after the year | 6.80% | 3.96% | 3.55% | 6.36% |
| 50/50 | + tax at sale (13%; ₹1.25 L exemption on Indian equity) = base | 6.12% | 3.34% | 2.95% | 6.14% |
| 50/50 | US-listed route instead (VOO-type) | 6.02% | 3.27% | 2.88% | 6.10% |
| 50/50 | Indian fund of funds instead | 5.94% | 3.03% | 2.65% | 6.08% |
| 50/50 | Surcharge on | 6.01% | 3.25% | 2.85% | 6.14% |
| 50/50 | Rebalanced every year (taxed) | 6.34% | 3.45% | 3.13% | 5.86% |
| 50/50 | Hedged to rupees (analytical) | 6.76% | 4.22% | 3.80% | 6.52% |
| 0/100 | No frictions | 6.00% | 2.29% | 2.05% | 3.98% |
| 0/100 | + fund costs (Nifty fund 0.20%, UCITS 0.07%) | 5.92% | 2.22% | 1.98% | 3.95% |
| 0/100 | + 15% withholding inside the fund | 5.61% | 1.92% | 1.68% | 3.86% |
| 0/100 | + FX spread 0.75% each way and 0.05% commission | 5.53% | 1.84% | 1.60% | 3.79% |
| 0/100 | + TCS 20% above ₹10 L, back 6 months after the year | 5.43% | 1.84% | 1.60% | 3.93% |
| 0/100 | + tax at sale (13%; ₹1.25 L exemption on Indian equity) = base | 4.77% | 1.28% | 1.05% | 3.85% |
| 0/100 | US-listed route instead (VOO-type) | 4.55% | 1.08% | 0.85% | 3.78% |
| 0/100 | Indian fund of funds instead | 4.30% | 0.76% | 0.53% | 3.58% |
| 0/100 | Surcharge on | 4.67% | 1.19% | 0.96% | 3.85% |
| 0/100 | Hedged to rupees (analytical) | 6.72% | 3.56% | 3.25% | 4.74% |
A3. Every variant, 10 and 20 years
Median / 5th-percentile real CAGR. Source: harness extension.
| Path | Years | 100/0 | 80/20 | 70/30 | 60/40 | 50/50 | 0/100 |
|---|---|---|---|---|---|---|---|
| Base: UCITS (Ireland) route, buy and hold, unhedged | 10 | 6.40% / 0.22% | 6.49% / 0.90% | 6.61% / 0.96% | 6.03% / 1.12% | 5.83% / 1.34% | 4.87% / −6.17% |
| Base: UCITS (Ireland) route, buy and hold, unhedged | 20 | 6.73% / 4.06% | 6.46% / 4.09% | 6.36% / 3.87% | 6.22% / 3.62% | 6.12% / 3.34% | 4.77% / 1.28% |
| A: US share hedged to rupees at the India–US short-rate gap (analytical) | 10 | 6.40% / 0.22% | 6.85% / 1.29% | 7.03% / 1.55% | 7.01% / 1.78% | 6.66% / 2.14% | 6.59% / −3.93% |
| A: US share hedged to rupees at the India–US short-rate gap (analytical) | 20 | 6.73% / 4.06% | 6.69% / 4.37% | 6.75% / 4.36% | 6.76% / 4.29% | 6.76% / 4.22% | 6.72% / 3.56% |
| B: rebalanced every year, tax paid on each sale | 10 | 6.40% / 0.22% | 6.51% / 1.07% | 6.01% / 1.35% | 5.42% / 1.51% | 5.41% / 1.13% | 4.87% / −6.17% |
| B: rebalanced every year, tax paid on each sale | 20 | 6.73% / 4.06% | 6.68% / 4.19% | 6.56% / 4.00% | 6.46% / 3.74% | 6.34% / 3.45% | 4.77% / 1.28% |
| C: US-listed fund (VOO-type), dividends paid out and taxed | 10 | 6.40% / 0.22% | 6.44% / 0.86% | 6.54% / 0.90% | 6.01% / 1.03% | 5.75% / 1.29% | 4.67% / −6.41% |
| C: US-listed fund (VOO-type), dividends paid out and taxed | 20 | 6.73% / 4.06% | 6.42% / 4.05% | 6.31% / 3.83% | 6.15% / 3.56% | 6.02% / 3.27% | 4.55% / 1.08% |
| D: Indian fund of funds (no LRS, TER 0.50%) | 10 | 6.40% / 0.22% | 6.44% / 0.82% | 6.46% / 0.88% | 5.89% / 0.89% | 5.77% / 1.07% | 4.24% / −6.54% |
| D: Indian fund of funds (no LRS, TER 0.50%) | 20 | 6.73% / 4.06% | 6.39% / 3.96% | 6.25% / 3.69% | 6.04% / 3.37% | 5.94% / 3.03% | 4.30% / 0.76% |
| E: surcharge on (salary ₹30 L + the gains) | 10 | 6.24% / 0.14% | 6.33% / 0.77% | 6.43% / 0.82% | 5.86% / 0.98% | 5.66% / 1.24% | 4.70% / −6.17% |
| E: surcharge on (salary ₹30 L + the gains) | 20 | 6.62% / 3.95% | 6.35% / 3.99% | 6.25% / 3.77% | 6.11% / 3.52% | 6.01% / 3.25% | 4.67% / 1.19% |
| F: no frictions (no costs, no withholding, no TCS, no tax) | 10 | 7.69% / 1.18% | 7.90% / 2.03% | 8.06% / 2.17% | 7.54% / 2.31% | 7.32% / 2.51% | 6.36% / −5.64% |
| F: no frictions (no costs, no withholding, no TCS, no tax) | 20 | 7.64% / 4.90% | 7.42% / 4.93% | 7.37% / 4.67% | 7.21% / 4.41% | 7.21% / 4.13% | 6.00% / 2.29% |
| TCS set off at once against tax due (no lock-up) | 10 | 6.40% / 0.22% | 6.54% / 0.92% | 6.66% / 1.02% | 6.07% / 1.09% | 5.89% / 1.31% | 4.71% / −6.11% |
| TCS set off at once against tax due (no lock-up) | 20 | 6.73% / 4.06% | 6.48% / 4.06% | 6.39% / 3.79% | 6.22% / 3.51% | 6.19% / 3.22% | 4.86% / 1.28% |
| TCS back 18 months after the year ends | 10 | 6.40% / 0.22% | 6.49% / 0.91% | 6.55% / 1.01% | 5.97% / 1.09% | 5.72% / 1.45% | 4.81% / −5.81% |
| TCS back 18 months after the year ends | 20 | 6.73% / 4.06% | 6.44% / 4.08% | 6.31% / 3.89% | 6.14% / 3.66% | 6.10% / 3.40% | 4.70% / 1.49% |
| Nifty 500 TRI for the Indian leg | 10 | 7.14% / 0.21% | 7.35% / 1.13% | 7.13% / 1.12% | 7.06% / 1.26% | 6.54% / 1.43% | 4.87% / −6.17% |
| Nifty 500 TRI for the Indian leg | 20 | 7.45% / 4.39% | 6.96% / 4.60% | 6.71% / 4.43% | 6.54% / 4.11% | 6.42% / 3.77% | 4.77% / 1.28% |
Hedged against unhedged, 10-year windows (the hedged path is analytical). Source: harness extension.
| Blend | US share | Median real CAGR | 5th pct | Mean of worst 5% | Ulcer Index (median) | Longest spell, any window (years) |
|---|---|---|---|---|---|---|
| 80/20 | hedged | 6.85% | 1.29% | 0.60% | 21.3 | 10.0 |
| 80/20 | unhedged | 6.49% | 0.90% | 0.22% | 20.4 | 10.0 |
| 80/20 | rupee held flat | 5.98% | −0.03% | −0.69% | 22.6 | 10.0 |
| 70/30 | hedged | 7.03% | 1.55% | 1.07% | 20.2 | 9.6 |
| 70/30 | unhedged | 6.61% | 0.96% | 0.50% | 18.9 | 9.8 |
| 70/30 | rupee held flat | 5.54% | −0.13% | −0.80% | 22.5 | 10.0 |
| 50/50 | hedged | 6.66% | 2.14% | 1.78% | 18.4 | 9.1 |
| 50/50 | unhedged | 5.83% | 1.34% | 0.96% | 16.6 | 9.2 |
| 50/50 | rupee held flat | 4.62% | −0.74% | −1.09% | 22.6 | 10.0 |
| 0/100 | hedged | 6.59% | −3.93% | −4.30% | 16.9 | 10.0 |
| 0/100 | unhedged | 4.87% | −6.17% | −6.62% | 16.1 | 10.0 |
| 0/100 | rupee held flat | 0.42% | −6.61% | −7.03% | 23.9 | 10.0 |
US estate tax (US-listed route) and TCS paid at the start (UCITS route). Real, in today's money. Source: harness extension.
| Blend | Expected US estate tax over 20 years from age 40, median window | Largest (any window) | TCS paid at the start, median window |
|---|---|---|---|
| 80/20 | ₹0.20 L | ₹0.33 L | ₹1,92,308 |
| 70/30 | ₹0.56 L | ₹0.82 L | ₹3,77,358 |
| 60/40 | ₹0.99 L | ₹1.39 L | ₹5,55,556 |
| 50/50 | ₹1.46 L | ₹1.98 L | ₹7,27,273 |
| 0/100 | ₹4.05 L | ₹5.24 L | ₹15,75,929 |
A4. Block bootstrap of June 1999 to September 2026 (simulation, not history)
2,000 paths built from random 24-month blocks of the real history. Source: harness extension.
| Years | Blend | Median real CAGR | 5th pct | Mean of worst 5% | Median SWR | 5th-pct SWR | Ulcer Index (median) | Longest spell, 95th pct (years) |
|---|---|---|---|---|---|---|---|---|
| 20 | 100/0 | 6.37% | −1.10% | −2.57% | 8.47% | 4.02% | 20.8 | 16.8 |
| 20 | 80/20 | 6.35% | −0.39% | −2.00% | 8.48% | 4.30% | 18.1 | 15.8 |
| 20 | 70/30 | 6.20% | −0.28% | −1.91% | 8.53% | 4.33% | 17.1 | 15.6 |
| 20 | 60/40 | 6.14% | −0.30% | −1.91% | 8.48% | 4.35% | 16.3 | 15.2 |
| 20 | 50/50 | 6.01% | −0.40% | −1.99% | 8.38% | 4.33% | 15.5 | 15.3 |
| 20 | 0/100 | 4.27% | −2.39% | −4.24% | 7.18% | 3.39% | 16.2 | 18.1 |
| 30 | 100/0 | 6.84% | 0.28% | −1.00% | 7.38% | 3.06% | 22.4 | 21.6 |
| 30 | 80/20 | 6.72% | 0.55% | −0.60% | 7.35% | 3.24% | 20.0 | 20.8 |
| 30 | 70/30 | 6.58% | 0.65% | −0.52% | 7.26% | 3.27% | 18.9 | 20.3 |
| 30 | 60/40 | 6.41% | 0.76% | −0.51% | 7.25% | 3.32% | 17.9 | 19.8 |
| 30 | 50/50 | 6.24% | 0.67% | −0.55% | 7.18% | 3.32% | 17.2 | 19.8 |
| 30 | 0/100 | 4.32% | −1.09% | −2.49% | 5.64% | 2.37% | 18.6 | 25.5 |
A5. Notes on law and data
| Item | What this paper uses |
|---|---|
| Hedge | For an Indian holder, a hedge adds the India–US rate gap; its cost is the rupee's fall given up. Since June 1999 the carry (4.18%) beat the fall (2.96%). |
| TCS | 20% above ₹10 L a year for investment in FY 2026-27. Budget 2026 changed only the rates for education, medical treatment and tour packages. |
| LTCG exemption | The ₹1.25 L a year exemption applies to Indian listed equity only, not to foreign holdings. |
| History | Index data only, June 1999 to September 2026. No 30-year window; 30 years by simulation only. |
| Nifty 500 TRI | Published by NSE from January 1995; used here from June 1999. |
| Indian CPI | CPI for industrial workers to November 2011, CPI Combined from December 2011 (IMF); August–September 2026 from MoSPI. |
| Base route and FX costs | Irish UCITS fund; FX spread 0.75% each way and 0.05% commission. |
| Indian fund-of-funds limits | US$1 bn per fund house and US$7 bn for the industry; some fund houses paused new money in 2026. |
| MSCI ACWI ex-India | Not run: no free monthly source. |
Every number in this paper rests on assumptions, not forecasts. Tax rules are FY2026-27 under the new regime and may change. None of this constitutes financial, tax, or investment advice. finfire.org operates the calculator and offers paid tiers.
Reproducibility. Every calculator link in this paper, with the value it should show. urls.csv