Turning a Crash into a Permanent Loss: What Four Ways of Reacting to a Bear Market Cost an Indian SIP Investor over 25 Years
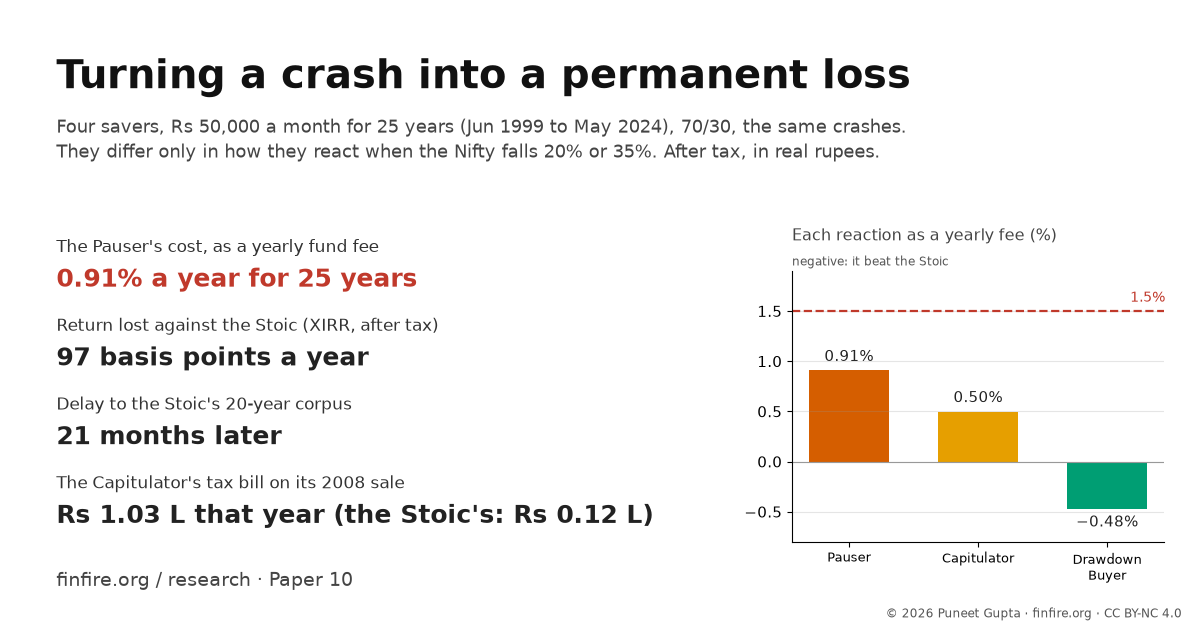
Pausing your SIP never sells a single share. It still cost as much as a 0.9% fee charged every year for 25 years.
finfire Quantitative Research Series · Paper #10 · November 2026
In one minute
Four savers put away exactly the same money every month for 25 years, from June 1999 to May 2024. They lived through the same six falls in the Nifty 50, including 2000–03 and 2008–09. The only difference between them was how they reacted. One kept going. One stopped buying shares whenever the market was 20% below its high. One sold half of what he held after a 35% fall. One bought more when prices fell. We ran all four month by month on real Indian index data, with real tax on every sale.
- Pausing cost real money. The saver who stopped his equity SIP in every fall ended with ₹2.44 Cr in today's money against ₹2.77 Cr for the saver who kept going. That is ₹32.8 L less, or 11.9%. He gave up 97 basis points of return a year and reached the 20-year mark 21 months late. He never sold a single share.
- But it was not worse than a 1.5% fee. Put his loss as a yearly fund fee, and it works out to 0.91% a year. That is 0.60 times a 1.5% fee, not more than it. The idea this paper set out to test does not hold on this history.
- The 2000–03 pause was the expensive one, not the cheap one. We expected high fixed-deposit rates and a flat market to make it nearly free. It cost ₹15.2 L against ₹10.6 L for the 2008 pause. The deposits earned only ₹0.47 L on ₹4.08 L parked, the money went back in at a new high, and early rupees compound the longest.
- Almost all the damage was the price paid on the way back in. Of the ₹32.8 L gap, ₹34.6 L came from putting the parked money back at a new all-time high and ₹15.9 L from not rebalancing what was already held. Deposit interest (₹10.5 L) and a smaller tax bill (₹8.3 L) took some of it back.
- The pauser paid less tax than the saver who kept going: ₹31.8 L against ₹38.5 L in today's money, because he stopped rebalancing and so sold less. With tax switched off, his cost is 0.90% instead of 0.91%. What hurt him was the market, not the taxman.
- One capitulation was free, the other was ruinous. Selling half the equity in September 2001 and coming back in March 2003 beat the steady saver by ₹1.5 L. Selling in September 2008 and coming back in March 2010 cost ₹19.9 L. Same rule. Different calendar.
- Buying more in falls won every time in the history. It beat the steady saver in all 89 rolling 20-year windows, all 149 fifteen-year windows and all 29 twenty-five-year windows. In 2,000 simulated paths built from the same years, it won 73.2% of the time, not always. It also sat through the deepest fall of the four: −51.0%.
- None of the reactions bought a calmer ride. All four lived through a real fall of 43% to 51%. The pauser's and the capitulator's wealth spent more time under its own peak, not less.
The short version. Pausing a SIP in a crash is not harmless and not free. On 25 years of Indian history it cost the same as paying a 0.91% fund fee every year, which is real but less than the 1.5% fee this paper set out to beat. Nearly all of the loss came from one moment: buying back at a new high with money that had been sitting in a deposit. The only reaction that paid was buying more.
The question
William Bernstein draws a line between two kinds of risk. Shallow risk is a fall in prices that recovers. A 50% crash is shallow: painful, temporary, and the market comes back. Deep risk is a permanent loss of real wealth, money that never comes back.
His argument is that most investors are not hurt by shallow risk. They are hurt because they turn it into deep risk themselves. There are two ways to do it. In retirement, you are forced to sell shares at the bottom to pay the bills. While you are still saving, you panic: you stop your SIP, or you flee to cash.
This paper tests the second one.
Indian forums have a standard defence of pausing. It goes: "I am not selling anything. I am just waiting for clarity before I invest more." It sounds safe. Nothing is sold, so nothing is lost, and the money earns interest in a fixed deposit in the meantime.
So we asked a simple question. If pausing a SIP costs anything at all, how much? And is it bigger or smaller than something every investor already understands: a fund that charges a high fee, year after year, for 25 years?
We set the bar at a 1.5% annual expense ratio, the kind of charge a regular-plan equity fund used to carry. We expected pausing to be worse. It was not.
Words used
| Term | Meaning |
|---|---|
| SIP | A fixed amount invested every month. |
| Shallow risk | A fall in prices that recovers. |
| Deep risk | A permanent loss of real wealth. |
| Real | After Indian inflation, in rupees of September 2026. |
| TRI | Total return index: the index with its dividends put back in. |
| All-time high | The highest month-end value the Nifty 50 TRI has reached so far. |
| Drawdown | How far below that high the index sits, at a month end, in rupees (not after inflation). |
| XIRR | The yearly return on money that goes in month by month. |
| Behavioural tax | The steady saver's XIRR minus another saver's, in basis points. 100 basis points is 1 percentage point. |
| Equivalent fee | The yearly fund fee that would cut the steady saver down to the same real after-tax ending wealth. |
| FI target | The steady saver's real after-tax wealth after 20 years (month 240): ₹1.83 Cr. |
| Band | The steady saver trades back to 70/30 only when equity is more than 5 percentage points off target. |
| FIFO | First in, first out: the oldest units are sold first, which is how Indian tax works. |
| Window | The same journey started in a different month. |
| Bootstrap | New 25-year paths built by drawing 24-month blocks of the same history at random. A simulation, not more history. |
| Ulcer Index | How deep and how long wealth sat below its own peak, month by month. Higher is worse. |
The set-up and paths
Everything is identical except the behaviour.
- The journey. 300 month ends, June 1999 to May 2024. This is the earliest full 25 years in the index data. It holds six falls: 2000–03, 2004, 2007–10, 2011, 2016 and 2020.
- The money going in. ₹50,000 a month in September 2026 rupees, which was ₹10,271 a month in June 1999, raised every April by the previous year's inflation. Over 25 years that is ₹69.3 L of actual rupees, worth ₹1.44 Cr in today's money. It is identical on every path, to the rupee.
- What it buys. 70% a Nifty 50 index fund with a 0.20% expense ratio, 30% a 10-year gilt index fund with the same. Parked cash goes into one-year fixed deposits, rolled over, at the short-term rate plus 1 percentage point.
- What the markets did. Over these 25 years the Nifty 50 TRI returned 14.06% a year, the debt leg 7.35%, inflation ran at 6.05% and the deposit rate averaged 7.41%.
- Tax. Today's rules, applied to every past year. Equity gains 13% above ₹1.25 L a year, 20.8% if the units are under a year old. Debt-fund gains and deposit interest at 31.2%. Paid each April out of the portfolio. Oldest units sold first. Everything sold at the end, with tax paid on that sale too.
- The signal every rule watches. How far the Nifty 50 TRI sits below its own all-time high, at month ends. Each rule re-arms only after a new high is made, so each fall sets it off once.
| Path | What it does | Engine |
|---|---|---|
| P1 Stoic Rebalancer | Contributions never stop. Each month's money goes to the underweight sleeve first. Trades back to 70/30 when equity is more than 5 points off, and on every 31 March. Tax paid on every sale. | harness extension |
| P2 Wait-for-Clarity Pauser | At the first month end 20% or more below the all-time high: every contribution goes into a rolling one-year deposit, nothing is rebalanced, nothing is sold. At the first new all-time high, the deposit pile goes in towards 70/30 and normal behaviour resumes. | harness extension |
| P3 Capitulator | At the first month end 35% or more below the high: sells half the equity, oldest units first. The proceeds and the next 18 months of contributions sit in deposits. Eighteen months after the sale, everything goes back to 70/30, with tax on what is sold. | harness extension |
| P4 Drawdown Buyer | Equity target is 70% normally, 80% once the fall reaches 20%, 90% once it reaches 35%, back to 70% at the first new high. Same band and same contribution-first rule as P1. | harness extension |
| P5 Stoic plus a fee | P1 with an extra yearly charge on the whole portfolio, taken monthly: 0.5%, 1.0%, 1.5%, 2.0%. This is the yardstick, not a saver. | harness extension |
| Steady returns | The same plan on one steady return, with a pause, and with the parked money put back. | calculator |
| Simulated markets | 2,000 markets around the steady return. | calculator |
Assumptions and method
- Index data, June 1999 to May 2024: Nifty 50 TRI (NSE), Paper 4's G-sec series made monthly (the NSE 10-year G-Sec index from February 2011, an estimate from RBI yields before that), Indian CPI (CPI for industrial workers to November 2011, CPI Combined after), and the India short rate.
- ₹50,000 a month in September 2026 money, which is ₹10,271 in June 1999, raised every April by inflation. 70/30. Expense ratios 0.20% on both legs. Deposits at the short rate plus 1 point, one year, rolled.
- Today's tax rules on every past year: equity 13% above the ₹1.25 L yearly exemption, 20.8% under 12 months, debt and deposit interest 31.2%. Tax paid each April from the portfolio. Oldest units sold first.
- Real means rupees of September 2026. The signal is the Nifty 50 TRI below its all-time high at month ends, in rupees.
- The history runs are a harness extension of the calculator. Under the calculator's own rules they match accumulate.finfire.org to the paisa on 20 plans. An independent check in plain Python re-computed 35 numbers with no differences.
- One 25-year path, which is about 1.1 independent 25-year stretches. Also 89 rolling 20-year windows and a 2,000-path block bootstrap, which is a simulation of the same years, not more history.
The race over 25 years
Table 1 is the whole paper in one place.
The Stoic Rebalancer ended with ₹2.77 Cr in today's money, after tax on selling everything. The Pauser ended with ₹2.44 Cr, the Capitulator with ₹2.58 Cr, and the Drawdown Buyer with ₹2.96 Cr.
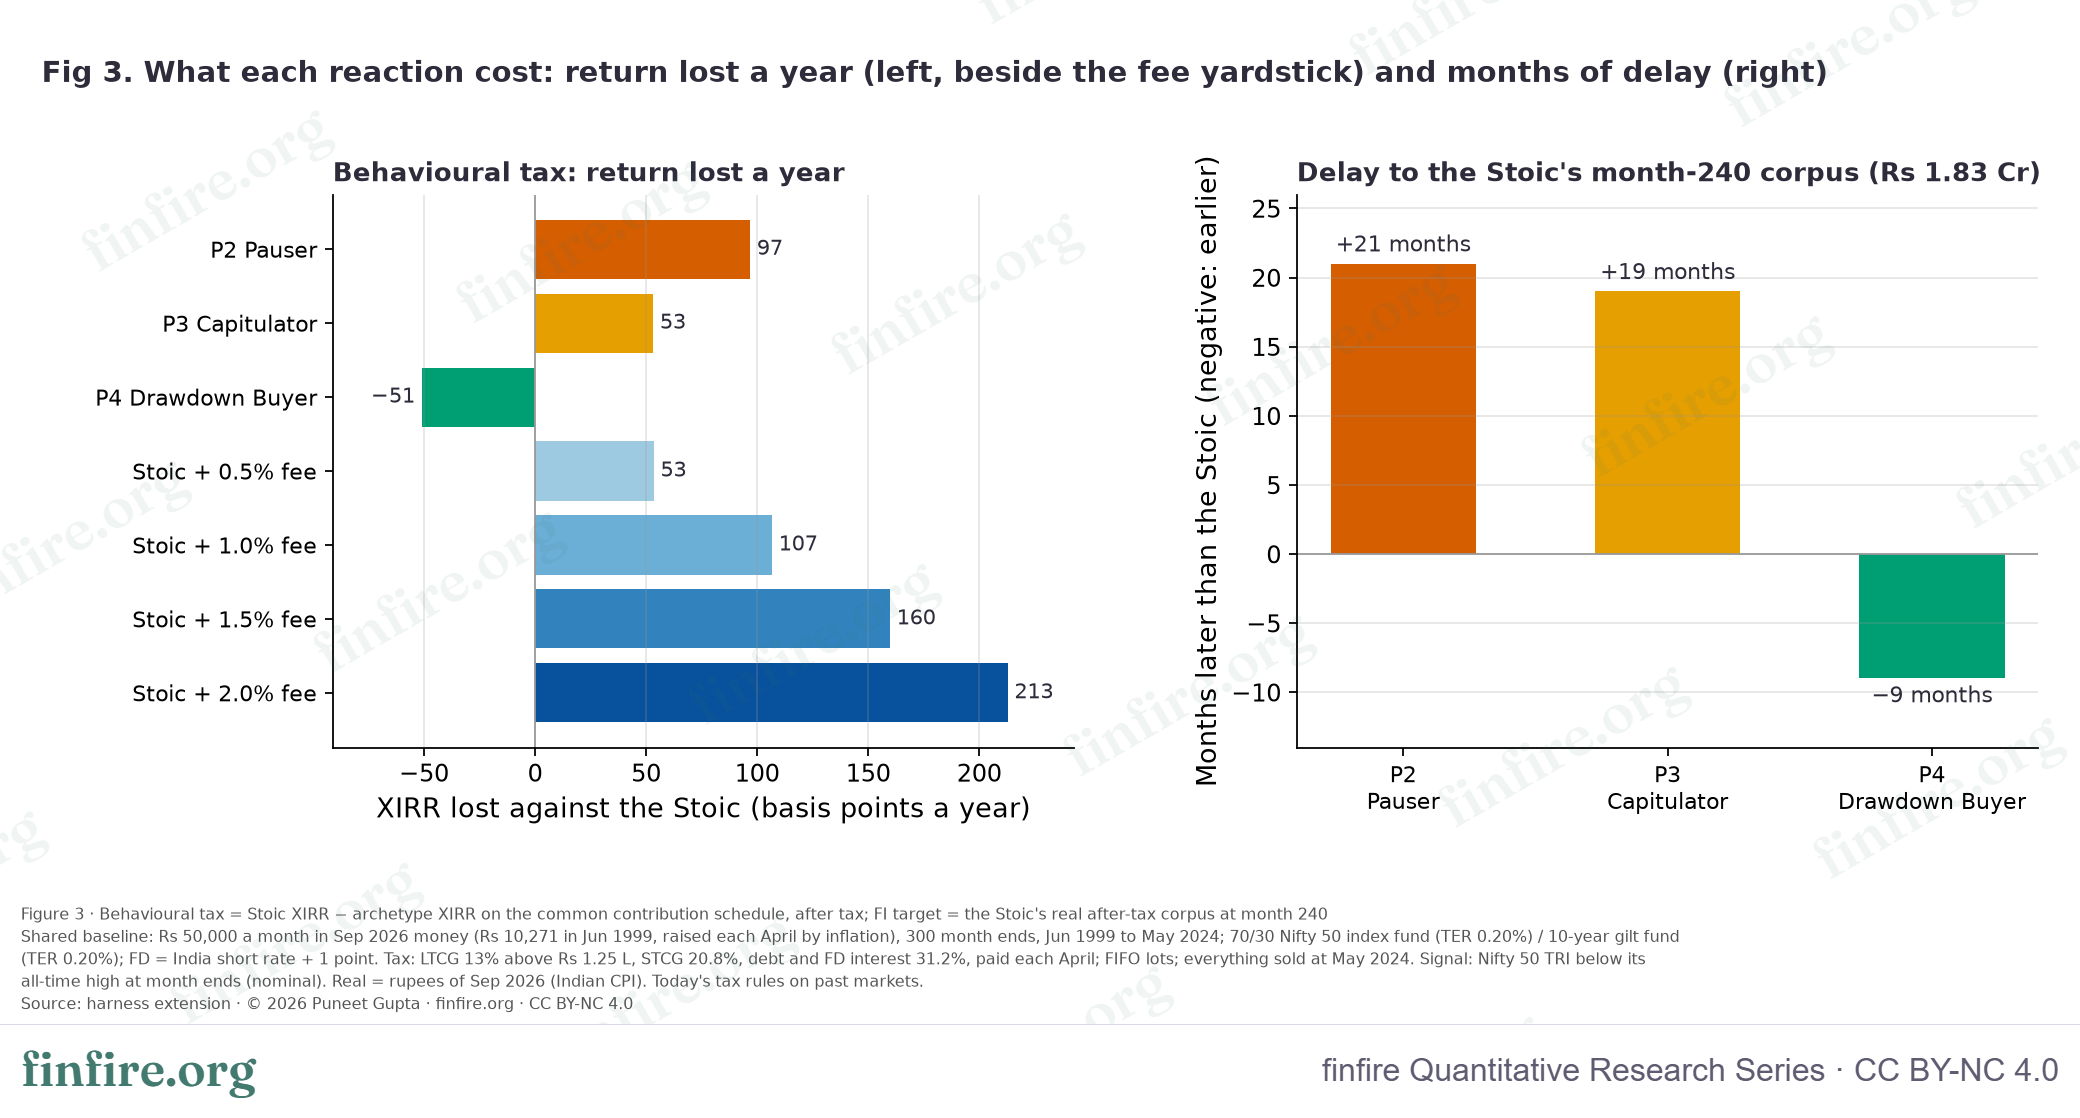
In yearly return on the money put in, the Pauser gave up 97 basis points and the Capitulator 53. The Drawdown Buyer gained 51.
The delay is the figure that lands hardest. The Stoic reached ₹1.83 Cr in today's money in May 2019, his 20-year mark. The Pauser got there in February 2021: 21 months later. The Capitulator in December 2020, 19 months later. The Drawdown Buyer arrived in August 2018, nine months early.
Table 1. The headline. Real figures are in September 2026 rupees, after tax on selling everything in May 2024. Source: harness extension.
| Path | Real after tax | Before the final sale | XIRR | Real XIRR | Behavioural tax | Equivalent fee | FI target reached | Delay |
|---|---|---|---|---|---|---|---|---|
| P1 Stoic Rebalancer | ₹2.77 Cr | ₹3.05 Cr | 11.33% | 4.89% | — | — | May 2019 | the target |
| P2 Wait-for-Clarity Pauser | ₹2.44 Cr | ₹2.72 Cr | 10.37% | 4.00% | 97 bps (real 90) | 0.91% (0.60× 1.5%) | Feb 2021 | 21 months later |
| P3 Capitulator | ₹2.58 Cr | ₹2.83 Cr | 10.80% | 4.40% | 53 bps (real 49) | 0.50% (0.33× 1.5%) | Dec 2020 | 19 months later |
| P4 Drawdown Buyer | ₹2.96 Cr | ₹3.21 Cr | 11.85% | 5.37% | −51 bps (real −47) | −0.48% (−0.32× 1.5%) | Aug 2018 | 9 months earlier |
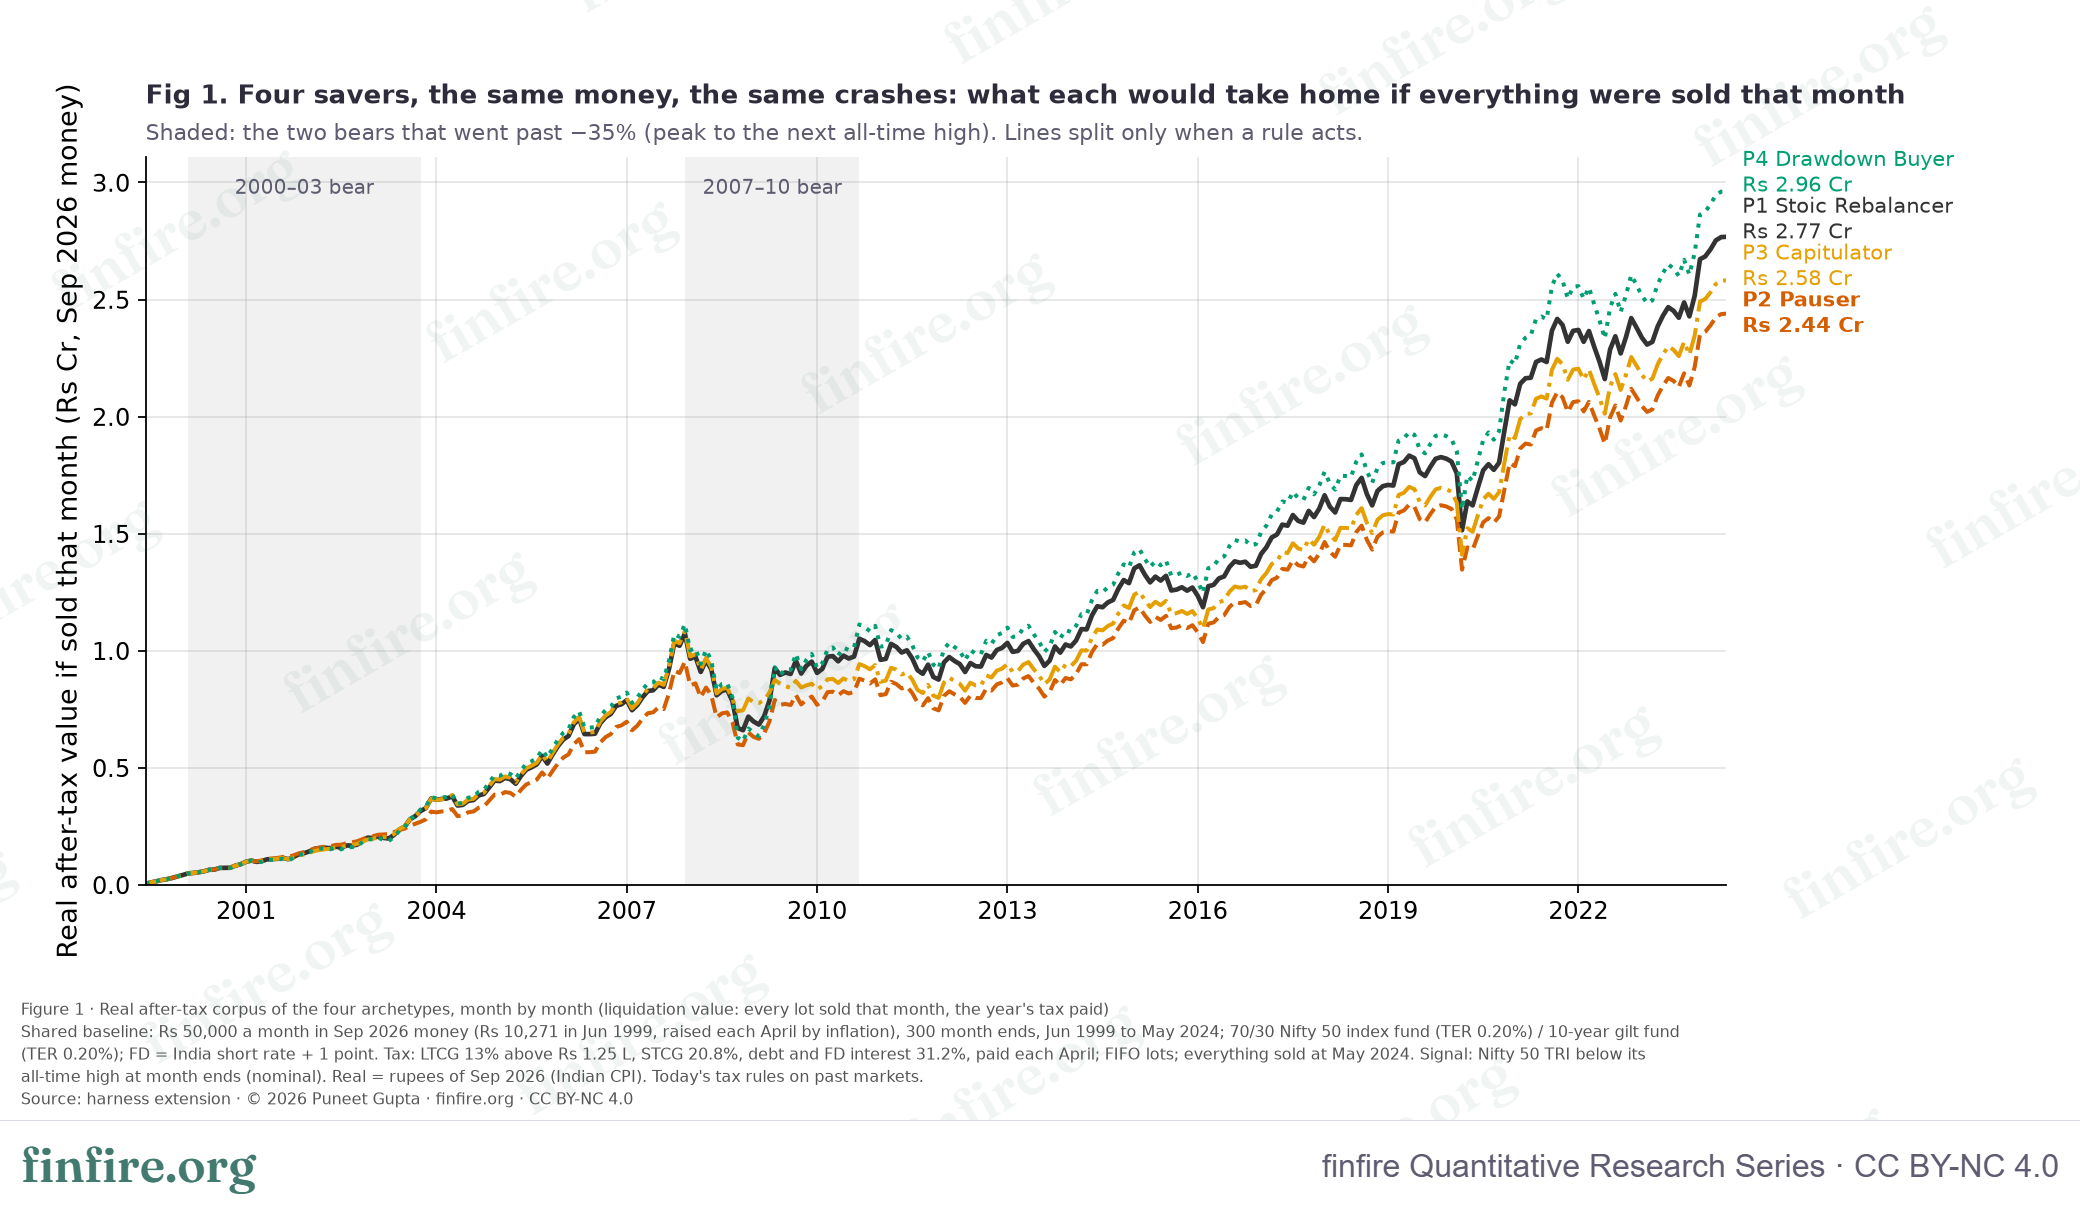
charts/fig1_four_journeys_data.csv.Notice how little daylight there is for the first ten years. The lines only separate properly after 2010, long after the decisions that made the difference were taken. That is the awkward thing about behaviour: you cannot see the cost at the time you pay it.
What each saver actually did
Table 2 lists every fall the rules saw.
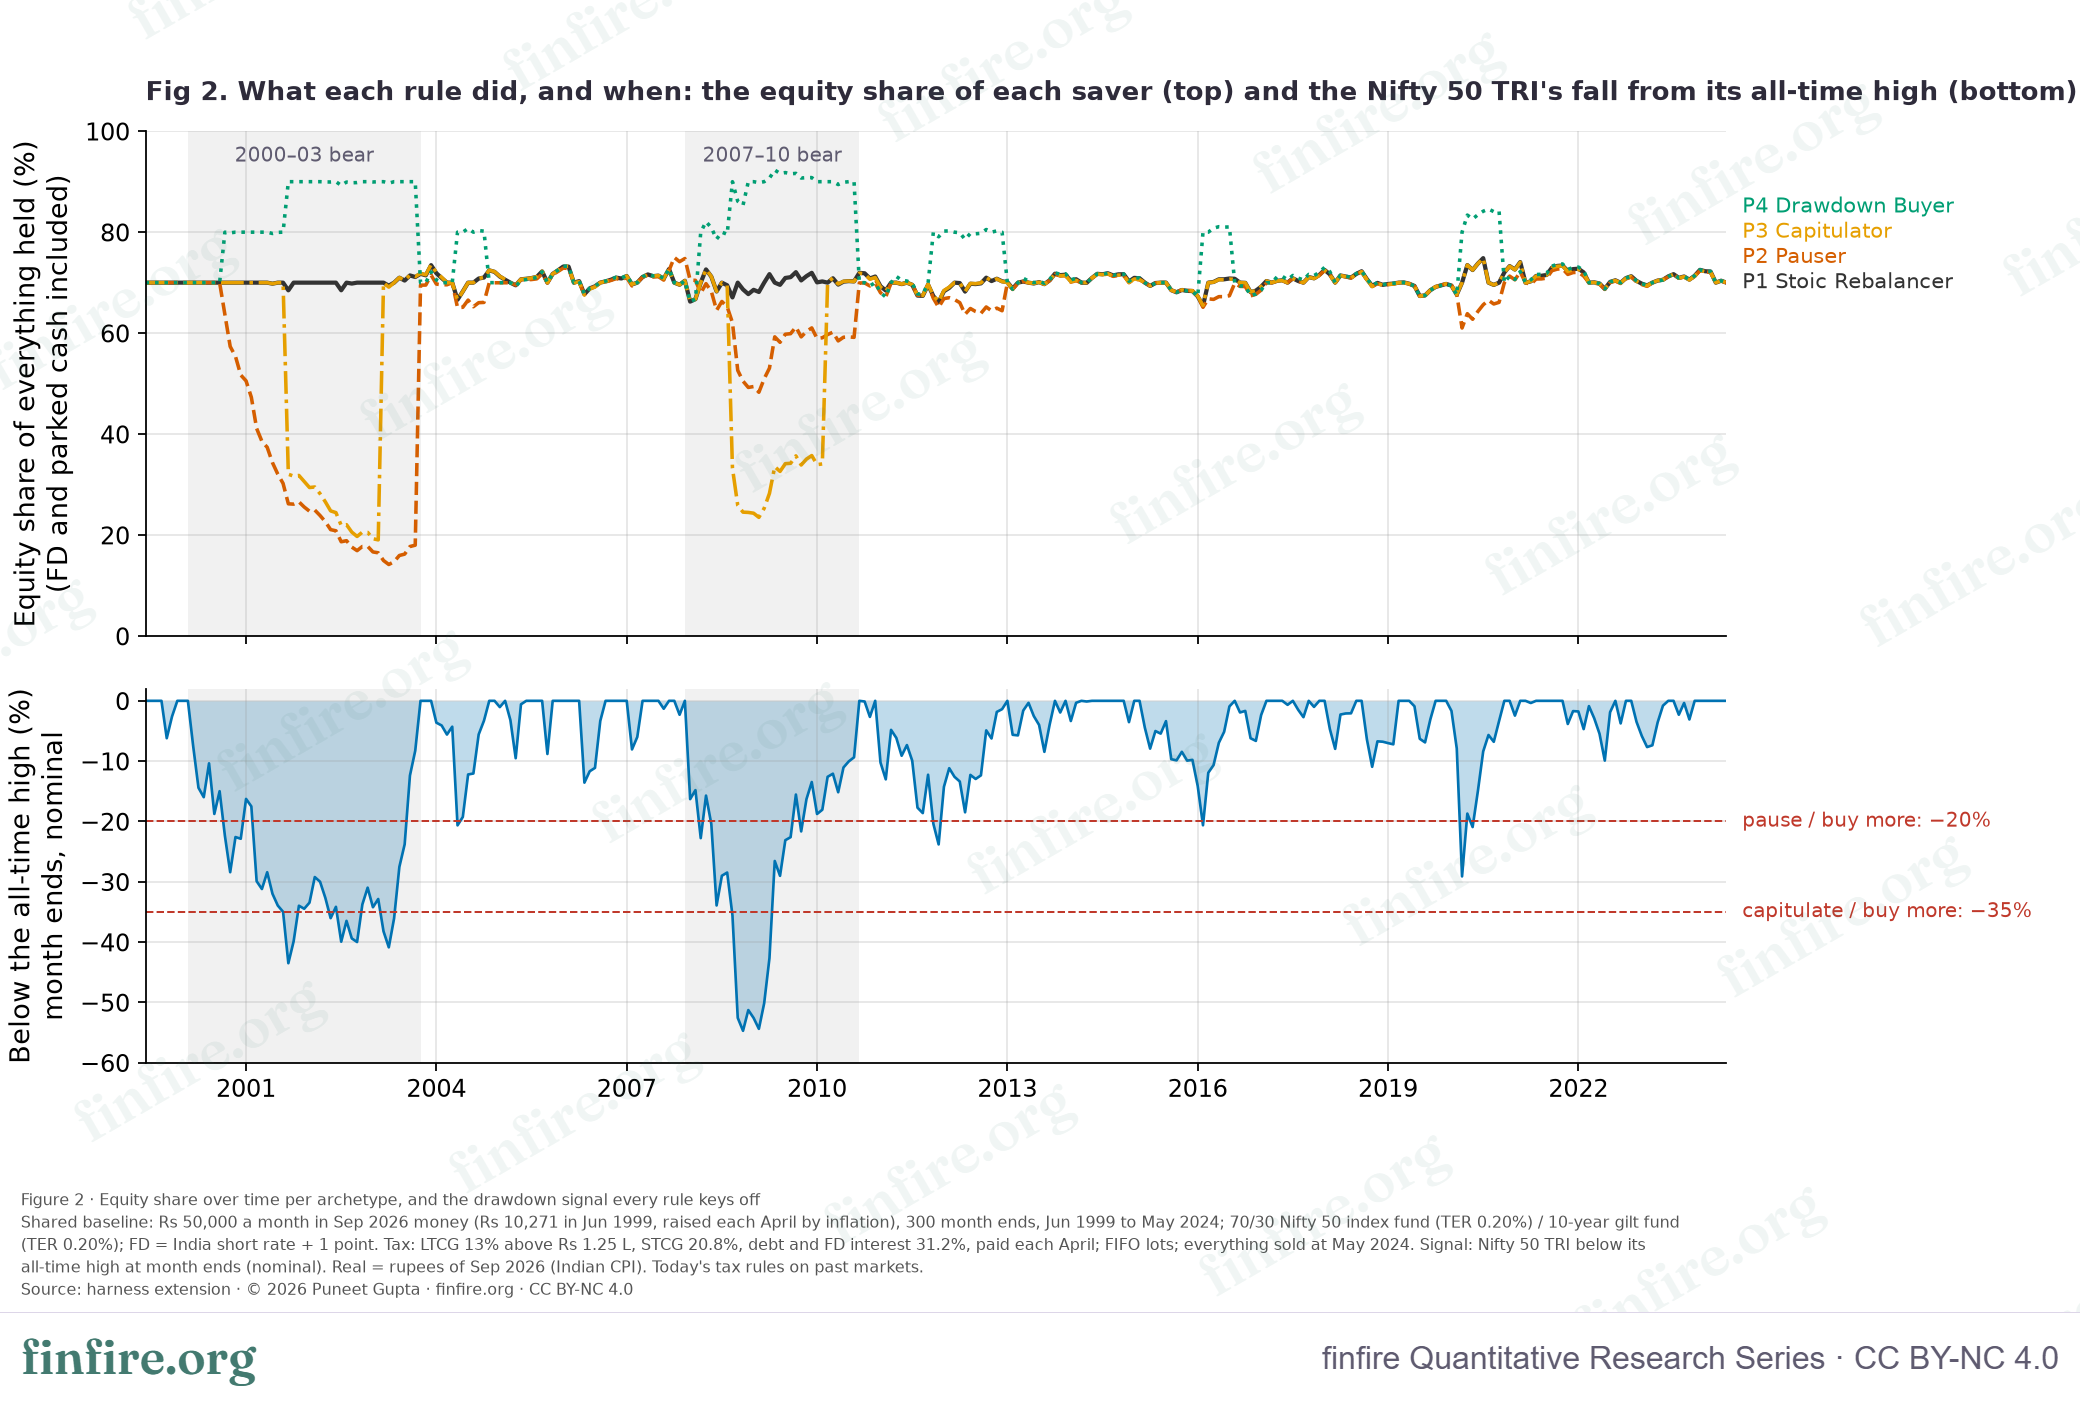
Six times in 25 years the Nifty 50 TRI closed a month 20% or more below its high. Twice it closed 35% or more below. The deepest month end was November 2008, at −54.7%.
Table 2. The six falls the rules keyed off. Month-end values of the Nifty 50 TRI, in rupees. Source: harness extension.
| Fall | Peak | First month end −20% | First month end −35% | Trough (month end) | Deepest fall | New all-time high |
|---|---|---|---|---|---|---|
| 1 | Feb 2000 | Sep 2000 | Sep 2001 | Sep 2001 | −43.5% | Oct 2003 |
| 2 | Dec 2003 | May 2004 | — | May 2004 | −20.6% | Nov 2004 |
| 3 | Dec 2007 | Mar 2008 | Sep 2008 | Nov 2008 | −54.7% | Sep 2010 |
| 4 | Dec 2010 | Nov 2011 | — | Dec 2011 | −23.8% | Jan 2013 |
| 5 | Feb 2015 | Feb 2016 | — | Feb 2016 | −20.6% | Aug 2016 |
| 6 | Dec 2019 | Mar 2020 | — | Mar 2020 | −29.1% | Nov 2020 |
The Pauser was out of the market for 101 months of 300. That is a third of his saving life. The two long spells did the damage: 37 months from September 2000, and 30 months from March 2008.
The Capitulator triggered twice and was out for 36 months in all.
Table 3. When each saver stepped out and when he came back. Source: harness extension.
| Path | Out from | Back in | Months out |
|---|---|---|---|
| P2 Wait-for-Clarity Pauser | Sep 2000 | Oct 2003 | 37 |
| P2 Wait-for-Clarity Pauser | May 2004 | Nov 2004 | 6 |
| P2 Wait-for-Clarity Pauser | Mar 2008 | Sep 2010 | 30 |
| P2 Wait-for-Clarity Pauser | Nov 2011 | Jan 2013 | 14 |
| P2 Wait-for-Clarity Pauser | Feb 2016 | Aug 2016 | 6 |
| P2 Wait-for-Clarity Pauser | Mar 2020 | Nov 2020 | 8 |
| P3 Capitulator | Sep 2001 | Mar 2003 | 18 |
| P3 Capitulator | Sep 2008 | Mar 2010 | 18 |
One point is worth holding on to. The rule says "wait for clarity", and clarity is defined as a new all-time high. In this history, that definition kept a saver out of the market for more than three years on one occasion and for two and a half years on another. The rule sounds like a short pause. It was not.
charts/fig2_equity_share_and_drawdown_data.csv.Put as a fee: the test this paper set out to run
A fee is something every investor can picture. So we asked the engine a different question: what yearly charge, taken from the Stoic every month for 25 years, would leave him with exactly as little as each of the others?
Pausing the SIP works out to 0.91% a year. Capitulating works out to 0.50%. Buying more in falls works out to −0.48%, which is a rebate rather than a fee.
Against that, a real 1.5% fee cost 160 basis points of return and left ₹2.25 Cr, which is less than any of the three behaviours produced.
So the claim this paper set out to prove — that pausing a SIP is worse than a permanent 1.5% expense ratio — is wrong on this history. Pausing is 0.60 times as bad.
Table 4. The yardstick: what a real fee does to the Stoic. Source: harness extension.
| Yardstick | Real after tax | XIRR | Behavioural tax |
|---|---|---|---|
| Stoic + 0.5% a year | ₹2.58 Cr | 10.80% | 53 bps |
| Stoic + 1.0% a year | ₹2.41 Cr | 10.27% | 107 bps |
| Stoic + 1.5% a year | ₹2.25 Cr | 9.74% | 160 bps |
| Stoic + 2.0% a year | ₹2.11 Cr | 9.21% | 213 bps |
charts/fig3_behavioural_tax_data.csv.There are two readings of this, and both are fair.
The first: a fee of 0.91% a year is not nothing. It is roughly the gap between the direct and regular plans of the same active fund. People switch funds over less. And the pauser pays it for doing something that feels prudent at the time.
The second: the behaviour that forums treat as catastrophic turned out to be smaller than a cost many investors accept without blinking. Measured this way, the fee is still the bigger enemy.
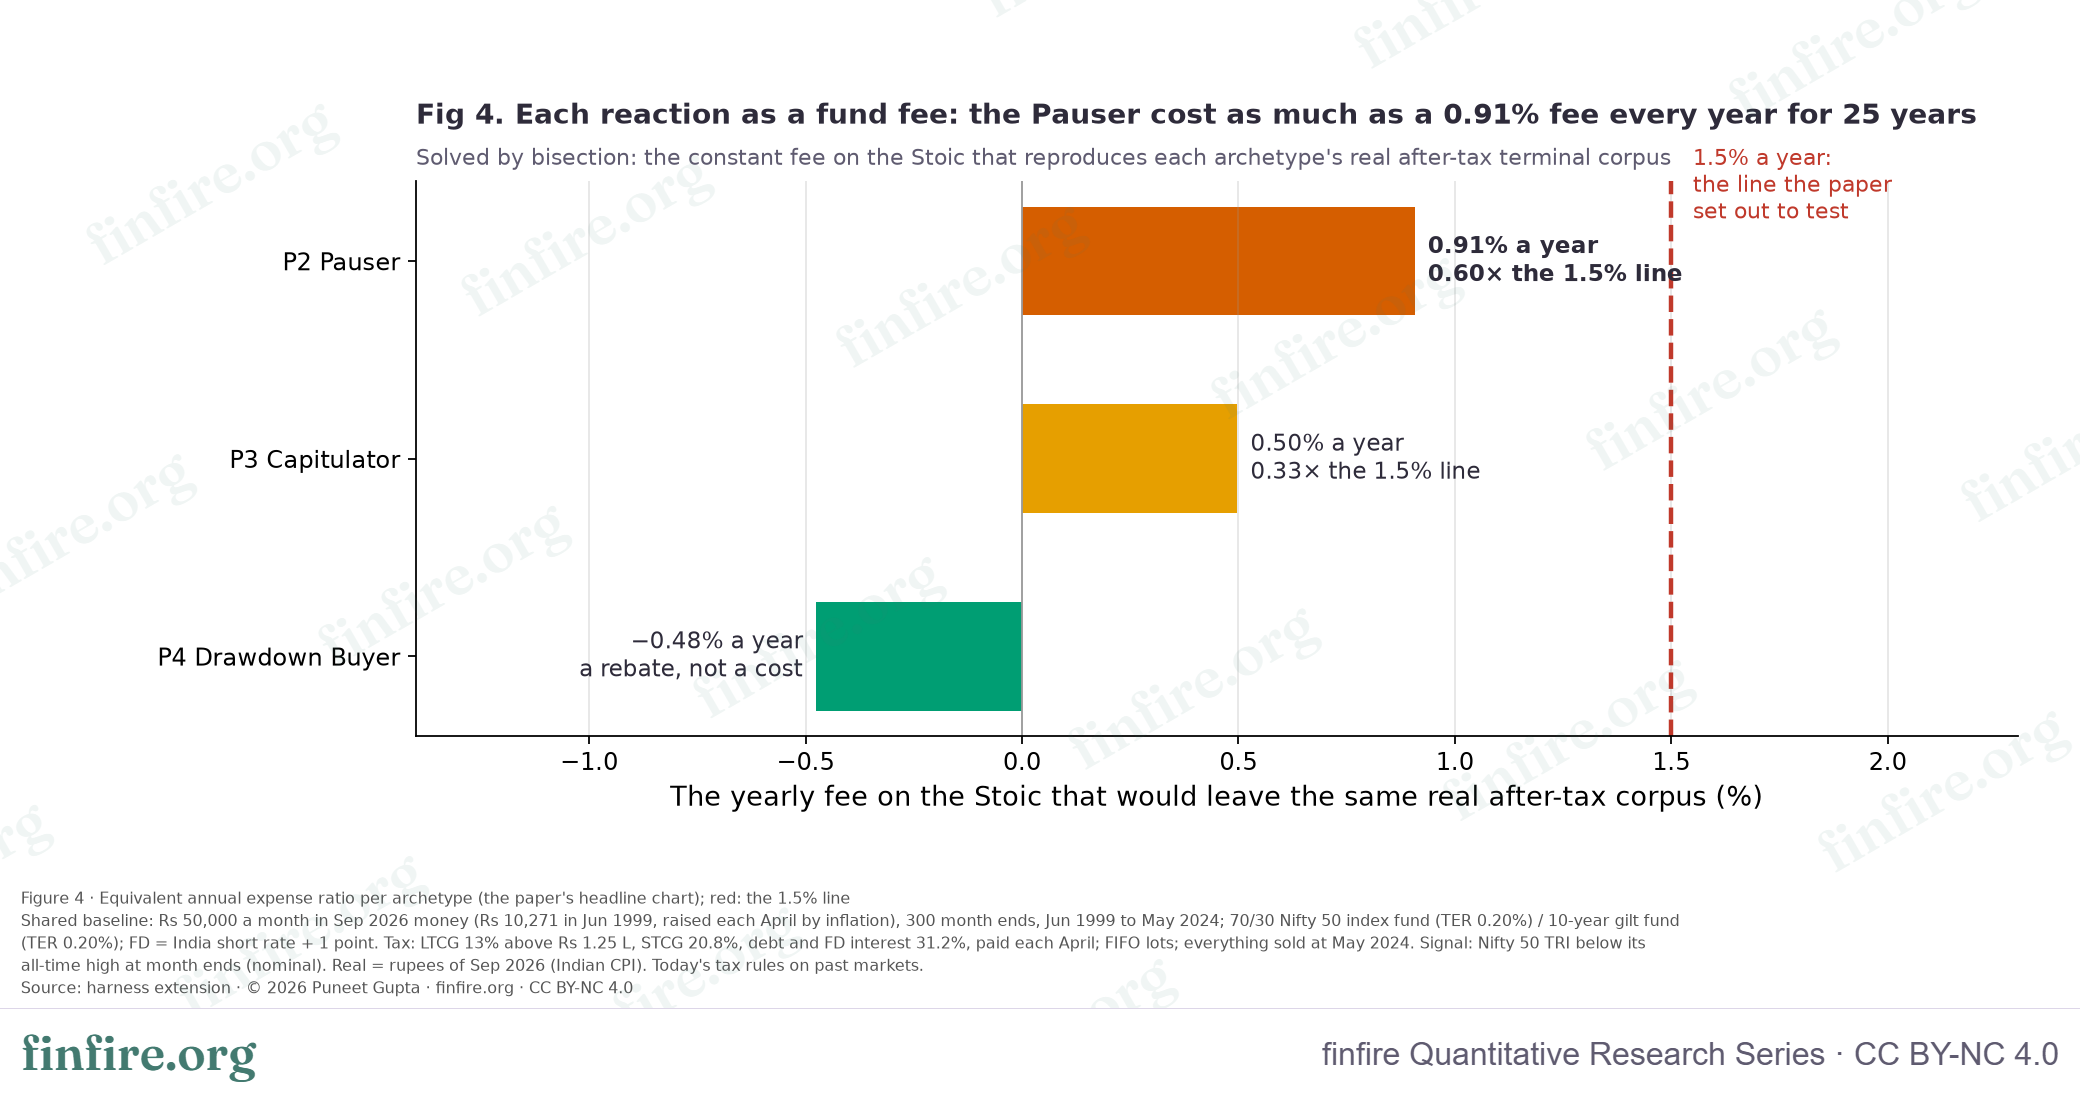
charts/fig4_fee_equivalence_data.csv.Where the pauser's money went
The Pauser sold nothing. So where did ₹32.8 L go?
We split it five ways, by re-running the same path with one piece changed at a time. The parts do not add up exactly, because they interact, so Table 5 states the leftover instead of hiding it.
Table 5. Where the shortfall went. Parts (a), (b) and (d) are valued at May 2024 in a tax-free run; (c) is the gap with tax less the gap without; (e) is measured against a pauser who keeps rebalancing what he already holds. Source: harness extension.
| Part | P2 Pauser | share | P3 Capitulator | share |
|---|---|---|---|---|
| Total shortfall against the Stoic (real, after tax) | ₹32.8 L | 100% | ₹18.6 L | 100% |
| (a) contributions in a deposit while prices fell | ₹6.9 L | 21% | −₹6.7 L | −36% |
| (b) money put back at a higher price than at the trigger | ₹34.6 L | 105% | ₹30.0 L | 161% |
| (c) tax paid that the Stoic did not pay (− = less tax) | −₹8.3 L | −25% | ₹0.6 L | 3% |
| (d) deposit interest earned instead (a credit) | −₹10.5 L | −32% | −₹11.0 L | −59% |
| (e) no rebalancing of what was already held while paused | ₹15.9 L | 48% | n/a | — |
| Residual (interactions) | −₹5.8 L | −18% | ₹5.8 L | 31% |
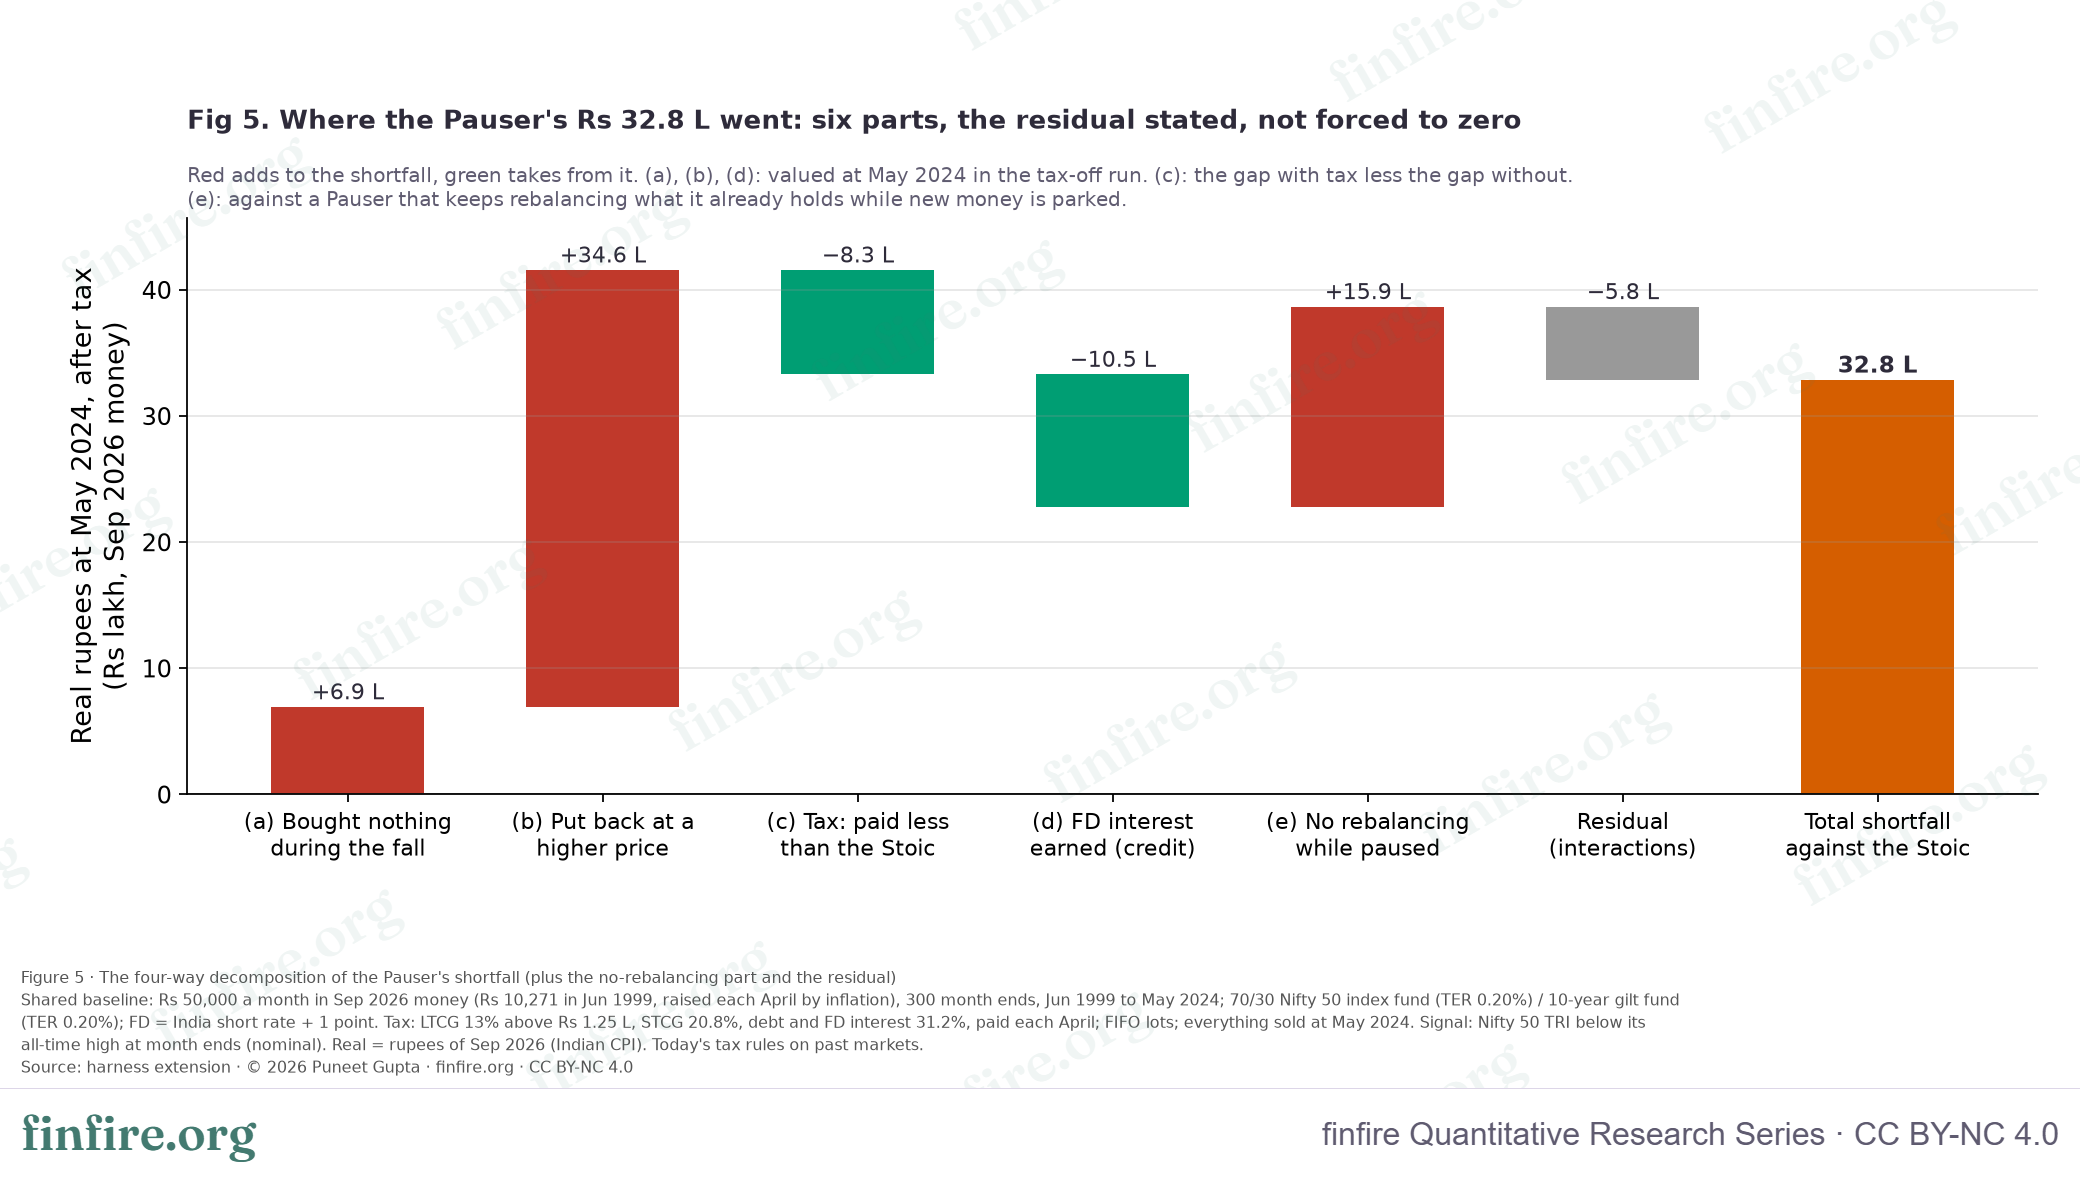
charts/fig5_pauser_waterfall_data.csv.Three things stand out.
The re-entry price is the whole story. Line (b) is ₹34.6 L, more than the entire shortfall. Missing the cheap months — line (a), ₹6.9 L — was a minor matter next to paying the expensive price when the money finally went in. The rule says come back at a new all-time high, and a new all-time high is, by definition, the dearest the market has ever been.
Not rebalancing cost almost as much as missing the buys. Line (e) is ₹15.9 L. While paused, the Pauser did nothing at all: he did not move money from his debt sleeve into equity as equity fell. His portfolio drifted towards debt exactly when equity was cheap. Half his loss came from inaction on money he already had, not from the SIP at all.
Tax and interest gave him a refund, and it was not enough. Deposit interest earned him ₹10.5 L and the lower tax bill saved ₹8.3 L, so ₹18.8 L came back. It still left ₹32.8 L gone.
That tax line deserves a sentence of its own, because it is the opposite of what we expected. The Pauser paid ₹31.8 L of tax over 25 years against the Stoic's ₹38.5 L, in today's money. He stopped rebalancing, so he sold less, so he paid less. If we switch tax off entirely, his cost is 0.90% a year instead of 0.91%. Pausing is not a tax problem. It is a market problem.
Does it hold outside this one path?
One journey is one sample, so this is the section that decides whether the headline means anything.
We ran the same four rules over every rolling window the data allows, and then over 2,000 simulated paths built by shuffling 24-month blocks of the same history.
Table 6. The same rules in every window, and in simulation. Source: harness extension.
| Sample | Path | n | Median | 5th pct | 95th pct | Beat the Stoic | Equivalent fee: median (5th–95th) | Fee above 1.5% |
|---|---|---|---|---|---|---|---|---|
| 20-year windows | P2 Pauser | 89 | 90 bps | 61 bps | 140 bps | 0 of 89 | 0.88% (0.60% to 1.29%) | 0 of 89 |
| 20-year windows | P3 Capitulator | 89 | 65 bps | 29 bps | 103 bps | 0 of 89 | 0.61% (0.28% to 0.98%) | 0 of 89 |
| 20-year windows | P4 Drawdown Buyer | 89 | −53 bps | −78 bps | −45 bps | 89 of 89 | −0.50% (−0.73% to −0.45%) | 0 of 89 |
| 15-year windows | P2 Pauser | 149 | 98 bps | 43 bps | 198 bps | 0 of 149 | — | — |
| 15-year windows | P3 Capitulator | 149 | 56 bps | 0 bps | 166 bps | 0 of 149 (30 never triggered) | — | — |
| 15-year windows | P4 Drawdown Buyer | 149 | −67 bps | −87 bps | −33 bps | 149 of 149 | — | — |
| 25-year windows | P2 Pauser | 29 | 95 bps | 87 bps | 98 bps | 0 of 29 | — | — |
| 25-year windows | P3 Capitulator | 29 | 49 bps | 46 bps | 53 bps | 0 of 29 | — | — |
| 25-year windows | P4 Drawdown Buyer | 29 | −50 bps | −52 bps | −49 bps | 29 of 29 | — | — |
| Bootstrap, 25 years (simulation) | P2 Pauser | 2000 | 53 bps | −4 bps | 129 bps | 109 of 2000 (5.5%) | 0.50% (−0.04% to 1.34%) | 48 of 2000 |
| Bootstrap, 25 years (simulation) | P3 Capitulator | 2000 | 35 bps | −66 bps | 186 bps | 359 of 2000 (17.9%) | 0.34% (−0.65% to 1.82%) | 178 of 2000 |
| Bootstrap, 25 years (simulation) | P4 Drawdown Buyer | 2000 | −23 bps | −76 bps | 70 bps | 1463 of 2000 (73.2%) | −0.22% (−0.72% to 0.68%) | 16 of 2000 |
The headline survives everywhere in the history. Pausing never beat the Stoic, in any window of any length. And its equivalent fee never reached 1.5% either: the worst 20-year window came to 1.32%.
The simulation is gentler and less certain. It is built by drawing 24-month blocks at random, which breaks up the long stretches that made the real history painful. There, pausing cost 0.50% at the median and beat the Stoic in 5.5% of paths. It went above a 1.5% fee in 48 paths out of 2,000. Capitulating beat the Stoic in 17.9%.
It is worth saying plainly what the bootstrap is and is not. It asks "what if the same 25 years had arrived in a different order". It is not a way of adding history we do not have, and it cannot produce a crisis India has not had.
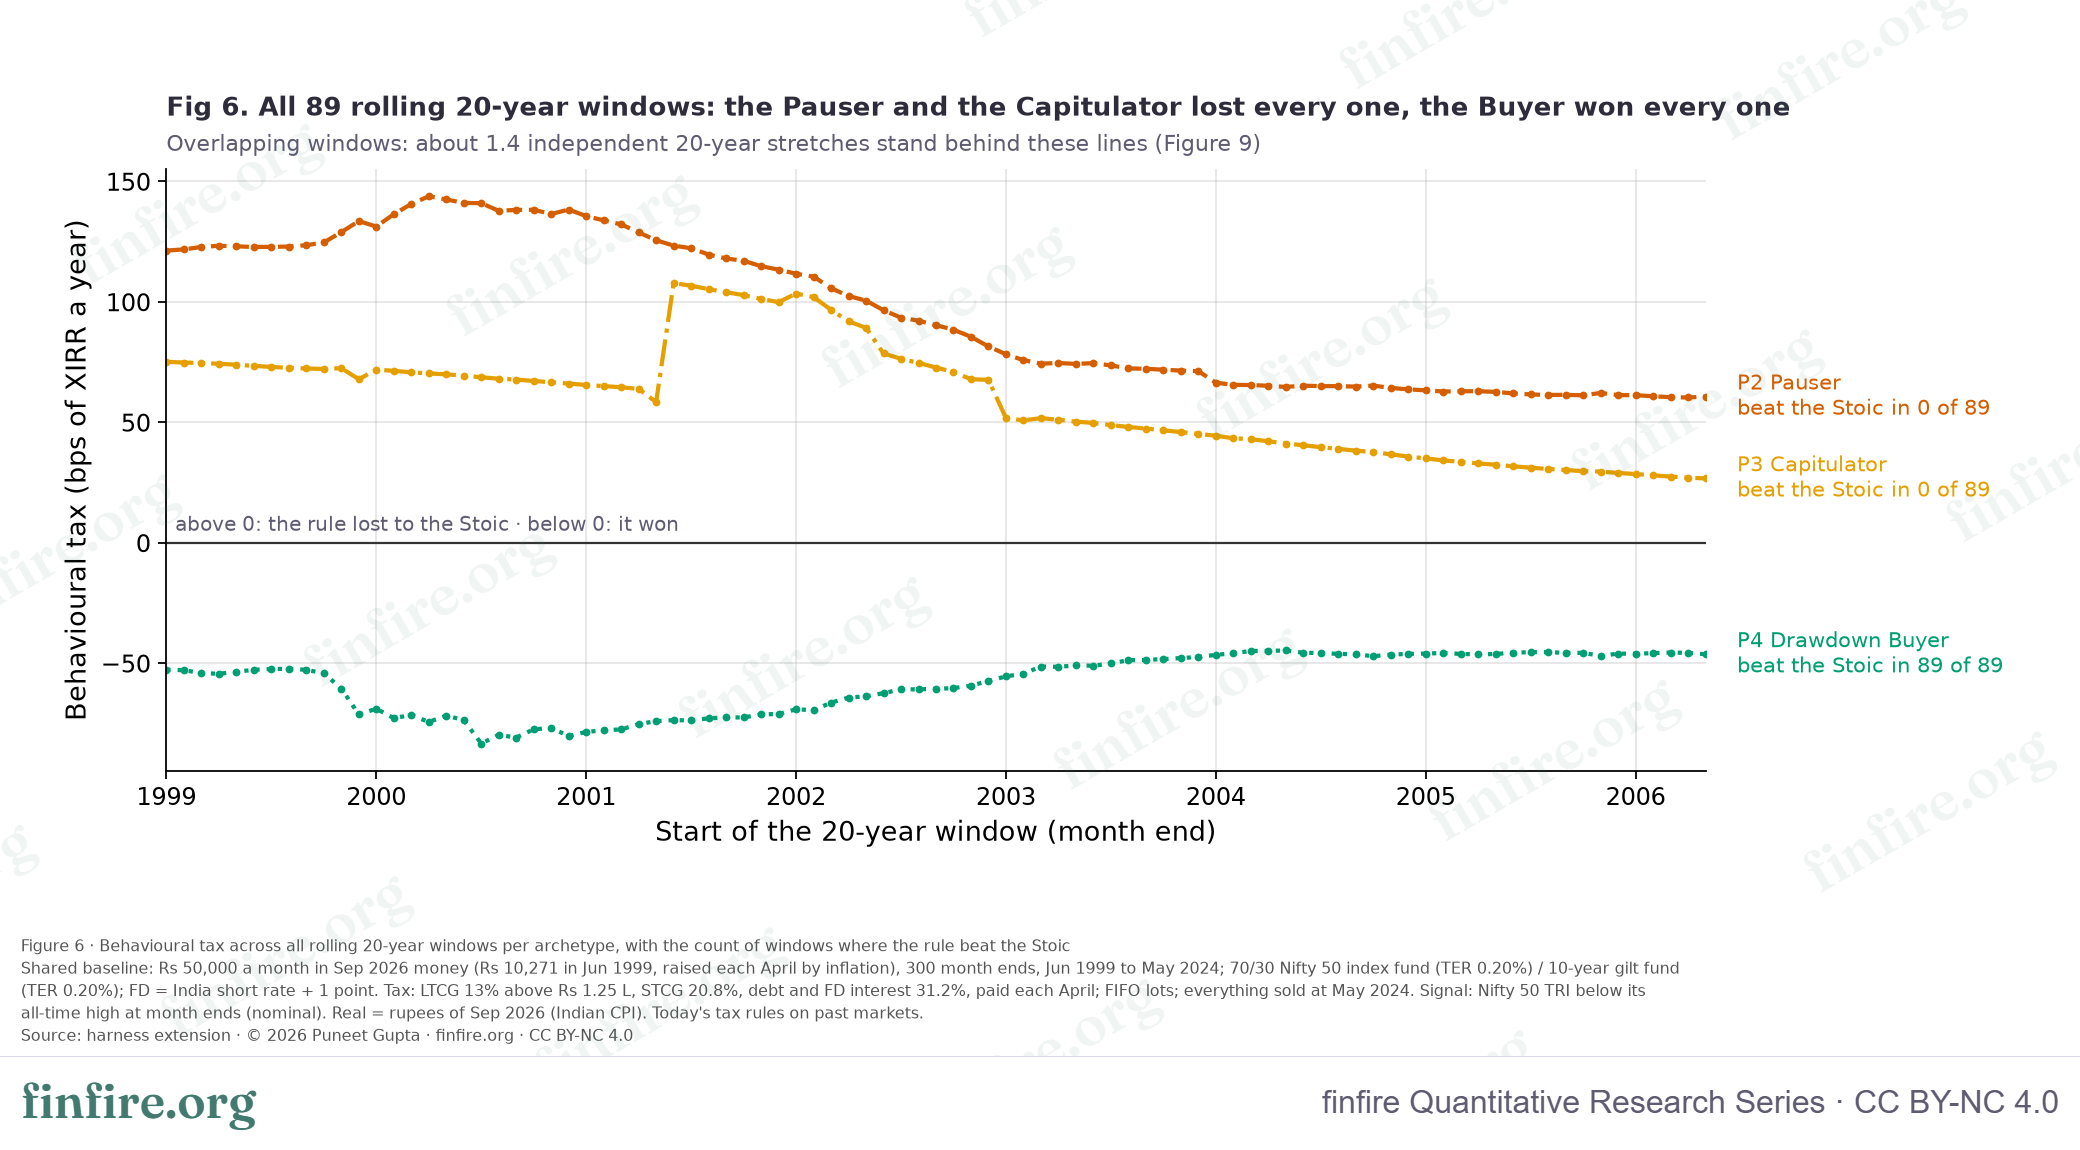
charts/fig6_rolling_windows_data.csv.One fall at a time: the 2000s were the expensive ones
We went in expecting the 2008 pause to be the ruinous one. Deposits paid more than 11% when the 2000–03 pause began, and 8.0% on average over it, while the market went nowhere, so a pause then looked close to free.
It was the opposite.
Table 7. Each fall on its own: what the rule cost over that episode, from the peak to the next new high. Source: harness extension.
| Fall (peak to new high) | Rule | Months out | Gap to the Stoic (real) | Behavioural tax | Equivalent fee | Beat the Stoic? |
|---|---|---|---|---|---|---|
| Feb 2000 to Oct 2003 | P2 Pauser | 37 | ₹15.2 L | 43.0 bps | 0.40% | no |
| Feb 2000 to Oct 2003 | P3 Capitulator | 18 | −₹1.5 L | −4.1 bps | −0.04% | yes |
| Dec 2003 to Nov 2004 | P2 Pauser | 6 | ₹0.9 L | 2.5 bps | 0.02% | no |
| Dec 2007 to Sep 2010 | P2 Pauser | 30 | ₹10.6 L | 29.7 bps | 0.28% | no |
| Dec 2007 to Sep 2010 | P3 Capitulator | 18 | ₹19.9 L | 56.9 bps | 0.53% | no |
| Dec 2010 to Jan 2013 | P2 Pauser | 14 | ₹1.0 L | 2.8 bps | 0.03% | no |
| Feb 2015 to Aug 2016 | P2 Pauser | 6 | ₹0.4 L | 1.1 bps | 0.01% | no |
| Dec 2019 to Nov 2020 | P2 Pauser | 8 | ₹5.7 L | 15.8 bps | 0.15% | no |
The 2000–03 pause cost ₹15.2 L, the 2008 pause ₹10.6 L. Table 8 shows why.
Table 8. The two big falls side by side. TRI figures are index values. "Price vs Stoic" compares the index level when the parked money went in against the Stoic's average level on the same money. Source: harness extension.
| Path | Fall | Out | Back in | Months | Contributions parked (nominal / real) | Equity sold | Stoic's average TRI on the same money | TRI when put back | Price vs Stoic | Equity units forgone | Deposit interest |
|---|---|---|---|---|---|---|---|---|---|---|---|
| P2 Pauser | 2000-03 | Sep 2000 | Oct 2003 | 37 | ₹4.08 L / ₹17.46 L | — | 1201 | 1770 | +47.4% | +32.1% | ₹0.47 L |
| P2 Pauser | 2008-09 | Mar 2008 | Sep 2010 | 30 | ₹4.95 L / ₹13.83 L | — | 5204 | 7555 | +45.2% | +31.1% | ₹0.34 L |
| P3 Capitulator | 2000-03 | Sep 2001 | Mar 2003 | 18 | ₹2.04 L / ₹8.61 L | ₹0.81 L | 1132 | 1085 | −4.2% | −4.3% | ₹0.22 L |
| P3 Capitulator | 2008-09 | Sep 2008 | Mar 2010 | 18 | ₹2.79 L / ₹7.79 L | ₹9.29 L | 4767 | 6522 | +36.8% | +26.9% | ₹0.33 L |
Three reasons the 2000s pause was dearer.
The deposits barely helped. The Pauser parked ₹4.08 L over those 37 months and earned ₹0.47 L of interest on it, before tax. The sums were small because he was young and his SIP was small. A high rate on a small pile is still a small amount.
He came back 47.4% dearer. The money went in at a Nifty 50 TRI of 1770 in October 2003, against an average of 1201 for the same rupees in the Stoic's hands. He bought 32.1% fewer units with the same money. The 2008 figure is almost identical (+45.2%, 31.1% fewer units), so the re-entry penalty was not the difference between the two.
The rupees were early. Money parked in 2000–03 had 21 more years to compound. Money parked in 2008–10 had 14. That is the difference, and it is the one most people get backwards. A pause early in a saving life does more damage than the same pause later, even when the market behaves better.
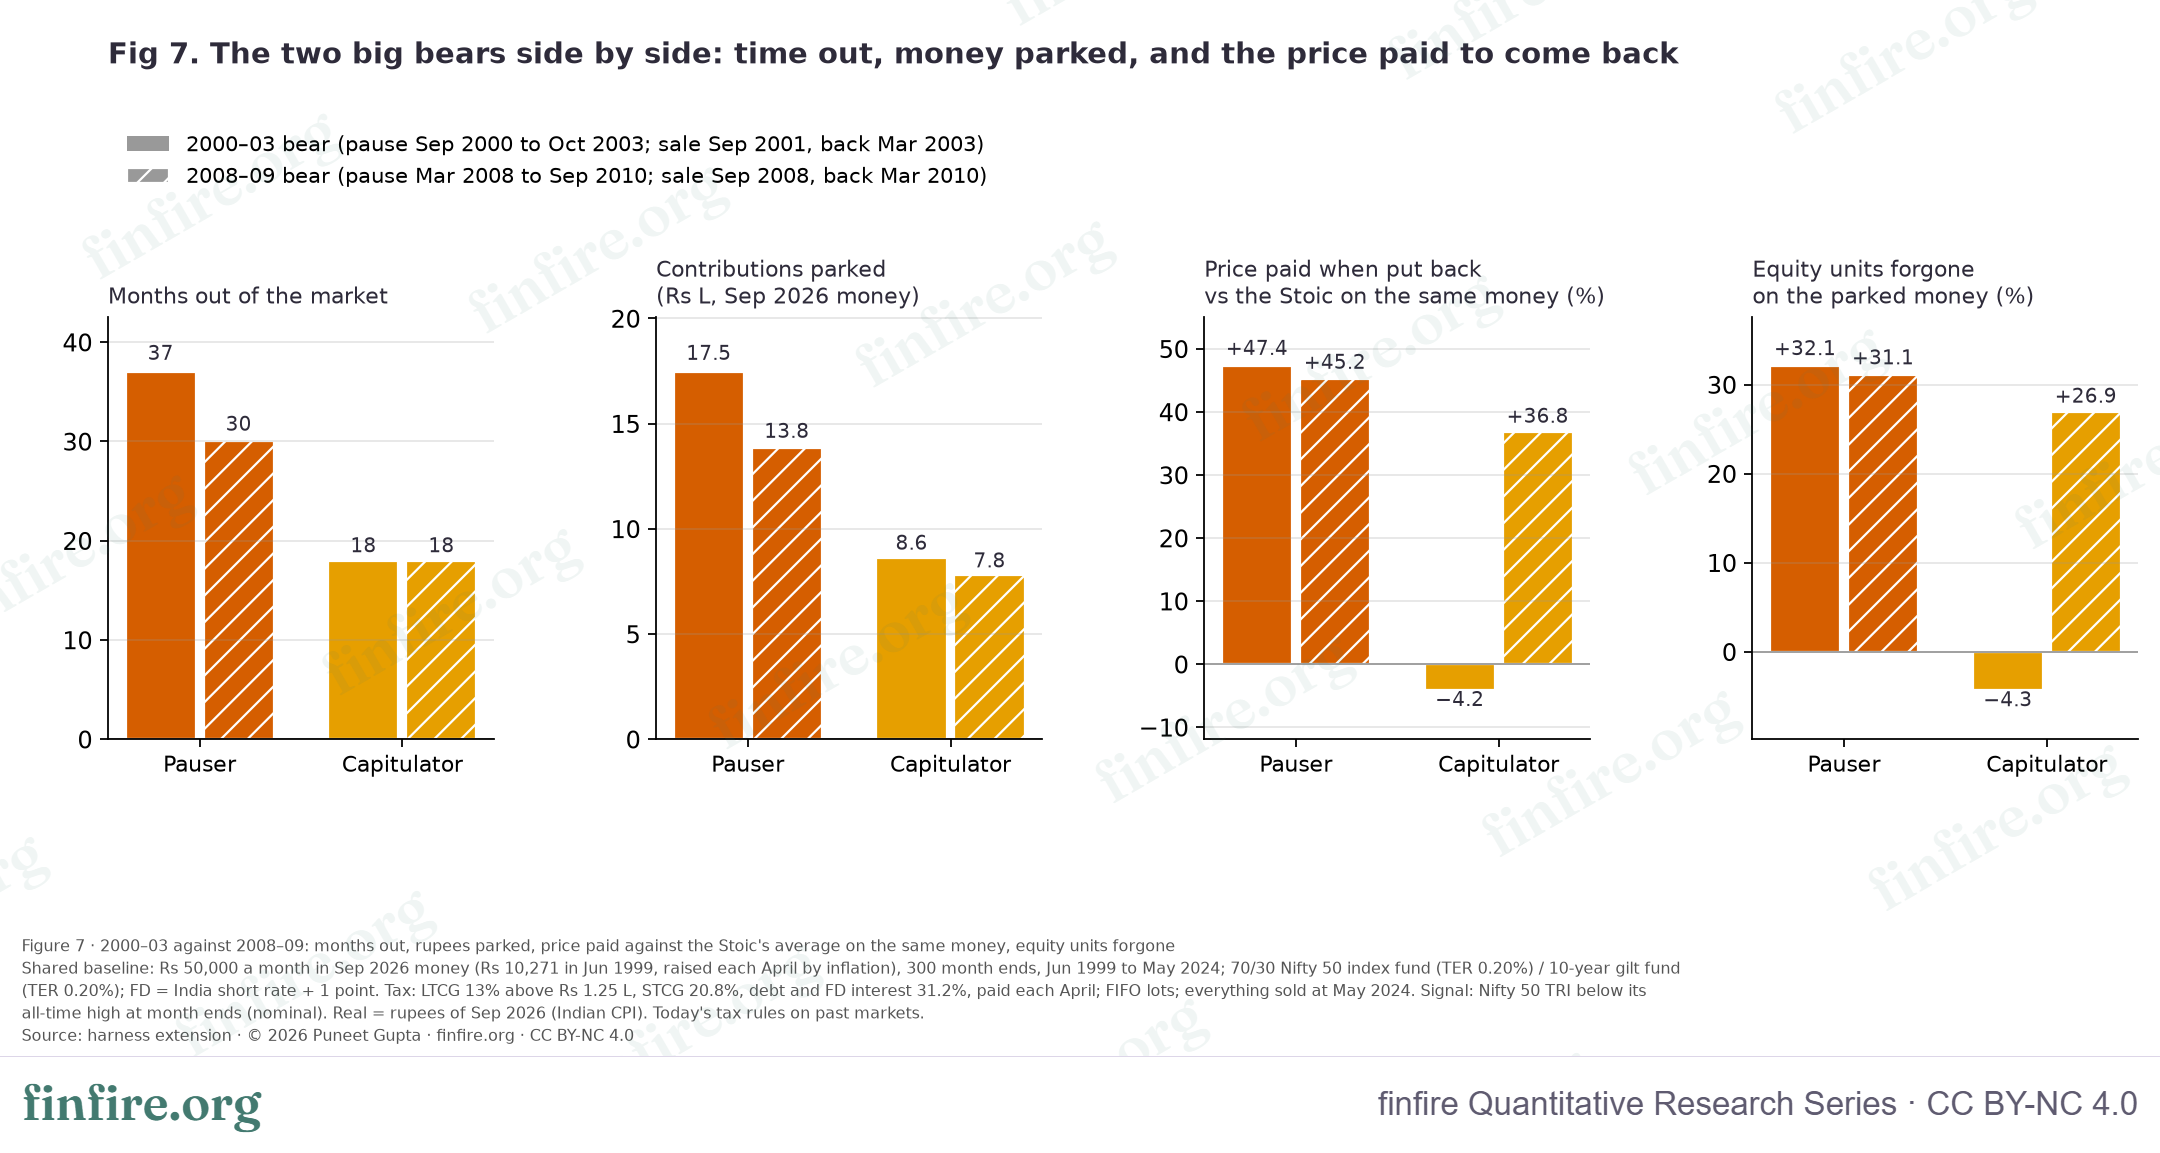
charts/fig7_two_bears_data.csv.The capitulator: one sale free, one ruinous
The Capitulator looks like the villain. He is the only one who actually sold. He ended better than the Pauser.
The reason is in Table 7. His rule fired twice, and the two times could not have been more different.
September 2001. He sold half his equity at the month-end bottom of the 2000–03 fall and came back in March 2003. Over that episode he beat the Stoic by ₹1.5 L. His re-entry price was 4.2% below the Stoic's average on the same money. The market bounced after he left, slipped back, and had not yet recovered when he returned. The tax on that sale came to ₹1,483, because he had little to sell and little gain on it.
September 2008. He sold at −35%, and the market bottomed two months later at −54.7%. He came back in March 2010, after the 2009 rally. His re-entry price was 36.8% above the Stoic's average. That one episode cost ₹19.9 L. The tax year of that sale cost him ₹1.03 L against the Stoic's ₹0.12 L, which is ₹2.66 L of extra tax in today's money.
Same rule. Same investor. One sale was free and one was ruinous, and nothing in the rule told him which one he was in.
That is the honest finding here, and it cuts both ways. Selling in a crash is not reliably punished. It is closer to a coin toss with a bad average: over the full 25 years it still cost 53 basis points a year.
Did any of this reduce the shallow risk?
If the point of stepping out is a calmer ride, it did not work.
Table 9. The ride, and the mechanics. Real figures in September 2026 rupees. Source: harness extension.
| Path | Gap to the Stoic | Max real fall | Ulcer Index | Longest spell below a real peak | Months out of equity | Parked (nominal / real) | Avg price per unit vs Stoic | Units forgone | Tax paid (nominal / real) | Deposit interest (nominal / real) |
|---|---|---|---|---|---|---|---|---|---|---|
| P1 Stoic Rebalancer | — | −44.5% | 18.5 | 135 months | 0 | — | — | — | ₹32.4 L / ₹38.5 L | — |
| P2 Wait-for-Clarity Pauser | ₹32.8 L (11.9% less) | −43.3% | 21.2 | 158 months | 101 | ₹17.5 L / ₹47.5 L | +9.4% | +10.7% | ₹27.7 L / ₹31.8 L | ₹1.18 L / ₹3.74 L |
| P3 Capitulator | ₹18.6 L (6.7% less) | −43.9% | 22.4 | 156 months | 36 | ₹14.9 L / ₹47.7 L | −0.4% | +7.2% | ₹29.7 L / ₹37.3 L | ₹1.41 L / ₹4.27 L |
| P4 Drawdown Buyer | ₹19.4 L more (7.0%) | −51.0% | 18.7 | 121 months | 0 | — | +6.2% | −5.1% | ₹34.2 L / ₹43.9 L | — |
The deepest real fall was −44.5% for the Stoic, −43.3% for the Pauser and −43.9% for the Capitulator. Stepping out shaved about one percentage point off the worst moment, because by the time the rule fired, most of the fall had already happened.
The time spent below a past peak went the wrong way. The Stoic's wealth was under its own high for 135 months at the longest. The Pauser's for 158, the Capitulator's for 156. Their Ulcer Index, which measures how deep and how long, was 21.2 and 22.4 against the Stoic's 18.5.
So the reactions did not buy comfort. The savers felt the same crash and then took longer to get back.
The Drawdown Buyer is the mirror image. He sat through the deepest fall of all, −51.0%, because he was holding 90% equity at the bottom. But his wealth was below its peak for the shortest time, 121 months, and he ended with the most money. He paid in discomfort and was paid back in rupees.
One caution about him. He is a drawdown rule, not a valuation rule: he watches the fall from a high and nothing else. His clean sweep of the historical windows rests on India's falls having ended in new highs within a few years. In the bootstrap, where that is not guaranteed, he won 73.2% of the time rather than always.
Change the rule and the answer moves
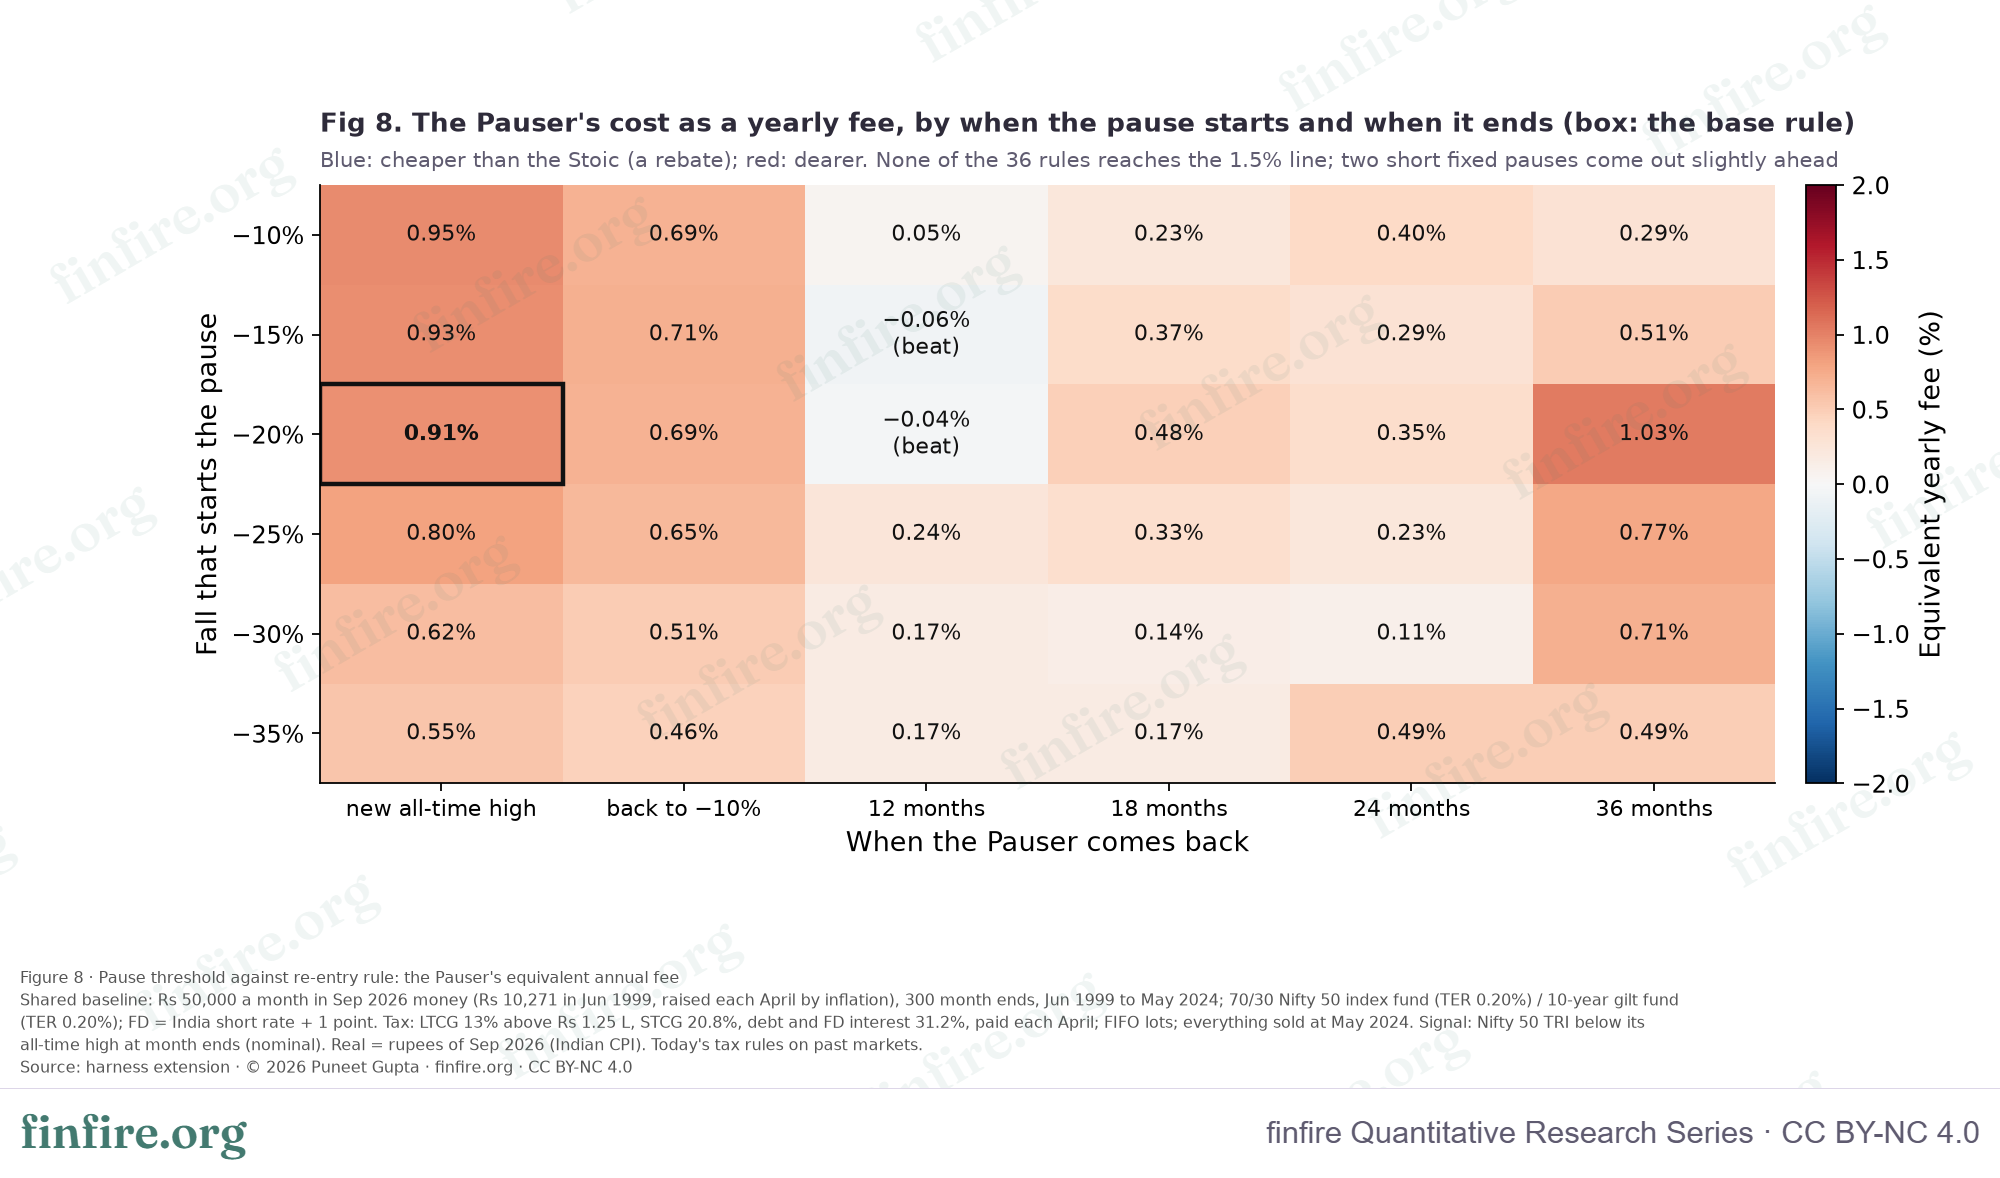
The 0.91% figure belongs to one specific rule: pause at −20%, come back at a new all-time high. Table 10 runs 36 versions of that rule.
Table 10. The Pauser's equivalent yearly fee, for six pause thresholds and six ways of coming back. Source: harness extension.
| Pause starts at | new all-time high | back to −10% | 12 months | 18 months | 24 months | 36 months |
|---|---|---|---|---|---|---|
| −10% | 0.95% | 0.69% | 0.05% | 0.23% | 0.40% | 0.29% |
| −15% | 0.93% | 0.71% | −0.06% (beat) | 0.37% | 0.29% | 0.51% |
| −20% | 0.91% | 0.69% | −0.04% (beat) | 0.48% | 0.35% | 1.03% |
| −25% | 0.80% | 0.65% | 0.24% | 0.33% | 0.23% | 0.77% |
| −30% | 0.62% | 0.51% | 0.17% | 0.14% | 0.11% | 0.71% |
| −35% | 0.55% | 0.46% | 0.17% | 0.17% | 0.49% | 0.49% |
Two patterns run through the grid.
How you come back matters more than when you stop. Reading across a row, the fee moves by between 0.38 and 1.07 points. Reading down a column, it moves by 0.25 to 0.40 points, except in the 36-month column (0.75). Waiting for a new all-time high was the worst way back in four of the six rows; at −20% and −30%, a fixed 36-month wait cost more (1.03% and 0.71%).
Two short fixed pauses actually beat the Stoic. A 12-month pause triggered at −15% came to −0.06%, and at −20% to −0.04%. The reason is a date: a pause starting in September 2000 ended twelve months later in September 2001, which was the month-end bottom. That is the calendar being kind, not a rule anyone could have planned. It is in the table because leaving it out would be dishonest.
charts/fig8_sensitivity_grid_data.csv.Change the assumptions and two of them break the headline
We re-ran everything under fifteen different settings. Most barely move the answer. Two move it a long way.
Table 11. The same three reactions under different assumptions. Every archetype under every variant is in Appendix A1. Source: harness extension.
| Variant | Stoic (real) | Pauser: fee / bps | Capitulator: fee / bps | Buyer: fee / bps |
|---|---|---|---|---|
| Base | ₹2.77 Cr | 0.91% / 97 | 0.50% / 53 | −0.48% / −51 |
| Allocation 60/40 | ₹2.49 Cr | 0.89% / 92 | 0.46% / 48 | −0.45% / −47 |
| Allocation 80/20 | ₹3.08 Cr | 0.92% / 101 | 0.55% / 61 | −0.39% / −42 |
| Allocation 100/0 | ₹3.75 Cr | 0.75% / 86 | 0.50% / 57 | — |
| Real drawdown as the trigger | ₹2.77 Cr | 1.81% / 193 | 0.52% / 55 | −0.53% / −57 |
| Nifty 500 TRI as the equity leg | ₹3.17 Cr | 1.10% / 118 | 0.68% / 74 | −0.54% / −58 |
| Surcharge on (salary ₹30 L) | ₹2.72 Cr | 0.96% / 100 | 0.49% / 52 | −0.50% / −52 |
| 20% slab instead of 30% | ₹2.82 Cr | 0.88% / 95 | 0.47% / 51 | −0.48% / −52 |
| Deposit rate +1 point | ₹2.77 Cr | 0.88% / 93 | 0.48% / 51 | −0.48% / −51 |
| Deposit rate −1 point | ₹2.77 Cr | 0.93% / 99 | 0.52% / 55 | −0.48% / −51 |
| Tax off | ₹3.20 Cr | 0.90% / 103 | 0.38% / 43 | −0.60% / −69 |
| Law of the day (approximate) | ₹2.91 Cr | 0.94% / 101 | 0.46% / 49 | −0.60% / −66 |
| Pauser: the parked money never goes back | ₹2.77 Cr | 2.83% / 301 | — | — |
| Capitulator sells 25% | ₹2.77 Cr | — | 0.33% / 35 | — |
| Capitulator sells 100% | ₹2.77 Cr | — | 0.83% / 88 | — |
The trigger that breaks it. If the rule watches the Nifty's fall after inflation rather than in rupees, the Pauser's fee jumps to 1.81%, above the 1.5% line. The reason is arithmetic: after inflation the index is below its real peak far more often, so the same rule keeps him out for 200 months instead of 101, in three long spells instead of six short ones. This paper uses the rupee figure, because that is the number an investor actually sees. If you define "20% down" the other way, the briefed claim does hold.
The variant that breaks it harder. If the parked money never goes back into equity at all, and only the new SIP resumes, the fee is 2.83%. That is the version of this behaviour that beats a 1.5% fee comfortably.
The rest move it much less. Changing the allocation to 60/40 or 80/20 moves the answer by 0.02 points or less; going to 100/0 lowers it by 0.16 points, to 0.75%. Using the Nifty 500 raises it by 0.19 points, to 1.10%. Turning tax off moves it by 0.01. Moving the deposit rate a full point moves it by 0.03 one way and 0.02 the other.
How much history stands behind these numbers
Not much, and it matters.
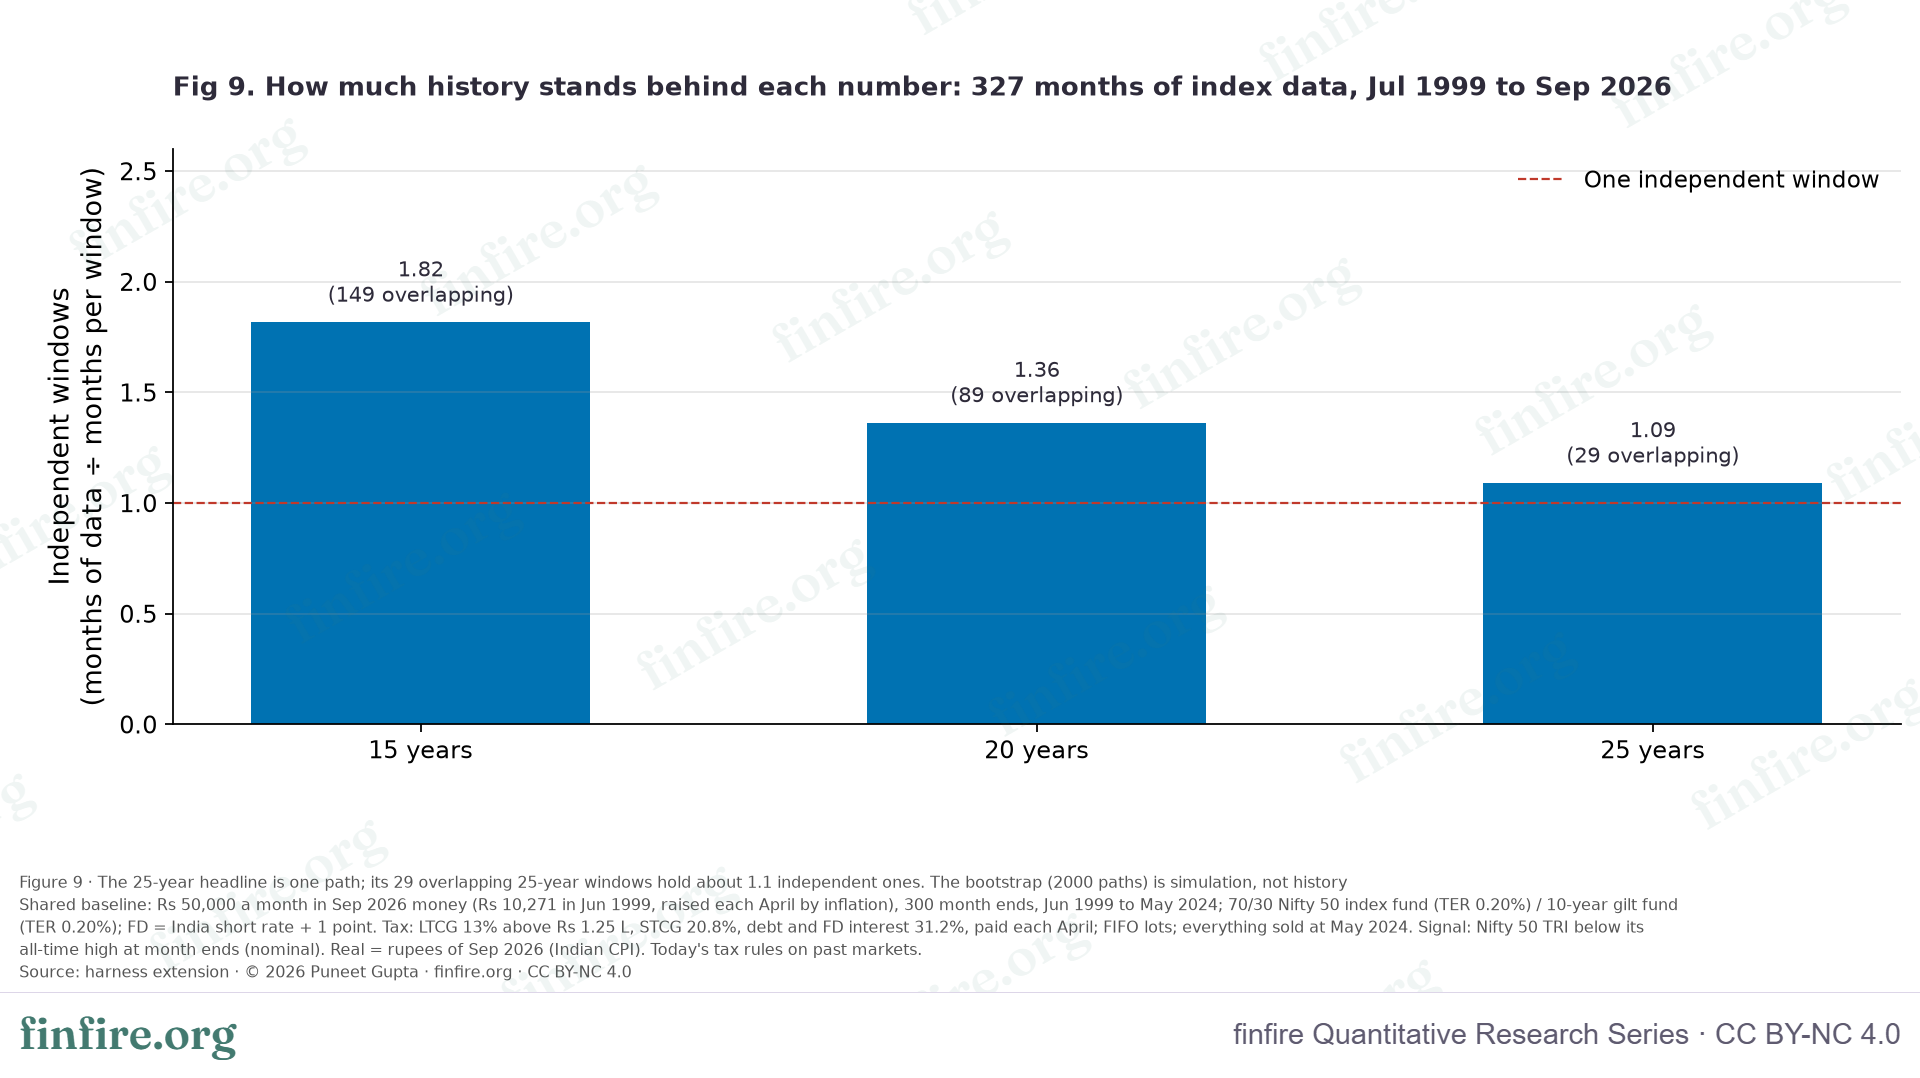
The windows overlap almost completely. Neighbouring 20-year windows share 239 of their 240 months. Counted honestly, 25 years of data holds about 1.09 independent 25-year stretches and 1.36 independent 20-year stretches.
Table 12. How much history is really behind each number. Source: harness extension.
| Horizon | Overlapping windows | Non-overlapping | Independent equivalent |
|---|---|---|---|
| 15 years | 149 | 1 | 1.82 |
| 20 years | 89 | 1 | 1.36 |
| 25 years | 29 | 1 | 1.09 |
So "pausing never beat the Stoic in 89 windows" is not 89 separate pieces of evidence. It is closer to one and a bit. A different 25 years could give a different number.
charts/fig9_sample_size_data.csv.What the calculator shows
The calculator runs one steady return, not month-by-month history. That difference turns out to be the point.
Table 13. The same ideas in accumulate.finfire.org, on the June 1999 to May 2024 average returns. Source: calculator.
| Plan | Corpus | In today's money | Against the Stoic |
|---|---|---|---|
| P1 Stoic | ₹13.25 Cr | ₹3.05 Cr | — |
| Both returns cut by 1.5 points (a stand-in for a 1.5% charge) | ₹10.84 Cr | ₹2.50 Cr | −18.2% |
| Contributions paused in the Pauser's years, money not invested | ₹8.60 Cr | ₹1.98 Cr | −35.1% |
| The same pauses, with the parked money put back a year later | ₹12.84 Cr | ₹2.96 Cr | −3.1% |
| P1 Stoic with Simulated markets | ₹13.25 Cr | ₹3.05 Cr | 0.0% |
In 2,000 simulated markets, the Stoic's plan ends with at least ₹1.56 Cr in 9 cases out of 10, at least ₹3.54 Cr in half, and ₹8.55 Cr or more in 1 in 10, all in today's money.
Look at the fourth row. On one steady return, pausing and then putting the money back costs only 3.1%. In the real history the same behaviour cost 11.9%.
That gap is the lesson of this paper in a single number. With one steady return there is no crash to miss and no high to buy back at, so a pause costs only lost time in the market. Everything else — the cheap units not bought, the new high paid on the way back, the debt sleeve left unrebalanced — only exists when prices actually move. A steady-return model cannot show the cost of panic, because panic needs something to panic about.
What this means for you
This paper describes what happened between June 1999 and May 2024. It does not tell you what to do.
- Pausing a SIP is not free, and it is not catastrophic either. On this history it cost 97 basis points a year and 21 months of delay. As a yearly fee that is 0.91%: more than most people would accept from a fund, less than the 1.5% this paper set out to beat.
- The expensive decision is when you go back in, not when you stop. Across 36 versions of the rule, the way back mattered far more than the trigger. Waiting for a new all-time high was the worst of the six ways tested in four of the six rows, and the second worst in the other two.
- If money is paused, it has to go back. The pauser who redeployed paid the equivalent of 0.91%. The one who left it in the deposit paid 2.83%.
- Not rebalancing is half the cost, and it is invisible. ₹15.9 L of the ₹32.8 L came from leaving the existing portfolio alone during the falls. No SIP decision was involved.
- An early pause costs more than a late one. The 2000–03 pause cost more than the 2008 one despite smaller sums and higher deposit rates, because those rupees had 21 more years to compound.
- Selling is closer to a coin toss with a bad average. One capitulation beat the steady saver by ₹1.5 L; the other cost ₹19.9 L. Nothing in the rule distinguished them in advance.
- None of the reactions made the ride easier. All four sat through a real fall of 43% to 51%, and the two who stepped out spent longer below their own peak, not less.
- The tax story is the opposite of the intuition. The pauser paid ₹6.7 L less tax than the steady saver, because he stopped rebalancing. It did not save him.
Limitations
- One path, and barely any history. 25 years of index data is about 1.09 independent 25-year stretches. Every window overlaps nearly every other one. A different 25 years could give a different number.
- The bootstrap is a simulation, not more history. Shuffling 24-month blocks of the same years cannot produce a crisis India has not had.
- Today's tax rules on past markets. Equity gains were untaxed until March 2018 and taxed at 10% above ₹1 L until July 2024. A capitulator selling in 2008 paid no long-term tax at the time. We kept today's rules for consistency with Paper 4 and Paper 9. The approximate law-of-the-day run is in Table 11: it moves the Pauser to 0.94% and the Capitulator to 0.46%, so it changes little.
- The debt leg before 2011 is an estimate. We use the NSE 10-year G-Sec index from February 2011, and Paper 4's method on RBI yields before that.
- The deposit rate is built, not observed. It is the short-term rate plus 1 percentage point, checked against current one-year card rates. Moving it a point changes the answer by 0.03 points one way and 0.02 the other.
- Not modelled: TDS on deposit interest, exit loads, securities transaction tax, penalties for breaking a deposit early, and any rule change after FY 2026-27.
- The savers are mechanical. People are not. A real investor who pauses may also spend the parked money, change the rule halfway, or stop saving altogether. The "never goes back" variant (2.83%) is the closest this paper comes to that, and it is the worst result in the paper.
- The Drawdown Buyer is a drawdown rule, not a valuation rule. It watches the fall from a high, not price-to-earnings or anything else.
Try this scenario yourself
The calculator runs one steady return, so it cannot show a crash being missed. What it can show is the shape of the thing: what a pause costs when the only cost is time, and what a fee costs. The gap between the two is the instructive part. Sign in to open the links. All three scenarios need Pro.
The calculator has no fee input, so the 1.5% charge is shown by cutting both returns by 1.5 points. That is a stand-in, not the same thing.
Scenario 1 · The steady saver against the same plan with a 1.5-point cut · Pro
Step 1 · Open the steady saver's plan. Open This is ₹50,000 a month rising with inflation, 70/30, for 25 years, at the June 1999 to May 2024 average returns. The page shows: After 25 years you will have ₹13.25 Cr — ₹3.05 Cr in today's money.
Step 2 · Pin it (Pro). Under Compare (Pro), press Pin this plan (create a baseline plan to compare). It becomes Plan A.
Step 3 · Cut both returns. Set Equity return to 12.33 and Debt return to 5.64.
Step 4 · Read the answer. The page shows: After 25 years you will have ₹10.84 Cr — ₹2.50 Cr in today's money. The Compare card says: Both plans stop working in the same year, with ₹55.64 L less in today's money.
Scenario 2 · The steady saver against the same plan paused twice · Pro
Step 1 · Open the steady saver's plan. Open The page shows: After 25 years you will have ₹13.25 Cr — ₹3.05 Cr in today's money.
Step 2 · Pin it (Pro). Under Compare (Pro), press Pin this plan (create a baseline plan to compare). It becomes Plan A.
Step 3 · Add the first pause. Press Add a change. Set Change 1 to A pause, From year to 2, and For how many years to 3.
Step 4 · Add the second pause. Press Add a change again. Set Change 2 to A pause, From year to 10, and For how many years to 3.
Step 5 · Read the answer. The page shows: After 25 years you will have ₹9.09 Cr — ₹2.09 Cr in today's money. The Compare card says: Both plans stop working in the same year, with ₹95.88 L less in today's money. Here the paused money is never invested at all, which is the harsh version. In the paper's main run it goes back in at the next new high.
Scenario 3 · The same comparison in simulated markets · Pro
Step 1 · Open the plan with Simulated markets on (Pro). Open The page shows: In 2,000 simulated markets, 9 in 10 end with at least ₹1.56 Cr, half with at least ₹3.54 Cr, and 1 in 10 with ₹8.55 Cr or more (in today's money).
Step 2 · Pin it (Pro). Under Compare (Pro), press Pin this plan (create a baseline plan to compare). It becomes Plan A.
Step 3 · Cut both returns. Set Equity return to 12.33 and Debt return to 5.64.
Step 4 · Read the answer. The page shows: In 2,000 simulated markets, 9 in 10 end with at least ₹1.31 Cr, half with at least ₹2.90 Cr, and 1 in 10 with ₹6.81 Cr or more (in today's money). The Compare card says: Both plans stop working in the same year, with ₹55.64 L less in today's money.
The two pause plans on their own (Pro: Yearly raise, Changes, Equity and debt).
- Paused in the Pauser's years, with the money never invested: Open The page shows: After 25 years you will have ₹8.60 Cr — ₹1.98 Cr in today's money.
- The same pauses, with the parked money put back as a lump sum the year after each: Open The page shows: After 25 years you will have ₹12.84 Cr — ₹2.96 Cr in today's money.
That last pair is worth sitting with. On one steady return, pausing and redeploying costs 3.1%. In the real history, the same behaviour cost 11.9%.
Reproducibility
Every calculator link in this paper was reopened in a fresh copy of the page and gave the same answer to the paisa. The links are listed in urls.csv. Under the calculator's own rules, the history runs match the calculator to the paisa on 20 plans, and they were re-computed independently in plain Python: 35 numbers, no differences. The money going in is identical on every path, to the rupee. Everything was regenerated from saved inputs twice, with identical results. The data behind each figure is in the CSV named in its caption.
Appendix
A1. Every archetype under every variant
Real figures in September 2026 rupees. Source: harness extension.
| Variant | Path | Real after tax | Stoic (real) | Behavioural tax | Equivalent fee | × 1.5% | Beat? | Tax paid (real) | Stoic tax (real) | Months out | Episodes |
|---|---|---|---|---|---|---|---|---|---|---|---|
| Base | P2 Pauser | ₹2.44 Cr | ₹2.77 Cr | 96.8 bps | 0.91% | 0.60 | no | ₹31.8 L | ₹38.5 L | 101 | 6 |
| Base | P3 Capitulator | ₹2.58 Cr | ₹2.77 Cr | 53.2 bps | 0.50% | 0.33 | no | ₹37.3 L | ₹38.5 L | 36 | 2 |
| Base | P4 Drawdown Buyer | ₹2.96 Cr | ₹2.77 Cr | −51.1 bps | −0.48% | −0.32 | yes | ₹43.9 L | ₹38.5 L | 0 | 0 |
| 60/40 (Buyer: 70% and 80%) | P2 Pauser | ₹2.21 Cr | ₹2.49 Cr | 92.4 bps | 0.89% | 0.59 | no | ₹30.1 L | ₹36.3 L | 101 | 6 |
| 60/40 (Buyer: 70% and 80%) | P3 Capitulator | ₹2.34 Cr | ₹2.49 Cr | 48.4 bps | 0.46% | 0.31 | no | ₹35.0 L | ₹36.3 L | 36 | 2 |
| 60/40 (Buyer: 70% and 80%) | P4 Drawdown Buyer | ₹2.65 Cr | ₹2.49 Cr | −47.5 bps | −0.45% | −0.30 | yes | ₹41.1 L | ₹36.3 L | 0 | 0 |
| 80/20 (Buyer: 90% and 100%) | P2 Pauser | ₹2.70 Cr | ₹3.08 Cr | 100.9 bps | 0.92% | 0.61 | no | ₹34.0 L | ₹40.5 L | 101 | 6 |
| 80/20 (Buyer: 90% and 100%) | P3 Capitulator | ₹2.85 Cr | ₹3.08 Cr | 60.6 bps | 0.55% | 0.37 | no | ₹39.4 L | ₹40.5 L | 36 | 2 |
| 80/20 (Buyer: 90% and 100%) | P4 Drawdown Buyer | ₹3.27 Cr | ₹3.08 Cr | −42.3 bps | −0.39% | −0.26 | yes | ₹45.3 L | ₹40.5 L | 0 | 0 |
| 100/0 (no Buyer: no room above 100%) | P2 Pauser | ₹3.33 Cr | ₹3.75 Cr | 85.9 bps | 0.75% | 0.50 | no | ₹39.2 L | ₹44.4 L | 101 | 6 |
| 100/0 (no Buyer: no room above 100%) | P3 Capitulator | ₹3.47 Cr | ₹3.75 Cr | 57.3 bps | 0.50% | 0.33 | no | ₹44.7 L | ₹44.4 L | 36 | 2 |
| Real drawdown as the trigger | P2 Pauser | ₹2.16 Cr | ₹2.77 Cr | 193.0 bps | 1.81% | 1.21 | no | ₹32.9 L | ₹38.5 L | 200 | 3 |
| Real drawdown as the trigger | P3 Capitulator | ₹2.58 Cr | ₹2.77 Cr | 55.2 bps | 0.52% | 0.34 | no | ₹37.1 L | ₹38.5 L | 36 | 2 |
| Real drawdown as the trigger | P4 Drawdown Buyer | ₹2.98 Cr | ₹2.77 Cr | −56.5 bps | −0.53% | −0.35 | yes | ₹39.5 L | ₹38.5 L | 0 | 0 |
| Nifty 500 TRI as the equity leg | P2 Pauser | ₹2.70 Cr | ₹3.17 Cr | 118.3 bps | 1.10% | 0.73 | no | ₹36.4 L | ₹45.3 L | 101 | 6 |
| Nifty 500 TRI as the equity leg | P3 Capitulator | ₹2.87 Cr | ₹3.17 Cr | 73.8 bps | 0.68% | 0.45 | no | ₹42.1 L | ₹45.3 L | 36 | 2 |
| Nifty 500 TRI as the equity leg | P4 Drawdown Buyer | ₹3.42 Cr | ₹3.17 Cr | −58.0 bps | −0.54% | −0.36 | yes | ₹52.1 L | ₹45.3 L | 0 | 0 |
| Surcharge on (salary ₹30 L) | P2 Pauser | ₹2.39 Cr | ₹2.72 Cr | 99.7 bps | 0.96% | 0.64 | no | ₹37.0 L | ₹43.5 L | 101 | 6 |
| Surcharge on (salary ₹30 L) | P3 Capitulator | ₹2.54 Cr | ₹2.72 Cr | 52.0 bps | 0.49% | 0.33 | no | ₹41.3 L | ₹43.5 L | 36 | 2 |
| Surcharge on (salary ₹30 L) | P4 Drawdown Buyer | ₹2.91 Cr | ₹2.72 Cr | −52.0 bps | −0.50% | −0.33 | yes | ₹48.6 L | ₹43.5 L | 0 | 0 |
| 20% slab instead of 30% | P2 Pauser | ₹2.49 Cr | ₹2.82 Cr | 95.5 bps | 0.88% | 0.59 | no | ₹28.6 L | ₹34.6 L | 101 | 6 |
| 20% slab instead of 30% | P3 Capitulator | ₹2.63 Cr | ₹2.82 Cr | 51.2 bps | 0.47% | 0.31 | no | ₹33.4 L | ₹34.6 L | 36 | 2 |
| 20% slab instead of 30% | P4 Drawdown Buyer | ₹3.02 Cr | ₹2.82 Cr | −51.8 bps | −0.48% | −0.32 | yes | ₹40.0 L | ₹34.6 L | 0 | 0 |
| Deposit rate +1 point | P2 Pauser | ₹2.45 Cr | ₹2.77 Cr | 93.4 bps | 0.88% | 0.58 | no | ₹32.3 L | ₹38.5 L | 101 | 6 |
| Deposit rate +1 point | P3 Capitulator | ₹2.59 Cr | ₹2.77 Cr | 51.1 bps | 0.48% | 0.32 | no | ₹37.6 L | ₹38.5 L | 36 | 2 |
| Deposit rate +1 point | P4 Drawdown Buyer | ₹2.96 Cr | ₹2.77 Cr | −51.1 bps | −0.48% | −0.32 | yes | ₹43.9 L | ₹38.5 L | 0 | 0 |
| Deposit rate −1 point | P2 Pauser | ₹2.43 Cr | ₹2.77 Cr | 99.1 bps | 0.93% | 0.62 | no | ₹31.5 L | ₹38.5 L | 101 | 6 |
| Deposit rate −1 point | P3 Capitulator | ₹2.57 Cr | ₹2.77 Cr | 55.3 bps | 0.52% | 0.34 | no | ₹37.0 L | ₹38.5 L | 36 | 2 |
| Deposit rate −1 point | P4 Drawdown Buyer | ₹2.96 Cr | ₹2.77 Cr | −51.1 bps | −0.48% | −0.32 | yes | ₹43.9 L | ₹38.5 L | 0 | 0 |
| Tax off | P2 Pauser | ₹2.79 Cr | ₹3.20 Cr | 103.1 bps | 0.90% | 0.60 | no | ₹0.0 L | ₹0.0 L | 101 | 6 |
| Tax off | P3 Capitulator | ₹3.02 Cr | ₹3.20 Cr | 43.2 bps | 0.38% | 0.25 | no | ₹0.0 L | ₹0.0 L | 36 | 2 |
| Tax off | P4 Drawdown Buyer | ₹3.51 Cr | ₹3.20 Cr | −69.0 bps | −0.60% | −0.40 | yes | ₹0.0 L | ₹0.0 L | 0 | 0 |
| Law of the day (equity; approximate) | P2 Pauser | ₹2.55 Cr | ₹2.91 Cr | 101.3 bps | 0.94% | 0.63 | no | ₹21.7 L | ₹25.1 L | 101 | 6 |
| Law of the day (equity; approximate) | P3 Capitulator | ₹2.73 Cr | ₹2.91 Cr | 49.2 bps | 0.46% | 0.30 | no | ₹24.6 L | ₹25.1 L | 36 | 2 |
| Law of the day (equity; approximate) | P4 Drawdown Buyer | ₹3.18 Cr | ₹2.91 Cr | −65.5 bps | −0.60% | −0.40 | yes | ₹27.8 L | ₹25.1 L | 0 | 0 |
| Parked money never goes back | P2 Pauser | ₹1.89 Cr | ₹2.77 Cr | 300.9 bps | 2.83% | 1.88 | no | ₹32.1 L | ₹38.5 L | 101 | 6 |
| Capitulator sells 25% | P3 Capitulator | ₹2.64 Cr | ₹2.77 Cr | 34.9 bps | 0.33% | 0.22 | no | ₹37.2 L | ₹38.5 L | 36 | 2 |
| Capitulator sells 100% | P3 Capitulator | ₹2.47 Cr | ₹2.77 Cr | 88.3 bps | 0.83% | 0.55 | no | ₹37.2 L | ₹38.5 L | 36 | 2 |
A2. The money going in
₹50,000 a month in September 2026 rupees, raised each April by the previous year's inflation. Identical on every path. Source: harness extension.
| From | Each month |
|---|---|
| Jun 1999 | ₹10,271 |
| Apr 2002 | ₹11,611 |
| Apr 2005 | ₹13,025 |
| Apr 2008 | ₹15,681 |
| Apr 2011 | ₹21,175 |
| Apr 2014 | ₹27,418 |
| Apr 2017 | ₹31,404 |
| Apr 2020 | ₹35,677 |
| Apr 2023 | ₹42,544 |
| Apr 2024 | ₹44,609 |
A3. Notes on law and data
| Item | What this paper uses |
|---|---|
| Equity tax | 12.5% plus 4% cess = 13% above the ₹1.25 L yearly exemption; 20% plus cess = 20.8% under 12 months. FY 2026-27 rules, applied to every past year. |
| Debt and deposit tax | 31.2% (30% slab plus cess) on debt-fund gains and on deposit interest as it accrues. A 20% slab is run as a variant. |
| Law of the day | Equity gains were untaxed to March 2018 and taxed at 10% above ₹1 L to July 2024. The variant in Table 11 approximates this. |
| Equity index | Nifty 50 TRI (NSE), monthly, from June 1999. Nifty 500 TRI run as a variant. |
| Debt index | NSE 10-year G-Sec index from February 2011; before that, Paper 4's estimate from RBI yields. |
| Deposit rate | The India short rate plus 1 percentage point, one year, rolled. The spread is checked against current one-year card rates. |
| Indian CPI | CPI for industrial workers to November 2011, CPI Combined after. |
| Expense ratios | 0.20% on both the equity and debt legs. |
| Windows | 89 rolling 20-year windows here, against Paper 9's 88, because this paper counts 240 month ends to a window and Paper 9 counts 241. |
| Not modelled | TDS, exit loads, securities transaction tax, penalties for breaking a deposit early, rule changes after FY 2026-27. |
Every number in this paper rests on assumptions, not forecasts. Tax rules are FY2026-27 under the new regime and may change. None of this constitutes financial, tax, or investment advice. finfire.org operates the calculator and offers paid tiers.
Reproducibility. Every calculator link in this paper, with the value it should show. urls.csv