The Safety Paradox: What a Taxed Bank FD Does to ₹1 Cr over 30 Years, and When an Index Fund's Bad Luck First Beats It
Testing the myth that a fixed deposit is risk-free and equity is the risky one
finfire Quantitative Research Series · Paper #11 · November 2026
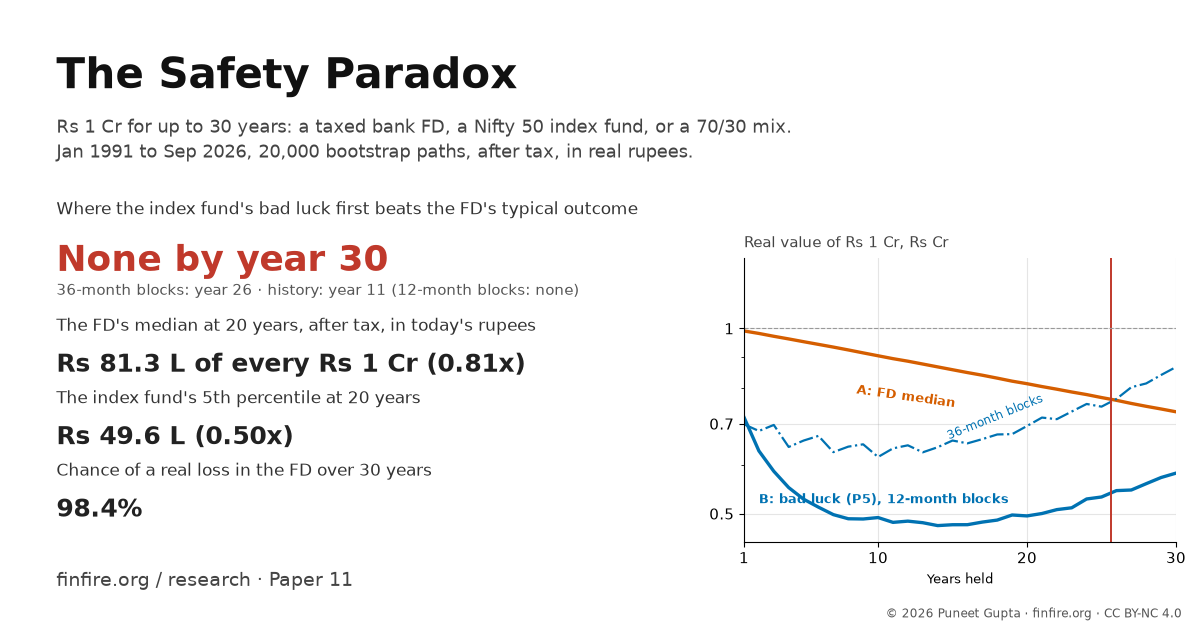
In one minute
The most common view in Indian investing circles is that a bank fixed deposit (FD) is risk-free investment, v/s the equity is the risky one. We tested it with numbers. We followed ₹1 Cr for 1 to 30 years in three places: a bank FD with its interest taxed at 31.2% each year, a Nifty 50 index fund, and a 70/30 mix of the two. Every result is after tax and after Indian inflation, in terms of the money at the starting day.
What we found:
- A taxed FD loses buying power, and over long stretches it almost always does. Its median outcome is 0.90× of the start after 10 years, 0.81× after 20 and 0.73× after 30. The chance that it ends below ₹1 Cr in real terms is 89.2% at 10 years, 96.1% at 20 and 98.4% at 30. From year 18, even its best 5% ends below ₹1 Cr.
- The tax turns a thin gain into a loss. Before tax, the FD pays 7.66% a year and inflation takes 6.38%, so it keeps 1.28% a year. The tax is charged on the whole 7.66% and takes 2.32%. That leaves −1.04% a year. With no tax on the FD, its median would be 1.14× at 10 years, 1.29× at 20 and 1.47× at 30.
- The index fund's chance of a loss falls with time. The size of its bad outcome does not. Its chance of ending below ₹1 Cr in real terms falls from 40.6% at 1 year to 23.9% at 10, 15.9% at 20 and 10.4% at 30. Its median is 1.72×, 3.10× and 5.90×. But its worst 5% ends at 0.49×, 0.50× and 0.58× of the start after 10, 20 and 30 years.
- Our starting guess was wrong on timing. We expected the index fund's bad luck (its 5th percentile) to pass the FD's typical outcome (its median) at about year 9 to 12. In our base case (12-month blocks) it does not happen within 30 years. With longer simulation blocks (36 months) it happens in year 26. In the actual Indian windows it happens in year 11, but those windows hold only about 1.2 independent 30-year stretches.
- The 70/30 mix sits in between. Its median is 3.71× at 30 years, its worst 5% is 0.77×, and its chance of ending below ₹1 Cr is 8.6%. The yearly rebalancing tax costs it 5.5 to 23.4 basis points a year.
The short version: After tax and inflation, a bank FD is a slow and almost certain loss of buying power, about 1% a year in our data. An index fund is a wide range of outcomes, with a lower chance of a loss but a possible deep one. Its yearly swings do fade with time. The year in which its bad luck beats the FD's typical result is not 9 to 12. In our base case it is beyond 30. It moves with the FD's tax, with the way we simulate time and with the years of data we use.
*
1. The question
The myth is simple: a fixed deposit is risk-free, and equity is the risky one.
In rupees, it is half right. A bank FD does not fall in value (bank failure aside), and equity can fall sharply. But rupees are not what you spend. You spend what they buy. Two things work on an FD's buying power. Inflation makes each rupee buy less. Tax is charged on the interest before inflation is taken out.
The writer and investor William Bernstein splits risk in two. Shallow risk is a fall in prices that later recovers. Deep risk is a permanent loss of real wealth. He argues that the two swap places as the horizon grows. Over one year, equity has large shallow risk and the FD has almost none. Over decades, the FD's slow loss can become the bigger danger. Bernstein calls the tax part of that loss "soft confiscation".
We turned this into one number we can test. For horizons of 1 to 30 years, what is the real, after-tax buying power of ₹1 Cr in (A) a taxable bank FD, (B) a Nifty 50 index fund and (C) a 70/30 mix rebalanced each year? And in which year does the index fund's bad-luck outcome (its 5th percentile) first reach the FD's typical outcome (its median)? We call that year the crossover. Before running anything, we guessed it would fall at about year 9 to 12.
Words used
| Word | Meaning |
|---|---|
| L, Cr | lakh (₹1,00,000) and crore (₹1,00,00,000) |
| FD | a bank fixed deposit, rolled each year at that year's 1-year rate |
| Index fund | a fund that copies the Nifty 50. We use the growth option: no tax until you sell |
| Shallow risk | a fall in prices that recovers |
| Deep risk | a permanent loss of real wealth |
| Real | after Indian inflation, in rupees of the day you start. "0.73×" means ₹73 of every ₹100 of starting buying power |
| Soft confiscation | tax charged on the nominal (before-inflation) interest, so tax can take more than the real interest |
| P5, P50 | the 5th percentile (1 in 20 outcomes is worse) and the median (half are better). We call P5 the "bad luck" case |
| Crossover | the first year in which the index fund's P5 is at or above the FD's P50 |
| LTCG | long-term capital gains tax: 12.5% plus 4% cess = 13% above ₹1.25 L of gain a year |
| Cess | a 4% add-on to the tax |
| FIFO | first in, first out: the oldest units are sold first |
| Bootstrap | new 30-year paths built by drawing blocks of the same history at random: simulation, not more history |
| Block | a run of 12 or 36 months in a row, taken from history and kept together |
| Window | the same journey started in a different month. Neighbouring windows overlap |
| Independent window | a stretch of history that does not overlap another. The 428 months of data hold 1.19 independent 30-year stretches |
| Basis point | one hundredth of a percentage point |
*
2. The set-up
Baseline (the same for every figure)
| Item | Value |
|---|---|
| Start | ₹1 Cr lump sum on day one. No contributions, no withdrawals |
| Horizons | Whole years, 1 to 30. Everything is sold at the end |
| Money | Real: in the money of the start date, after Indian CPI inflation |
| A · FD | Rolled once a year at that year's 1-year deposit rate (RBI series: 9.00% in Jan 1991, 12.00% at the top, 4.00% at the bottom, 6.25% now). Interest taxed at 31.2% each year |
| B · Index fund | Nifty 50 total return (dividends included) less a 0.20% yearly fee. No tax until the sale. At the sale, 13% on gains above ₹1.25 L |
| C · Mix | 70% B and 30% A, rebalanced once a year. The tax on the equity sold to rebalance is charged (FIFO, ₹1.25 L exemption each year). Buying equity from the FD side is tax-free |
| Data | 429 month ends, Jan 1991 to Sep 2026 (428 monthly returns). Nifty 50 total return from Jun 1999. Before that, the BSE Sensex price plus its dividend yield (a proxy, Feb 1991 to Jun 1999). Indian CPI. RBI deposit rates |
Three ways to build the paths
- Historical windows. The same journey started in every possible month of Indian history. There are 417 windows at 1 year and only 69 at 30 years.
- Block bootstrap (the headline). To make one 30-year path, the computer draws blocks of 12 months at random from the 428 months of history and joins them. Months inside a block stay in order and keep their link between equity, inflation and the deposit rate. We make 20,000 paths (seed 20261111). We also run 36-month blocks, which keep more of history's multi-year order, and show both side by side.
- Lognormal Monte Carlo. A standard model (lognormal returns) fitted to the same months, with 20,000 paths.
Assumptions and method
- ₹1 Cr lump sum; no contributions or withdrawals; 1 to 30 years; all sold at the end. Real = after Indian CPI, in rupees of the start date.
- FD: the RBI 1-year deposit rate series, rolled once a year; interest taxed at 31.2% each year (30% slab + 4% cess).
- Index fund: Nifty 50 total return less 0.20% a year; LTCG 13% above ₹1.25 L (12.5% + 4% cess) at the sale. 70/30 mix rebalanced once a year, the tax on the equity sold charged.
- Data: Nifty 50 TRI from Jun 1999; Sensex price plus dividend yield before that (a proxy); IMF CPI (CPI-IW to Nov 2011, CPI Combined after); RBI deposit rates (end-March, straight line between).
- Today's tax rules on every year, including past years. Not modelled: surcharge in the base, TDS, exit loads, deposit-insurance limits.
- Base case: 20,000 bootstrap paths of 12-month blocks, seed 20261111, from 428 months of history.
*
3. What ₹1 Cr becomes
Figure 1 shows 20,000 simulated paths for each portfolio, in today's money, held for 1 to 30 years. The light band runs from P5 to P95. The dark band runs from P25 to P75. The line is the median.
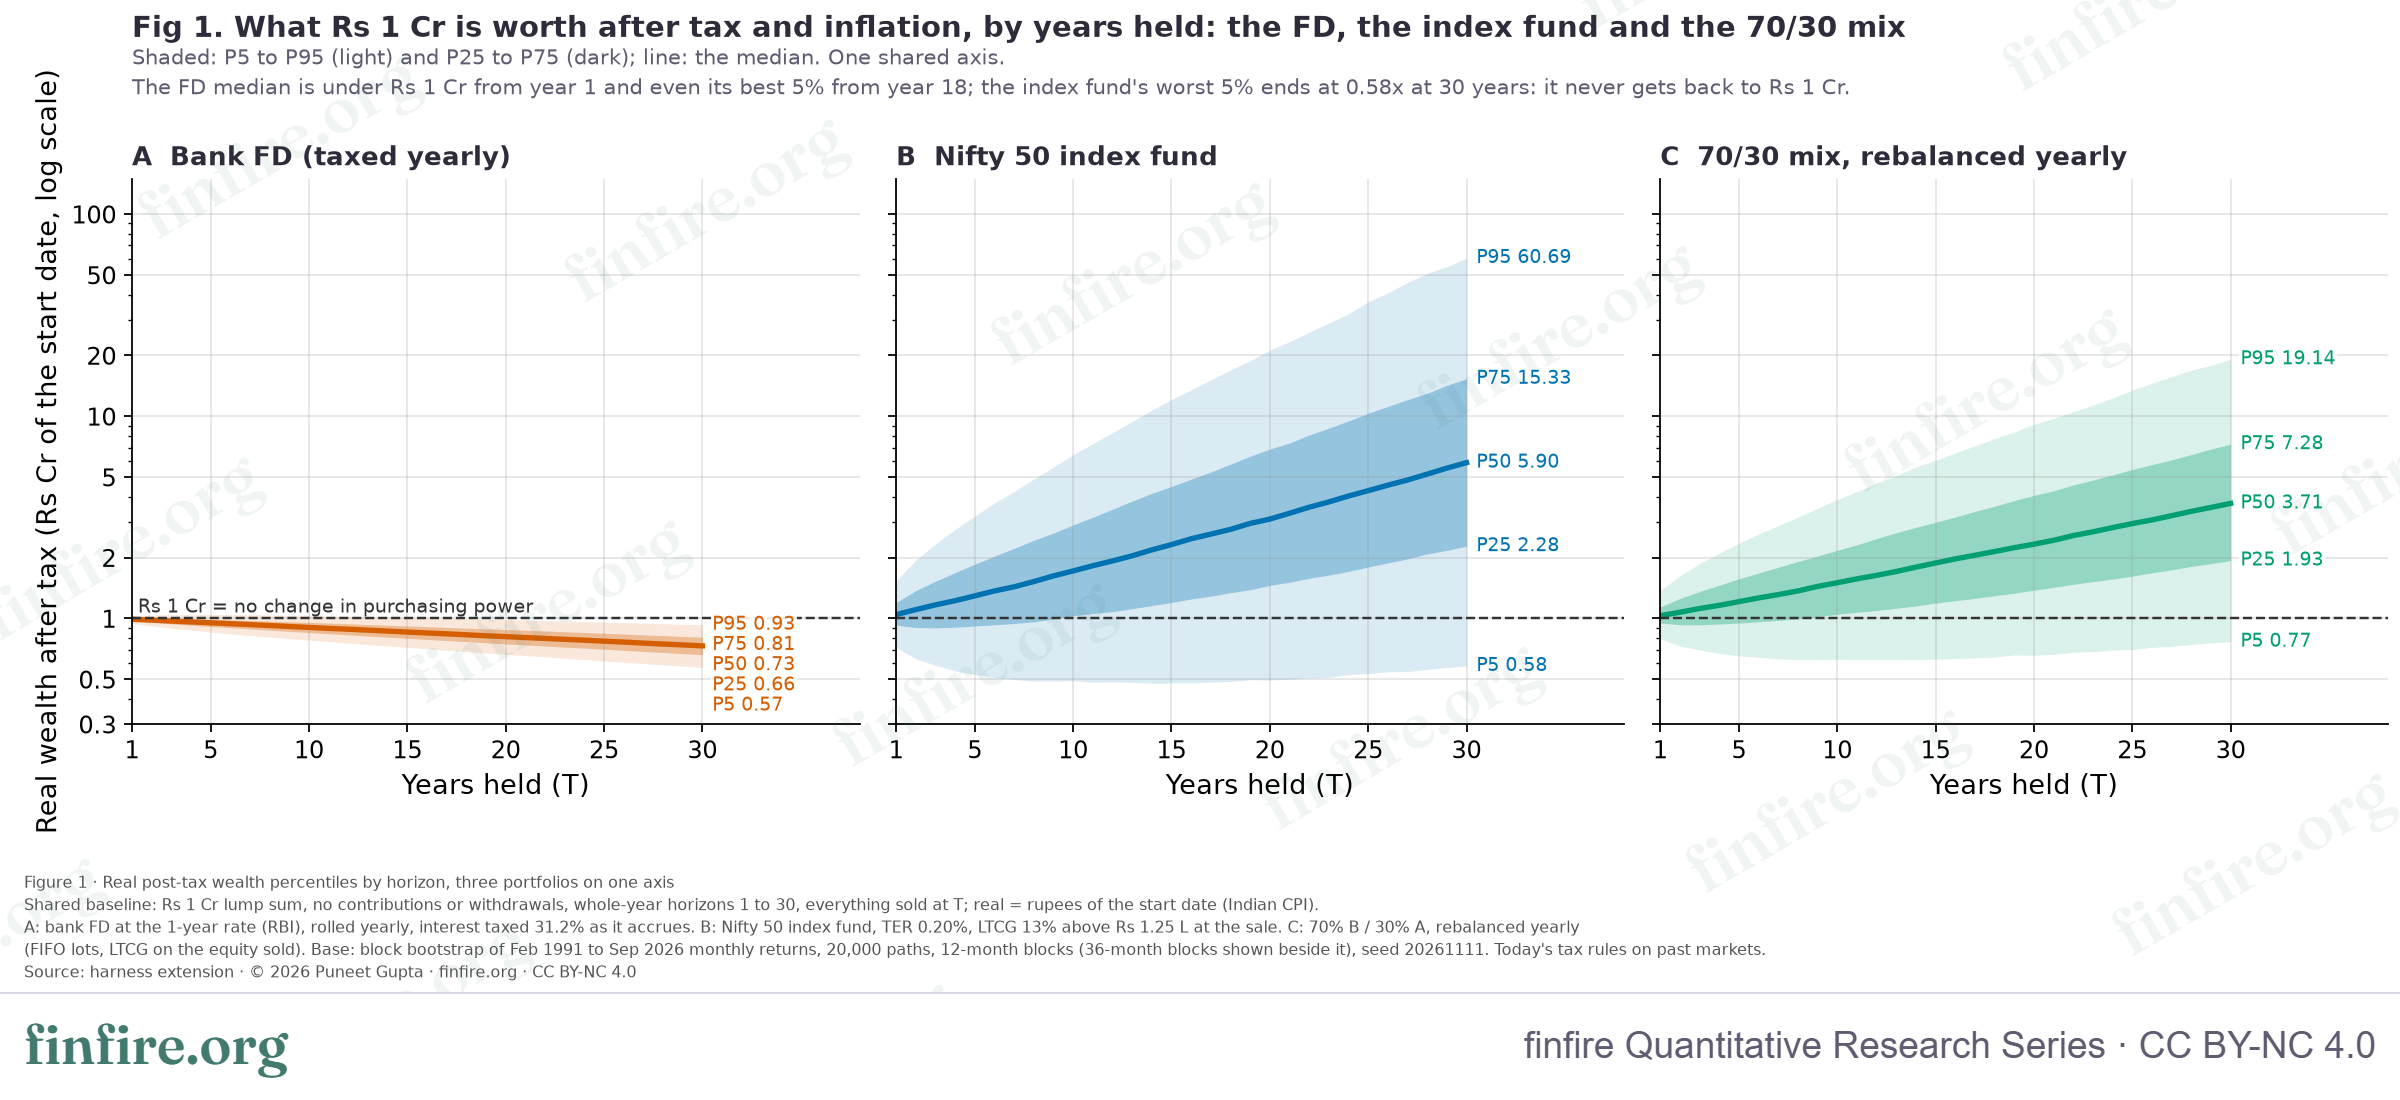
charts/fig1_fan_charts_data.csv.The FD's band is narrow and slopes down. Its median is below ₹1 Cr from year 1, and even its best 5% is below ₹1 Cr from year 18. The index fund's band is wide and slopes up. At 30 years its median is ₹5.90 Cr and its P95 is ₹60.69 Cr, but its P5 is ₹58.2 L. The mix sits between them: P5 ₹76.7 L, median ₹3.71 Cr, P95 ₹19.14 Cr.
The median real return tells the same story. The index fund's is 5.56% a year at 10 years, 5.82% at 20 and 6.09% at 30. The FD's is −1.02%, −1.03% and −1.03%.
Table 1 · What ₹1 Cr becomes (real, after tax; block bootstrap, 20,000 paths)
| Years held | Portfolio | Median | P5 | P95 | Std dev | Chance real < ₹1 Cr |
|---|---|---|---|---|---|---|
| 1 | A · FD | ₹99.0 L | ₹94.6 L | ₹1.03 Cr | ₹2.6 L | 63.2% |
| 1 | B · Index fund | ₹1.04 Cr | ₹71.7 L | ₹1.54 Cr | ₹27.2 L | 40.6% |
| 1 | C · 70/30 mix | ₹1.03 Cr | ₹79.5 L | ₹1.37 Cr | ₹19.0 L | 41.6% |
| 5 | A · FD | ₹95.2 L | ₹85.7 L | ₹1.05 Cr | ₹5.7 L | 80.4% |
| 5 | B · Index fund | ₹1.29 Cr | ₹52.8 L | ₹3.21 Cr | ₹94.4 L | 31.0% |
| 5 | C · 70/30 mix | ₹1.21 Cr | ₹65.4 L | ₹2.35 Cr | ₹56.3 L | 29.9% |
| 10 | A · FD | ₹90.3 L | ₹78.1 L | ₹1.03 Cr | ₹7.7 L | 89.2% |
| 10 | B · Index fund | ₹1.72 Cr | ₹49.3 L | ₹6.47 Cr | ₹2.29 Cr | 23.9% |
| 10 | C · 70/30 mix | ₹1.50 Cr | ₹62.9 L | ₹3.88 Cr | ₹1.12 Cr | 22.2% |
| 20 | A · FD | ₹81.3 L | ₹66.4 L | ₹98.6 L | ₹9.9 L | 96.1% |
| 20 | B · Index fund | ₹3.10 Cr | ₹49.6 L | ₹21.25 Cr | ₹11.01 Cr | 15.9% |
| 20 | C · 70/30 mix | ₹2.33 Cr | ₹65.8 L | ₹9.13 Cr | ₹3.37 Cr | 13.8% |
| 30 | A · FD | ₹73.2 L | ₹57.2 L | ₹93.1 L | ₹10.9 L | 98.4% |
| 30 | B · Index fund | ₹5.90 Cr | ₹58.2 L | ₹60.69 Cr | ₹43.93 Cr | 10.4% |
| 30 | C · 70/30 mix | ₹3.71 Cr | ₹76.7 L | ₹19.14 Cr | ₹8.58 Cr | 8.6% |
The full table, with all three methods and more statistics, is in Appendix A1. The file data/t1_all_horizons.csv has every horizon from 1 to 30 years.
*
4. The risk inversion horizon
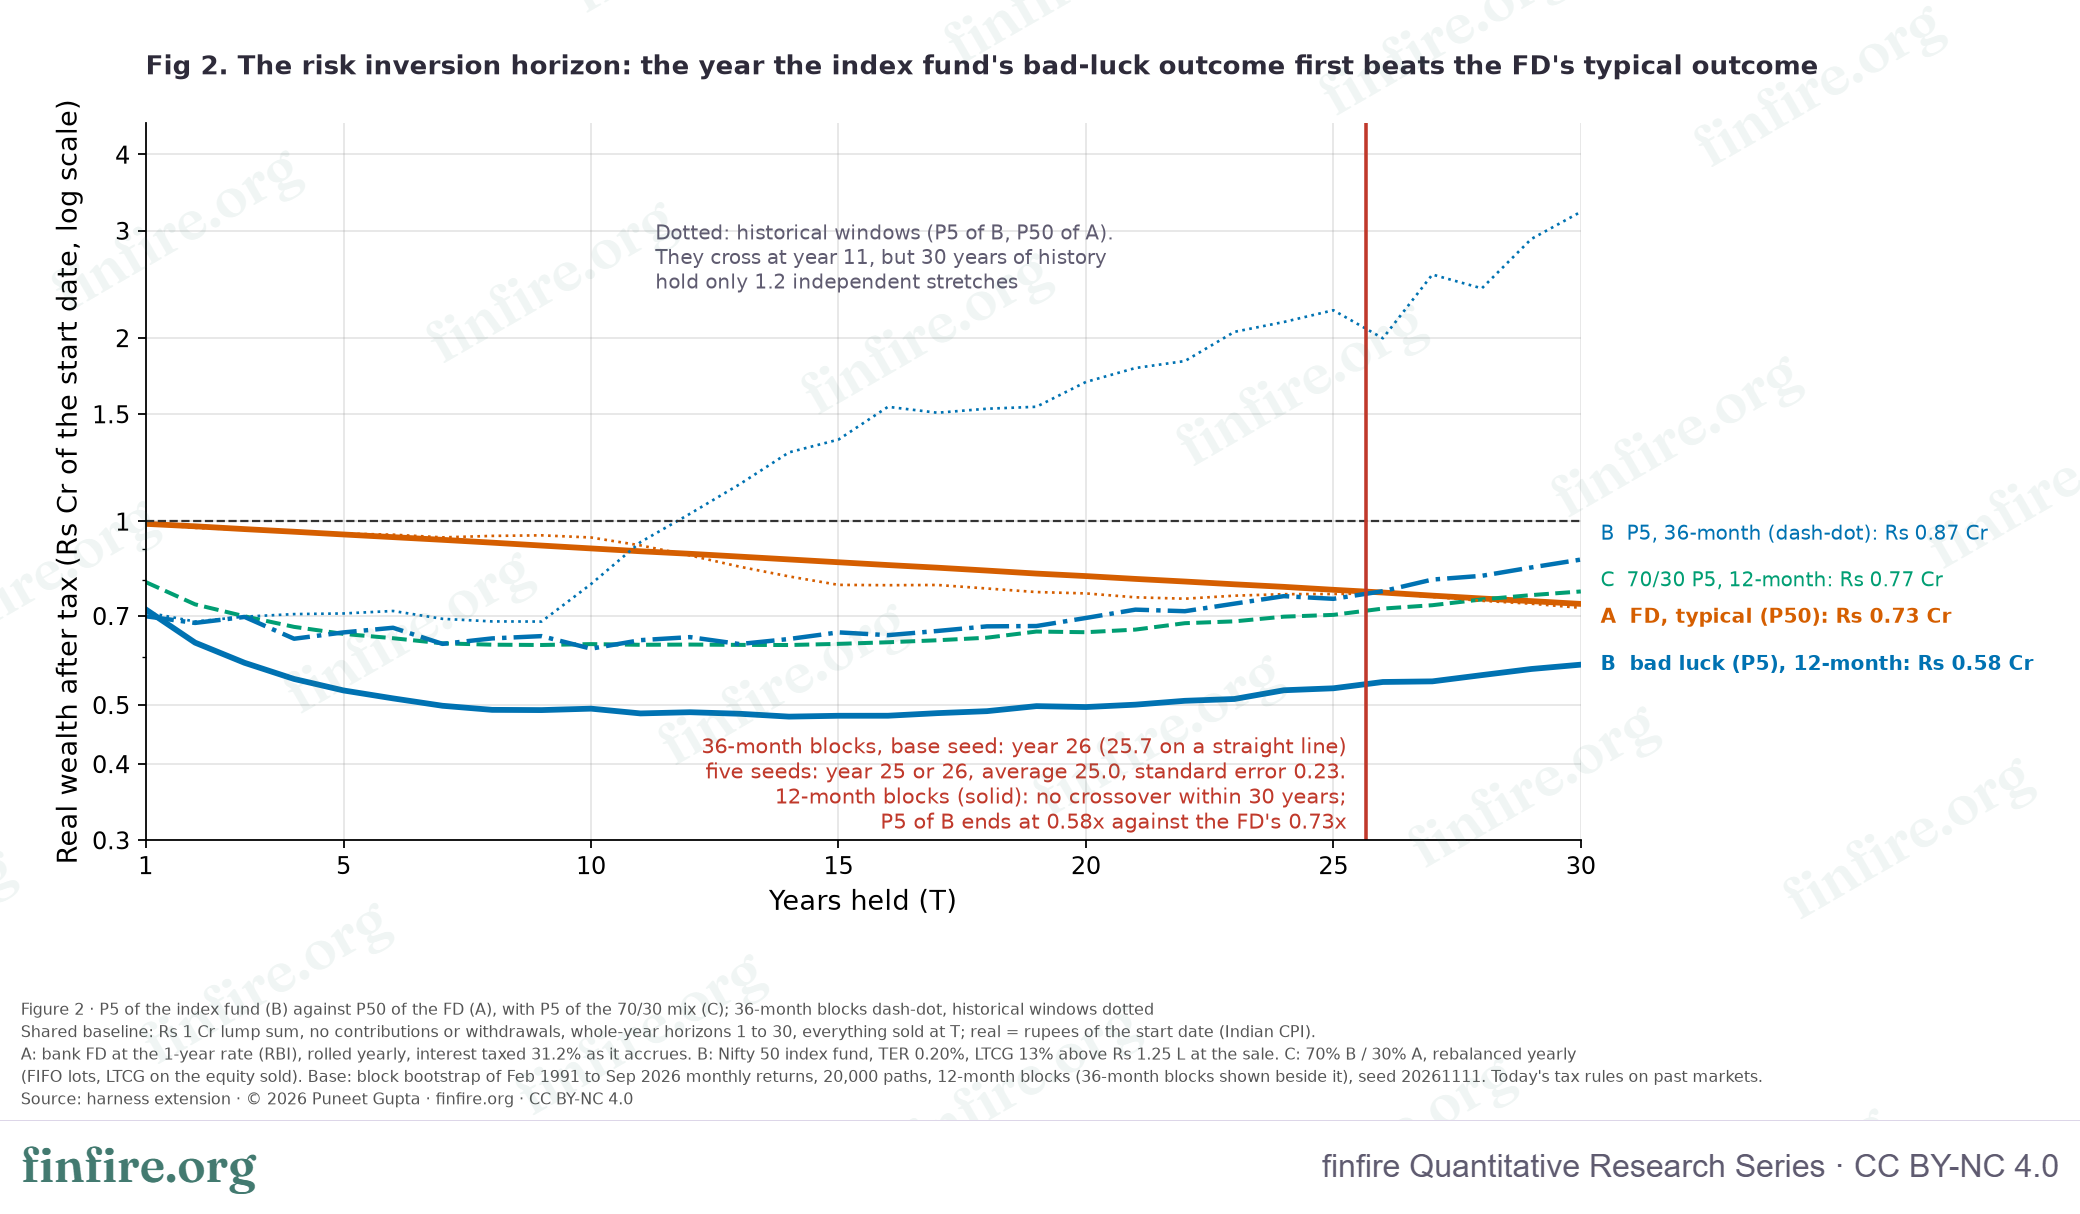
Figure 2 draws two lines against each other. One is the index fund's bad-luck outcome (P5 of B). The other is the FD's typical outcome (P50 of A). Where the first reaches the second, an investor with the index fund's bad luck ends up with at least as much buying power as an investor with the FD's typical result. That is the crossover.
charts/fig2_risk_inversion_data.csv.We read the crossover three ways:
- (a) The first year in which P5 of B is at or above P50 of A. This is the headline.
- (b) The first year from which it stays true in every later year up to 30. This guards against a one-year blip.
- (c) The first year in which the chance that the index fund ends below the FD is 10% or less (and 5% or less). This asks how often, not how bad.
Table 2 · The crossover by method (first year, out of 30)
| Run | (a) First year P5(B) ≥ P50(A) | (b) Holds in every later year | (c) Chance B < A is 10% or less | (c) 5% or less | P5(B) ≥ P25(A) | P5(B) ≥ P5(A) | P5(C) ≥ P50(A) |
|---|---|---|---|---|---|---|---|
| Historical windows, monthly starts (417) | 11 | 11 | 11 | 12 | 11 | 10 | 11 |
| Block bootstrap, 12-month blocks (base) | none | none | 23 | none | none | 30 | 29 |
| Block bootstrap, 36-month blocks (V5, beside the base) | 26 | 26 | 17 | 26 | 23 | 18 | 20 |
| Lognormal Monte Carlo | none | none | 19 | none | 27 | 22 | 26 |
Base case (12-month blocks). There is no crossover. At 30 years, P5 of the index fund is ₹58.2 L (0.58×) and P50 of the FD is ₹73.2 L (0.73×). The index fund's P5 is lowest at 10 to 20 years (₹49.3 L and ₹49.6 L) and then climbs slowly. The chance that the index fund ends below the FD falls to 6.9% at 30 years. It is 10% or less from year 23.
36-month blocks. The crossover is year 26 (25.7 on a straight line). The chance that the index fund ends below the FD is 10% or less from year 17.
Historical windows. The crossover is year 11. But 30 years of history hold only about 1.2 independent stretches (Section 7), so this is closer to one story than to a trend.
Lognormal model. No crossover within 30 years.
Seeds. A simulation depends on its random seed. We repeated both block lengths with four more seeds (Table A3). With 12-month blocks, none of the five seeds shows a crossover. The year in which the chance of B ending below A reaches 10% is 23 or 24 (average 23.4, standard error 0.24). With 36-month blocks, the first year is 26 in three seeds and 25 in two. The straight-line figure averages 25.0 (standard error 0.23); the base seed gives 25.7. So read the 36-month result as year 25 to 26.
The mix. The 70/30 mix is the one portfolio whose bad luck beats the FD's typical outcome inside 30 years in the base case. It only just does. It happens in year 29 in the base seed and two others, and in year 30 in the other two. With 36-month blocks it is year 20 in all five seeds.
*
5. Shallow risk and deep risk
Figure 3 splits risk into three measures. They do not all say the same thing.
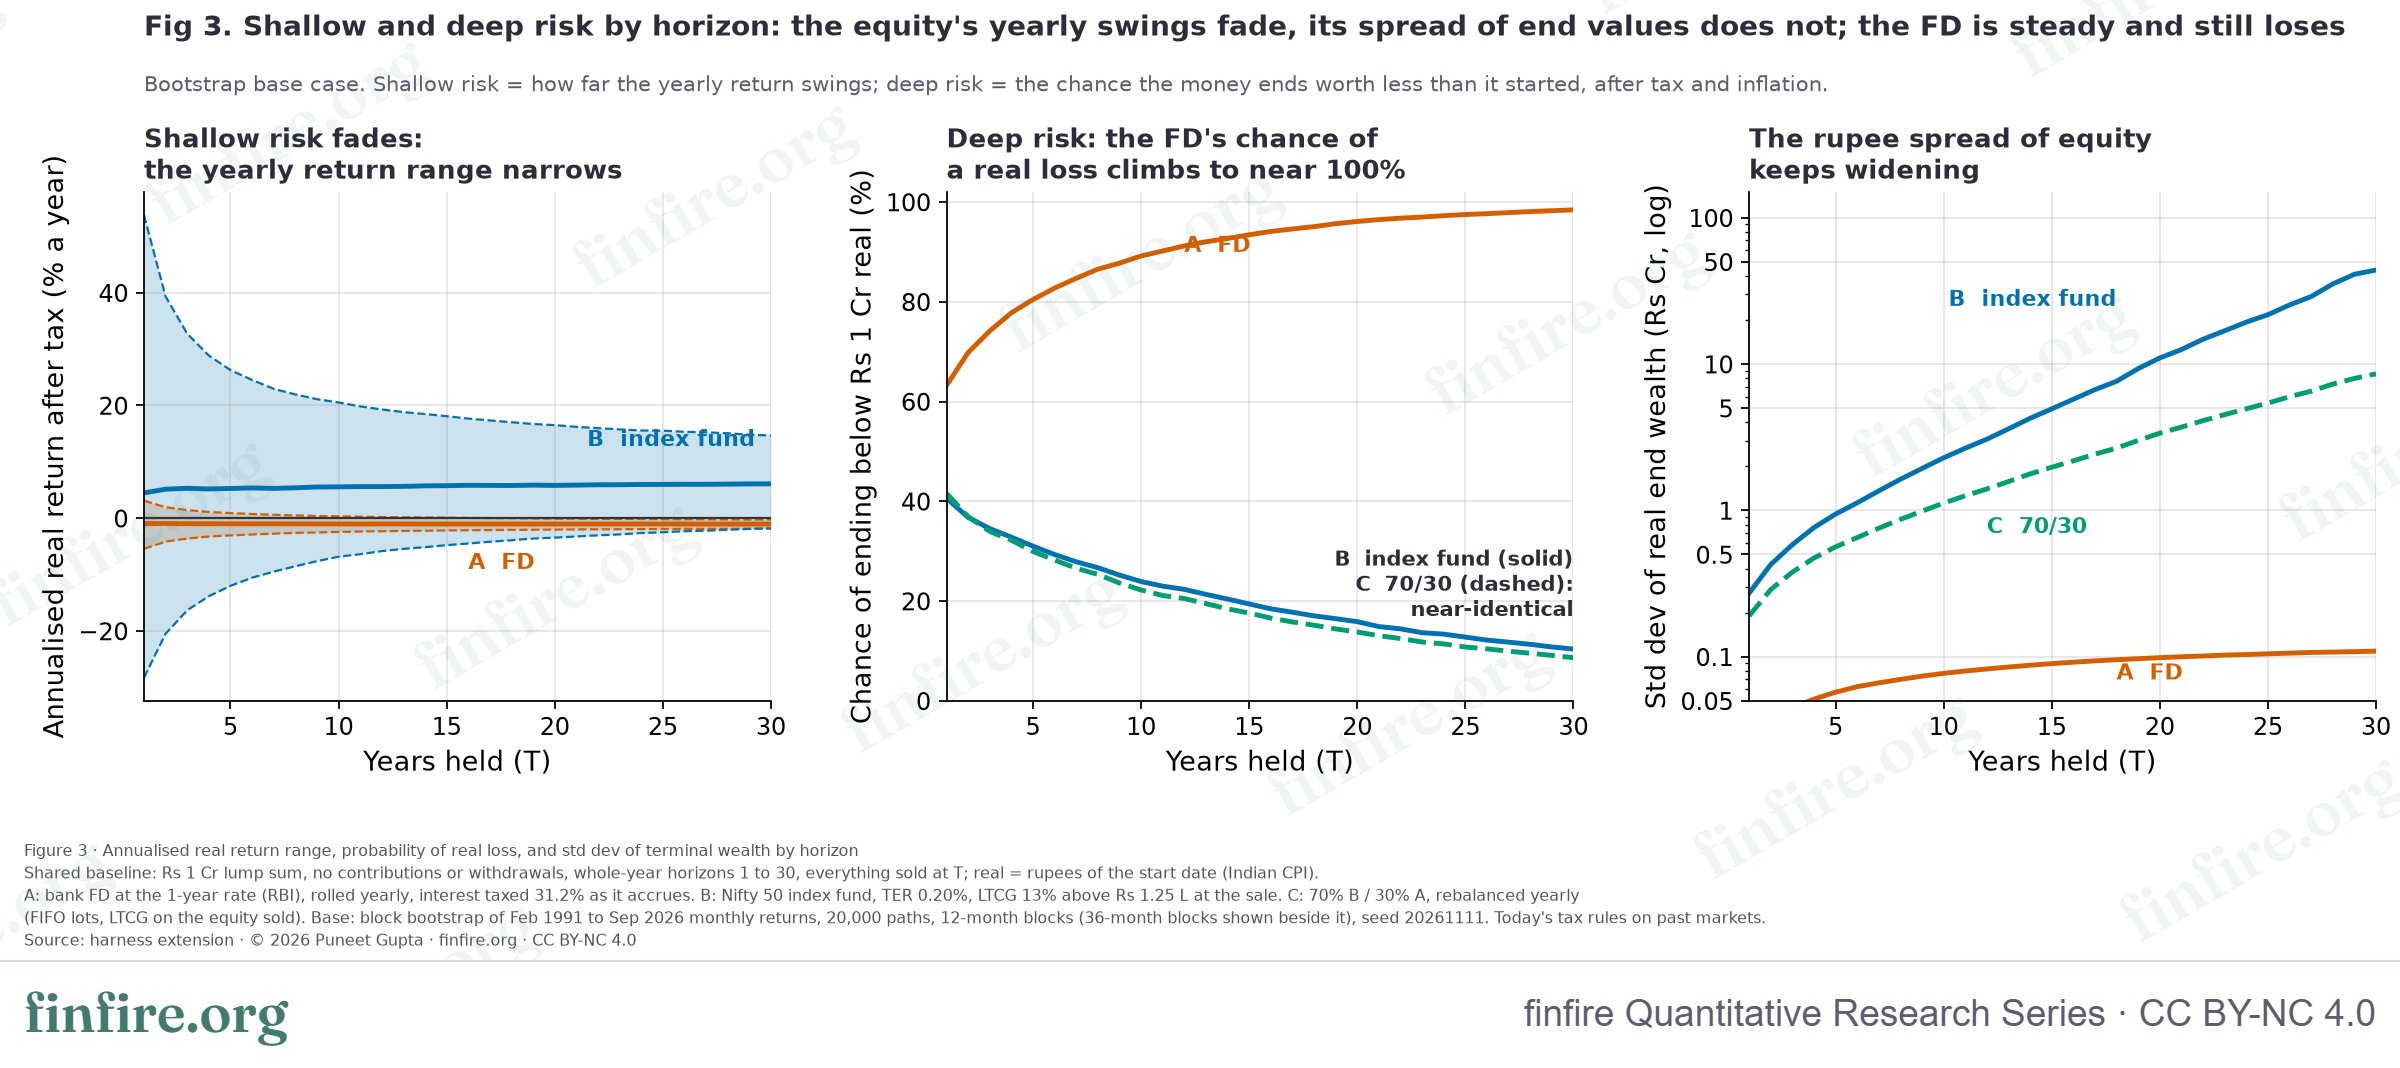
charts/fig3_shallow_vs_deep_data.csv.Yearly swings fade (shallow risk). At 1 year, the P5-to-P95 range of the index fund's real return is −28.28% to 53.76%. At 10 years it is −6.83% to 20.53%, at 20 years −3.45% to 16.51% and at 30 years −1.79% to 14.67%. The FD's range at 30 years is −1.84% to −0.24%. Even its best 5% loses real value.
The chance of a real loss (deep risk). The FD's chance of ending below ₹1 Cr in real terms is 63.2% at 1 year, 89.2% at 10, 96.1% at 20 and 98.4% at 30. The index fund's is 40.6%, 23.9%, 15.9% and 10.4%. The mix's is 41.6%, 22.2%, 13.8% and 8.6%. By this measure the FD is already the likelier loser at 1 year. But at 1 year the loss is small: the FD's median is ₹99.0 L.
The rupee spread does not narrow. The standard deviation of the index fund's end wealth is ₹27.2 L at 1 year, ₹2.29 Cr at 10, ₹11.01 Cr at 20 and ₹43.93 Cr at 30. The FD's is ₹2.6 L, ₹7.7 L, ₹9.9 L and ₹10.9 L. Measured this way, the index fund is riskier at every horizon and more so each year. The risk flip does not show here. Standard deviation counts a large gain as risk, which is one reason it grows so fast, so we also look at the downside.
The index fund's deep risk does not vanish. The chance of ending below half the starting buying power (₹50 L) is 5.2% at 10 years, 5.1% at 20 and 4.0% at 30. For the FD it is 0.0%, 0.0% and 0.5%. For the mix it is 1.9%, 2.1% and 1.9%.
Put together: the FD is a very likely small loss that adds up. The index fund is a lower chance of a loss, with a small chance of a large one. The risk Bernstein describes is real on two of the three measures. But the point where the index fund's bad luck passes the FD's typical outcome comes much later than we guessed.
*
6. Where the FD's money goes
An FD is safe in rupees. The question is what the rupees buy.
Over the 428 months of data, a 12-month FD paid on average 7.66% a year before tax. Inflation averaged 6.38%. So before tax the FD kept 1.28% a year above inflation. Then comes the tax. It is charged on the interest, all 7.66%, not on the 1.28% that is left after inflation. At 31.2%, it takes 2.32% a year. That is more than the real gain it is taken from. What is left is −1.04% a year. This is soft confiscation in numbers.
The loss is the same at 10, 20 and 30 years because it is a yearly average.
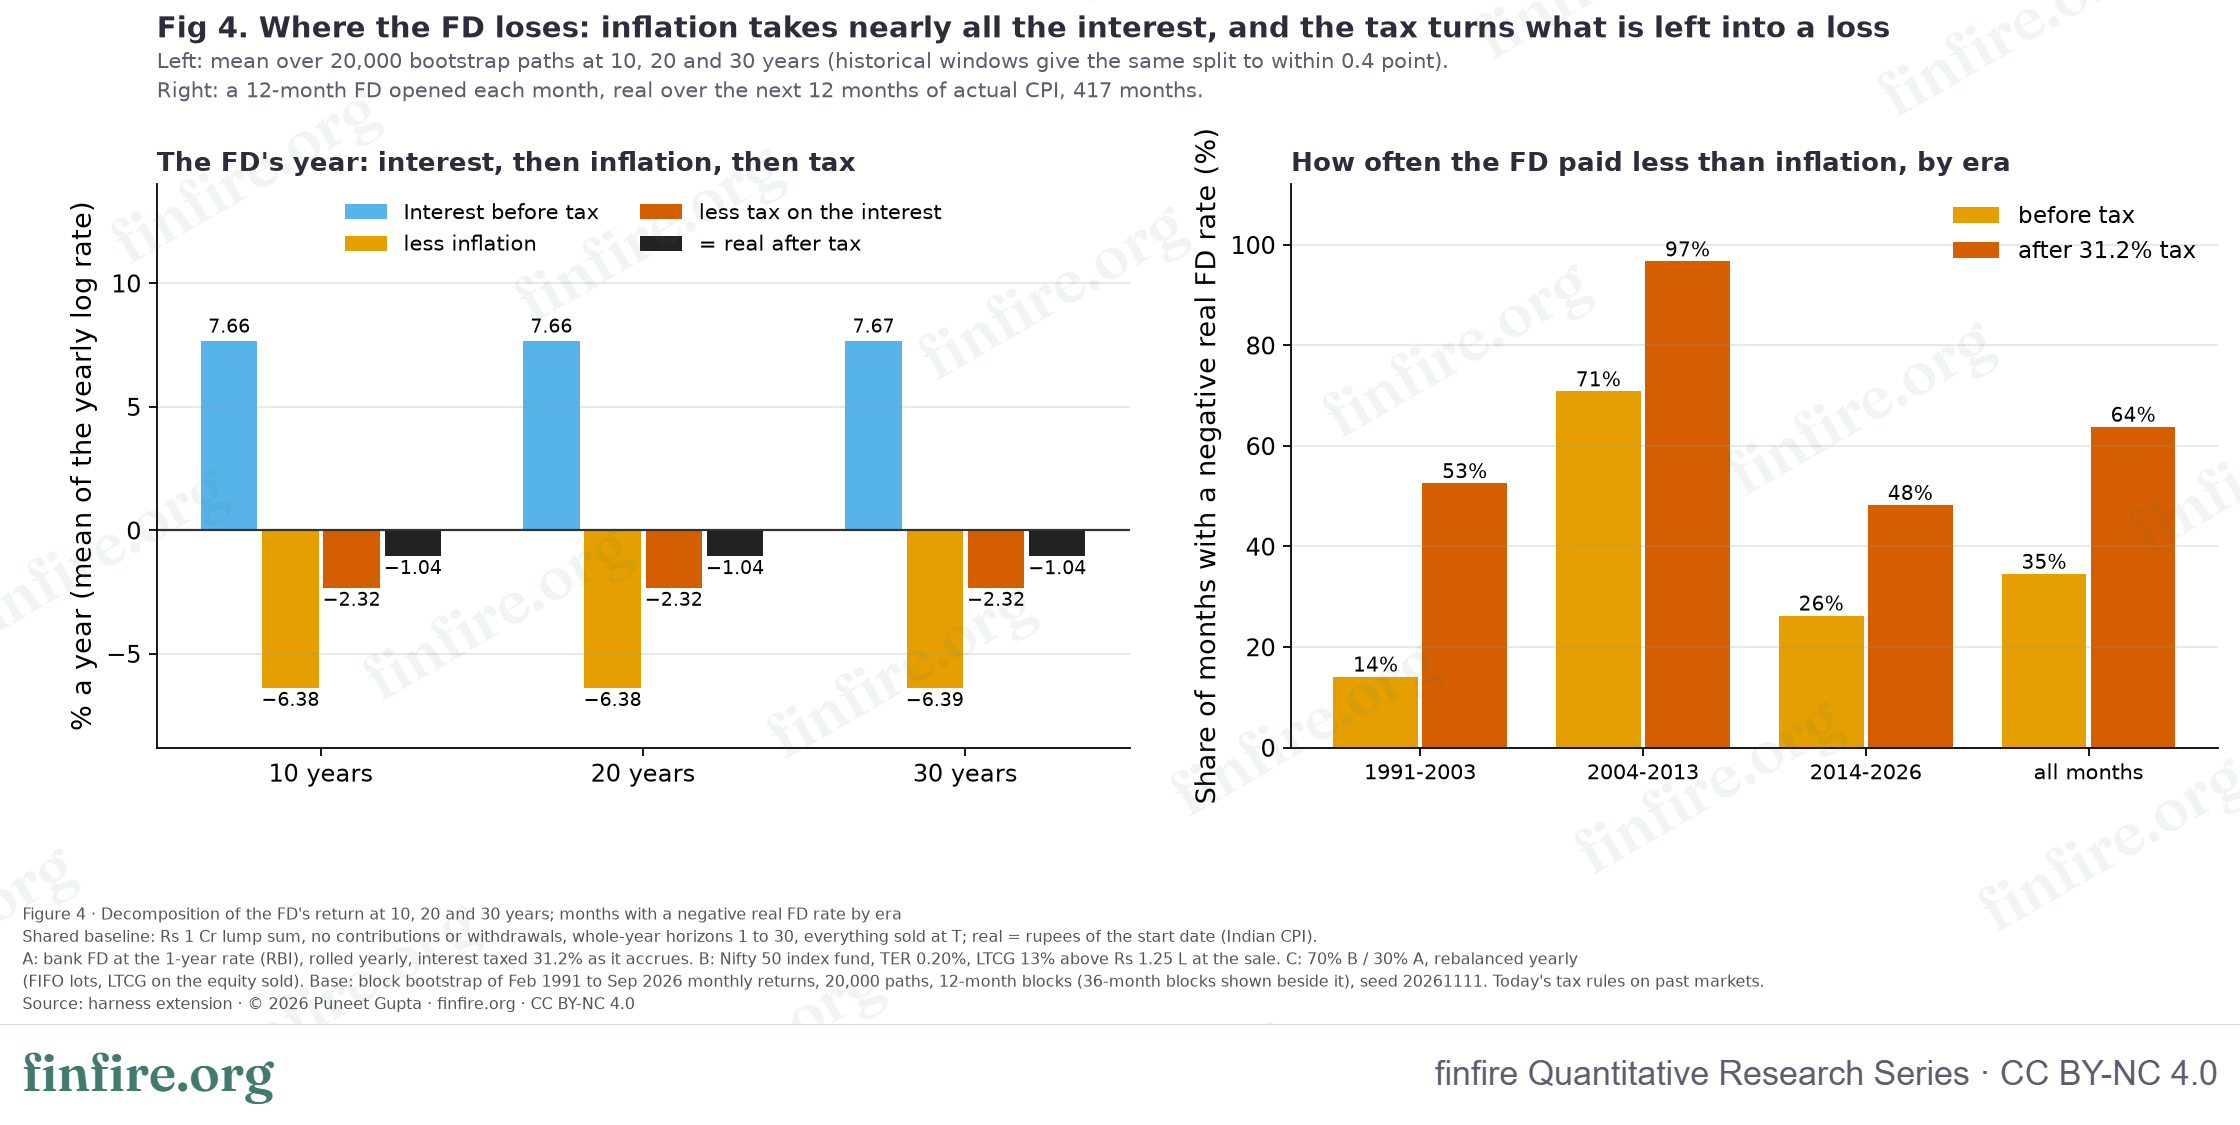
charts/fig4_where_the_fd_loses_data.csv.Table 3 · The FD's year: interest, inflation, tax (average yearly rates)
| Method | Years held | Paths or windows | Interest before tax (nominal) | less inflation | real before tax | less tax | real after tax |
|---|---|---|---|---|---|---|---|
| Block bootstrap | 10 | 20000 | 7.66% | 6.38% | 1.29% | 2.32% | −1.04% |
| Block bootstrap | 20 | 20000 | 7.66% | 6.38% | 1.28% | 2.32% | −1.04% |
| Block bootstrap | 30 | 20000 | 7.67% | 6.39% | 1.28% | 2.32% | −1.04% |
| Historical windows | 10 | 309 | 7.48% | 6.27% | 1.21% | 2.27% | −1.06% |
| Historical windows | 20 | 189 | 7.38% | 6.50% | 0.88% | 2.24% | −1.36% |
| Historical windows | 30 | 69 | 7.57% | 6.34% | 1.23% | 2.30% | −1.07% |
These are average continuously compounded yearly rates, so they differ a little from the compound rates the calculator uses (its base inflation is 6.6%). Historical windows give the same split as the bootstrap to within about 0.4 of a percentage point on every line.
How often did the FD pay less than inflation? Table 4 counts months, by era. A 12-month FD opened in a given month is compared with the next 12 months of inflation.
Table 4 · Months in which the FD paid less than inflation
| Era | Months | Negative real rate, before tax | after 31.2% tax | Mean real rate before tax | after tax |
|---|---|---|---|---|---|
| 1991-2003 | 156 | 14.1% | 52.6% | 2.59% | −0.26% |
| 2004-2013 | 120 | 70.8% | 96.7% | −0.83% | −2.94% |
| 2014-2026 | 141 | 26.2% | 48.2% | 1.77% | −0.18% |
| pre-2014 (all) | 276 | 38.8% | 71.7% | 1.10% | −1.42% |
| post-2014 (all) | 141 | 26.2% | 48.2% | 1.77% | −0.18% |
| all months | 417 | 34.5% | 63.8% | 1.33% | −1.00% |
Before tax, the FD paid less than inflation in 34.5% of months. After tax, it did so in 63.8%. The worst era was 2004 to 2013: 70.8% of months before tax and 96.7% after. In no era did the average after-tax real rate turn positive. It was −0.26% in 1991 to 2003, −2.94% in 2004 to 2013 and −0.18% in 2014 to 2026.
*
7. History window by window
Figure 5 shows what happened to each possible start month in Indian history. At 10 years there are 309 start months. At 20 years there are 189. Neighbouring windows overlap almost completely, so these are about 3.6 and 1.8 independent stretches.
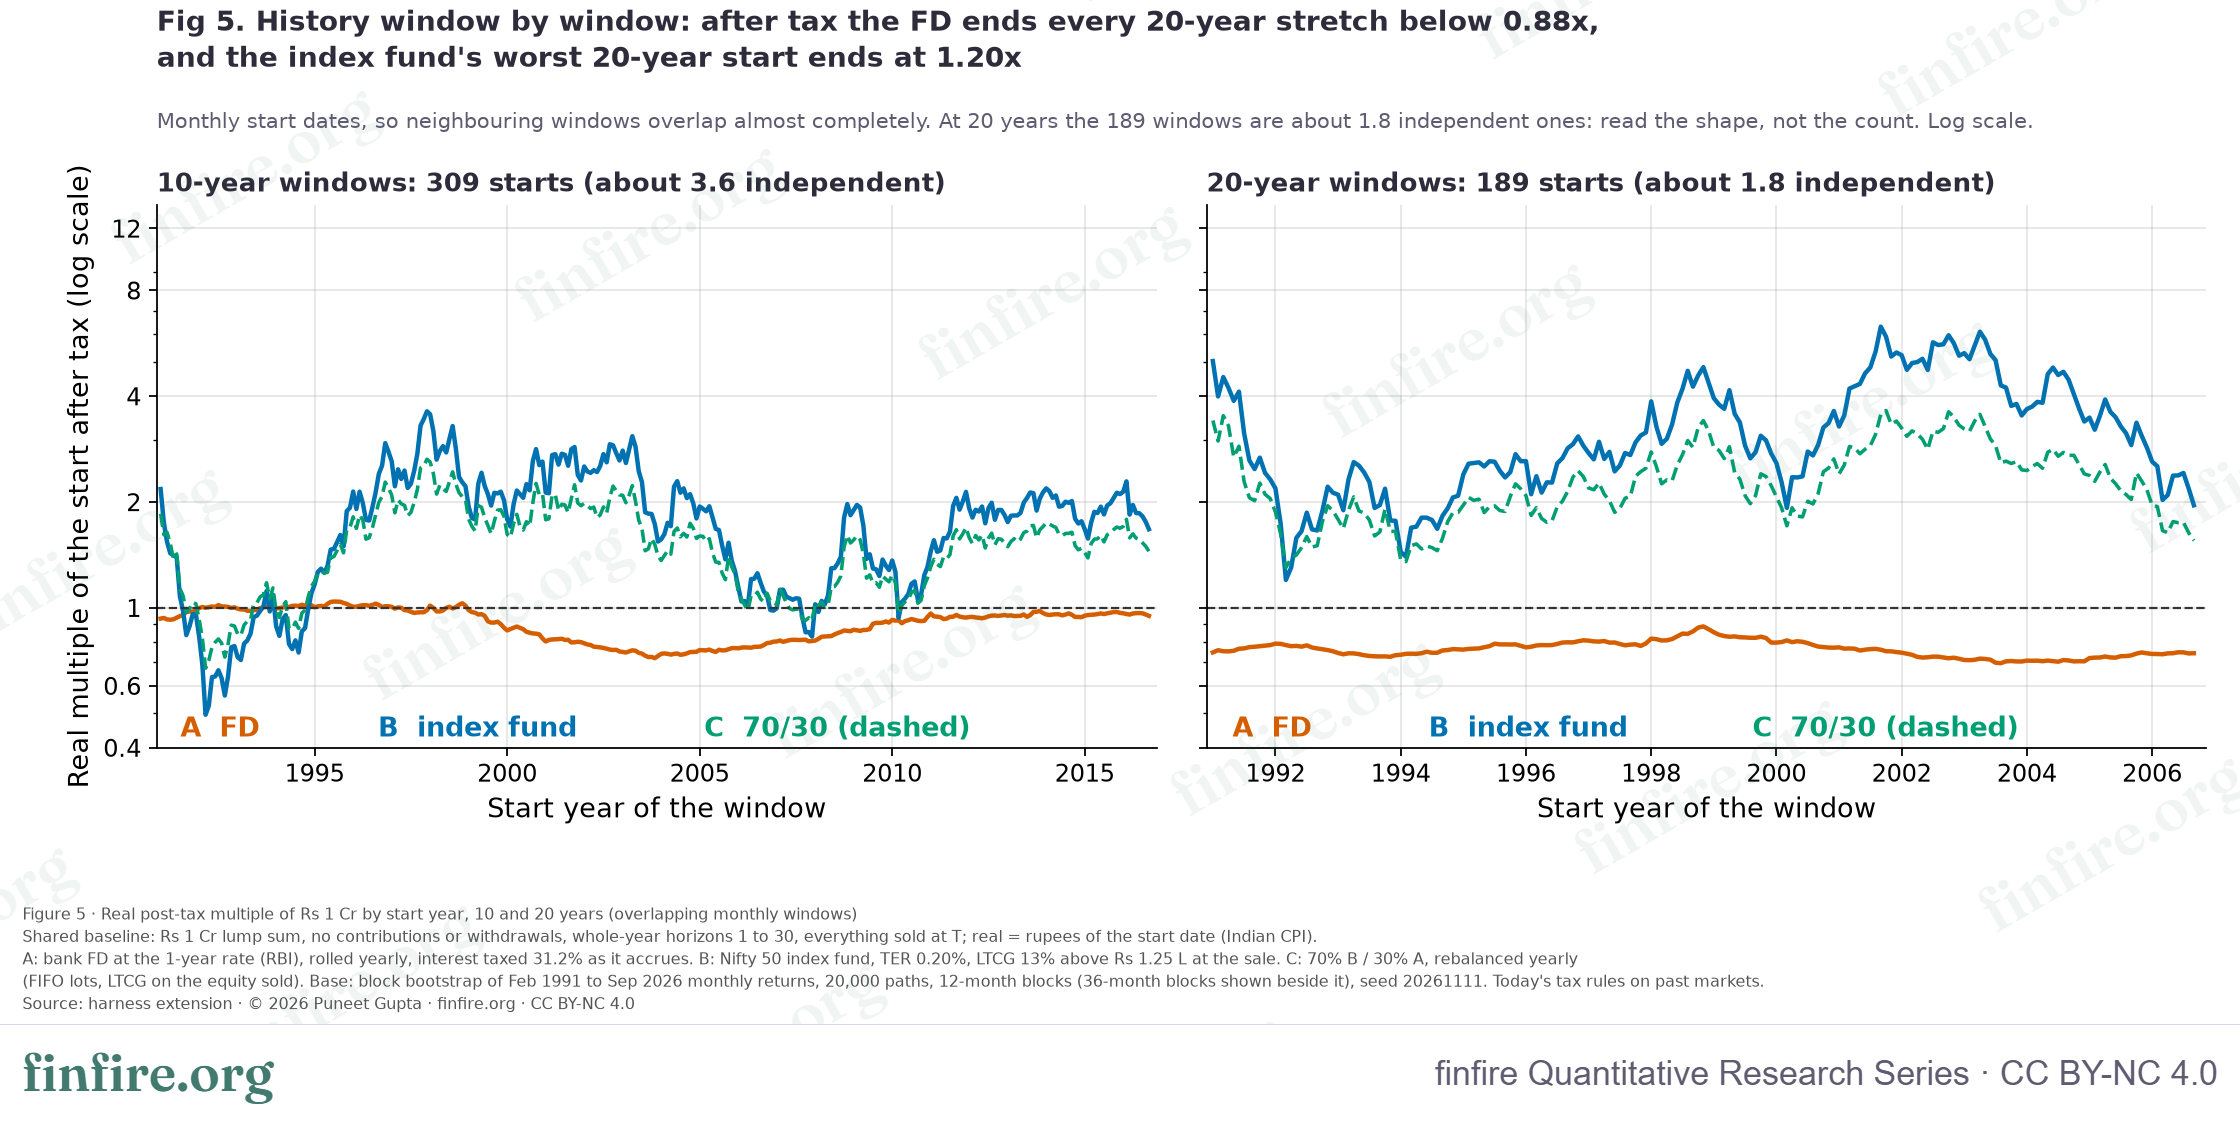
charts/fig5_historical_windows_data.csv.The FD. Every 20-year and 30-year window ended below ₹1 Cr in real terms (100.0% of 189 and of 69 windows). The best 20-year window ended at ₹88.4 L, and the best 30-year window at ₹76.4 L.
The index fund. No 20-year or 30-year window ended below ₹1 Cr. The worst 20-year start ended at ₹1.20 Cr, and the worst 30-year start at ₹2.46 Cr. At 10 years it was different: 14.9% of windows ended below ₹1 Cr, and the worst ended at ₹49.6 L.
Index fund against FD. In history, the index fund beat the FD in every 20-year and 30-year window. At 10 years, the index fund ended below the FD in 11.7% of windows. Table 6 shows where those came from.
Table 5 · How much history stands behind each horizon
| Years held | Overlapping windows | Independent windows (months of returns ÷ months per window) | Bootstrap paths |
|---|---|---|---|
| 1 | 417 | 35.67 | 20000 |
| 5 | 369 | 7.13 | 20000 |
| 10 | 309 | 3.57 | 20000 |
| 15 | 249 | 2.38 | 20000 |
| 20 | 189 | 1.78 | 20000 |
| 25 | 129 | 1.43 | 20000 |
| 30 | 69 | 1.19 | 20000 |
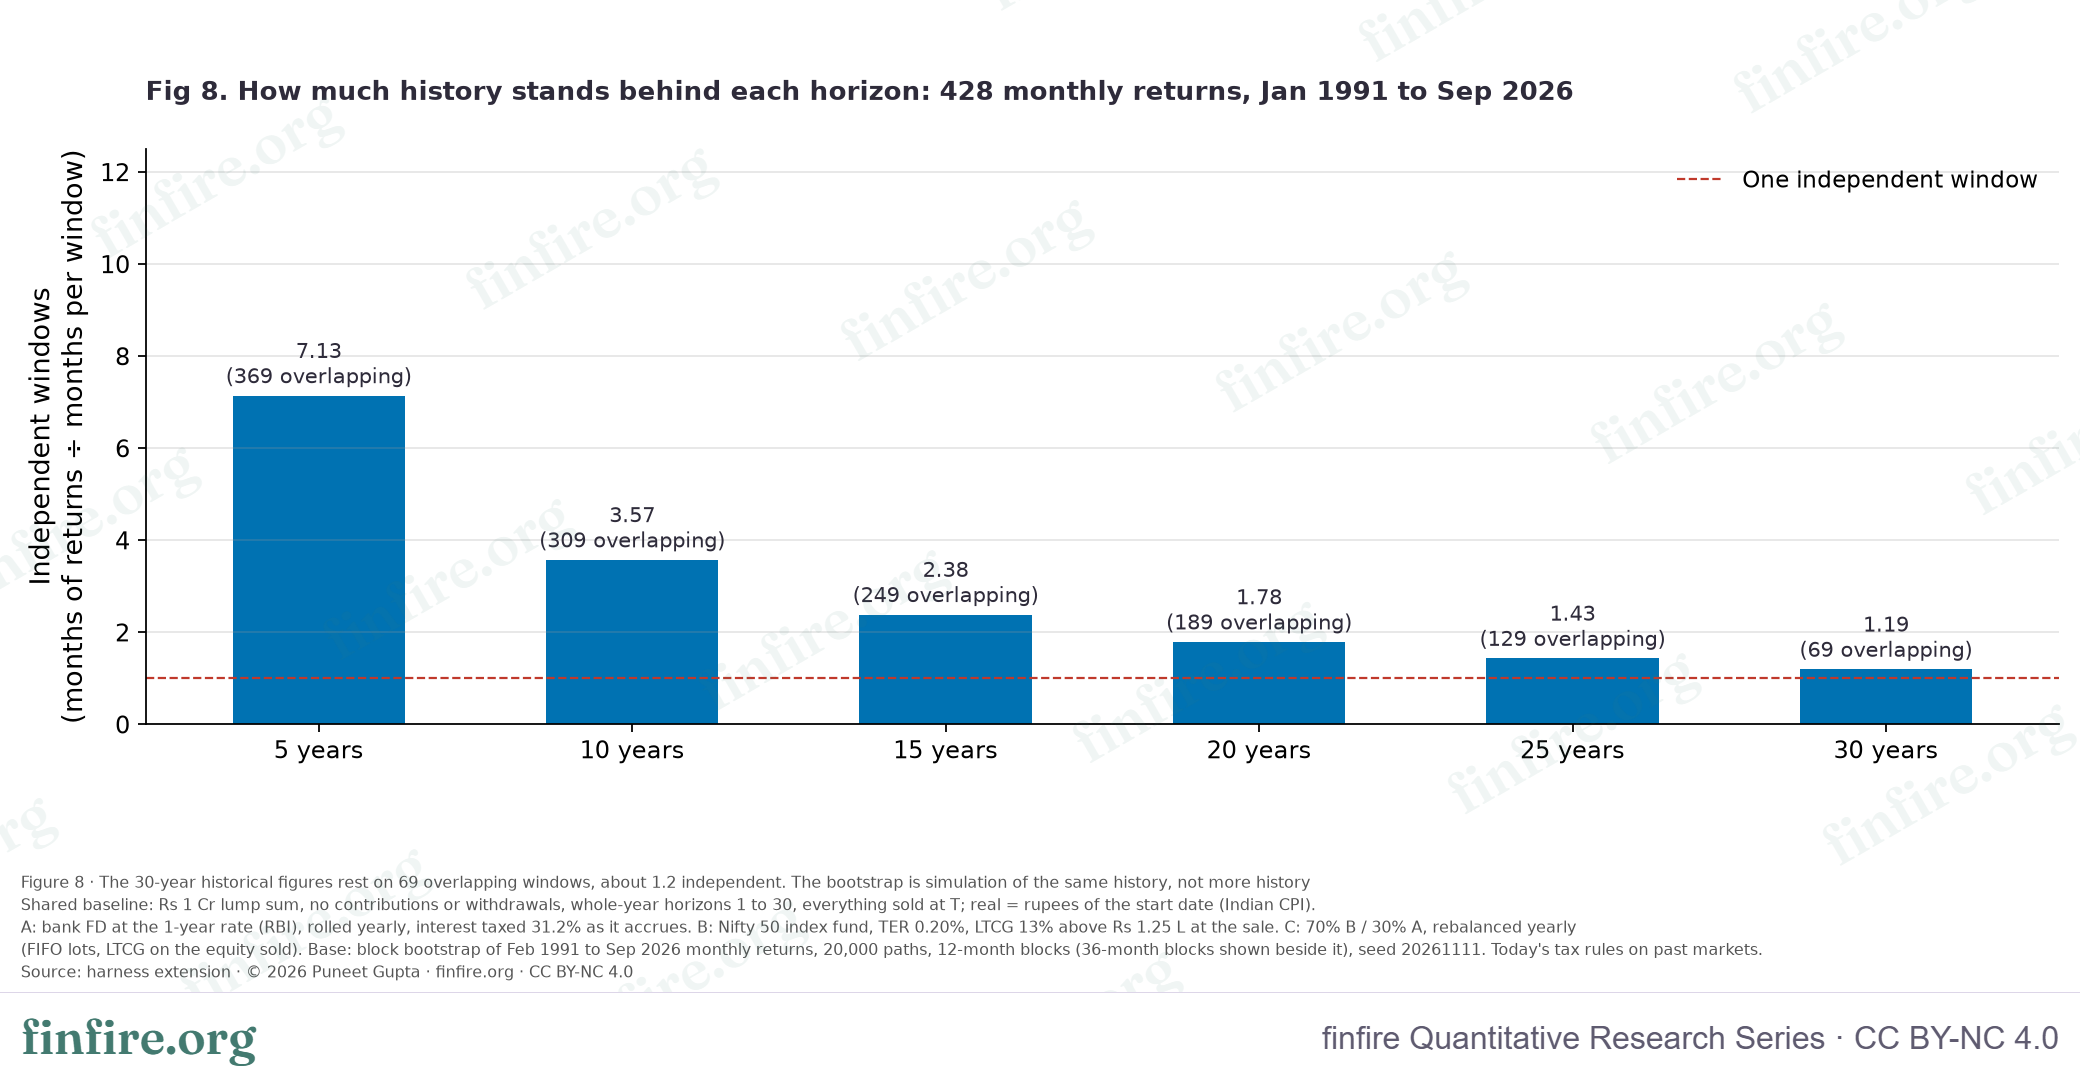
charts/fig8_sample_size_data.csv.When you see "69 windows" at 30 years, think of one history and a little more. The 20,000 bootstrap paths do not make the 30-year result 20,000 times more certain. They rebuild the same 428 months in new orders.
Table 6 · Historical windows by start decade
| Years held | Start decade | Windows | FD median real multiple | Index fund median | 70/30 median | Share of windows where the index fund ended below the FD |
|---|---|---|---|---|---|---|
| 10 | 1990s | 108 | 1.00× | 1.54× | 1.52× | 33.3% |
| 10 | 2000s | 120 | 0.80× | 1.82× | 1.53× | 0.0% |
| 10 | 2010s | 81 | 0.95× | 1.86× | 1.57× | 0.0% |
| 20 | 1990s | 108 | 0.78× | 2.59× | 2.03× | 0.0% |
| 20 | 2000s | 81 | 0.73× | 3.80× | 2.57× | 0.0% |
All the 10-year windows in which the index fund ended below the FD started in the 1990s. A third of the 1990s starts did.
History against simulation. The bootstrap's P5 at 10 years (₹49.3 L) is about as bad as the worst historical 10-year window (₹49.6 L). At 20 and 30 years the bootstrap's P5 (₹49.6 L and ₹58.2 L) is far below the worst historical window (₹1.20 Cr and ₹2.46 Cr). The simulation can join the worst blocks of history one after another. History has not run in that order. We do not know which is the better guide to the next 30 years.
*
8. What moves the crossover
Figure 6 shows the crossover year for 21 runs. In 12 of the 21 there is none within 30 years, including the base. Where there is one, it falls between year 11 and year 26 (and in year 3 for the one run that reaches only 12 years).
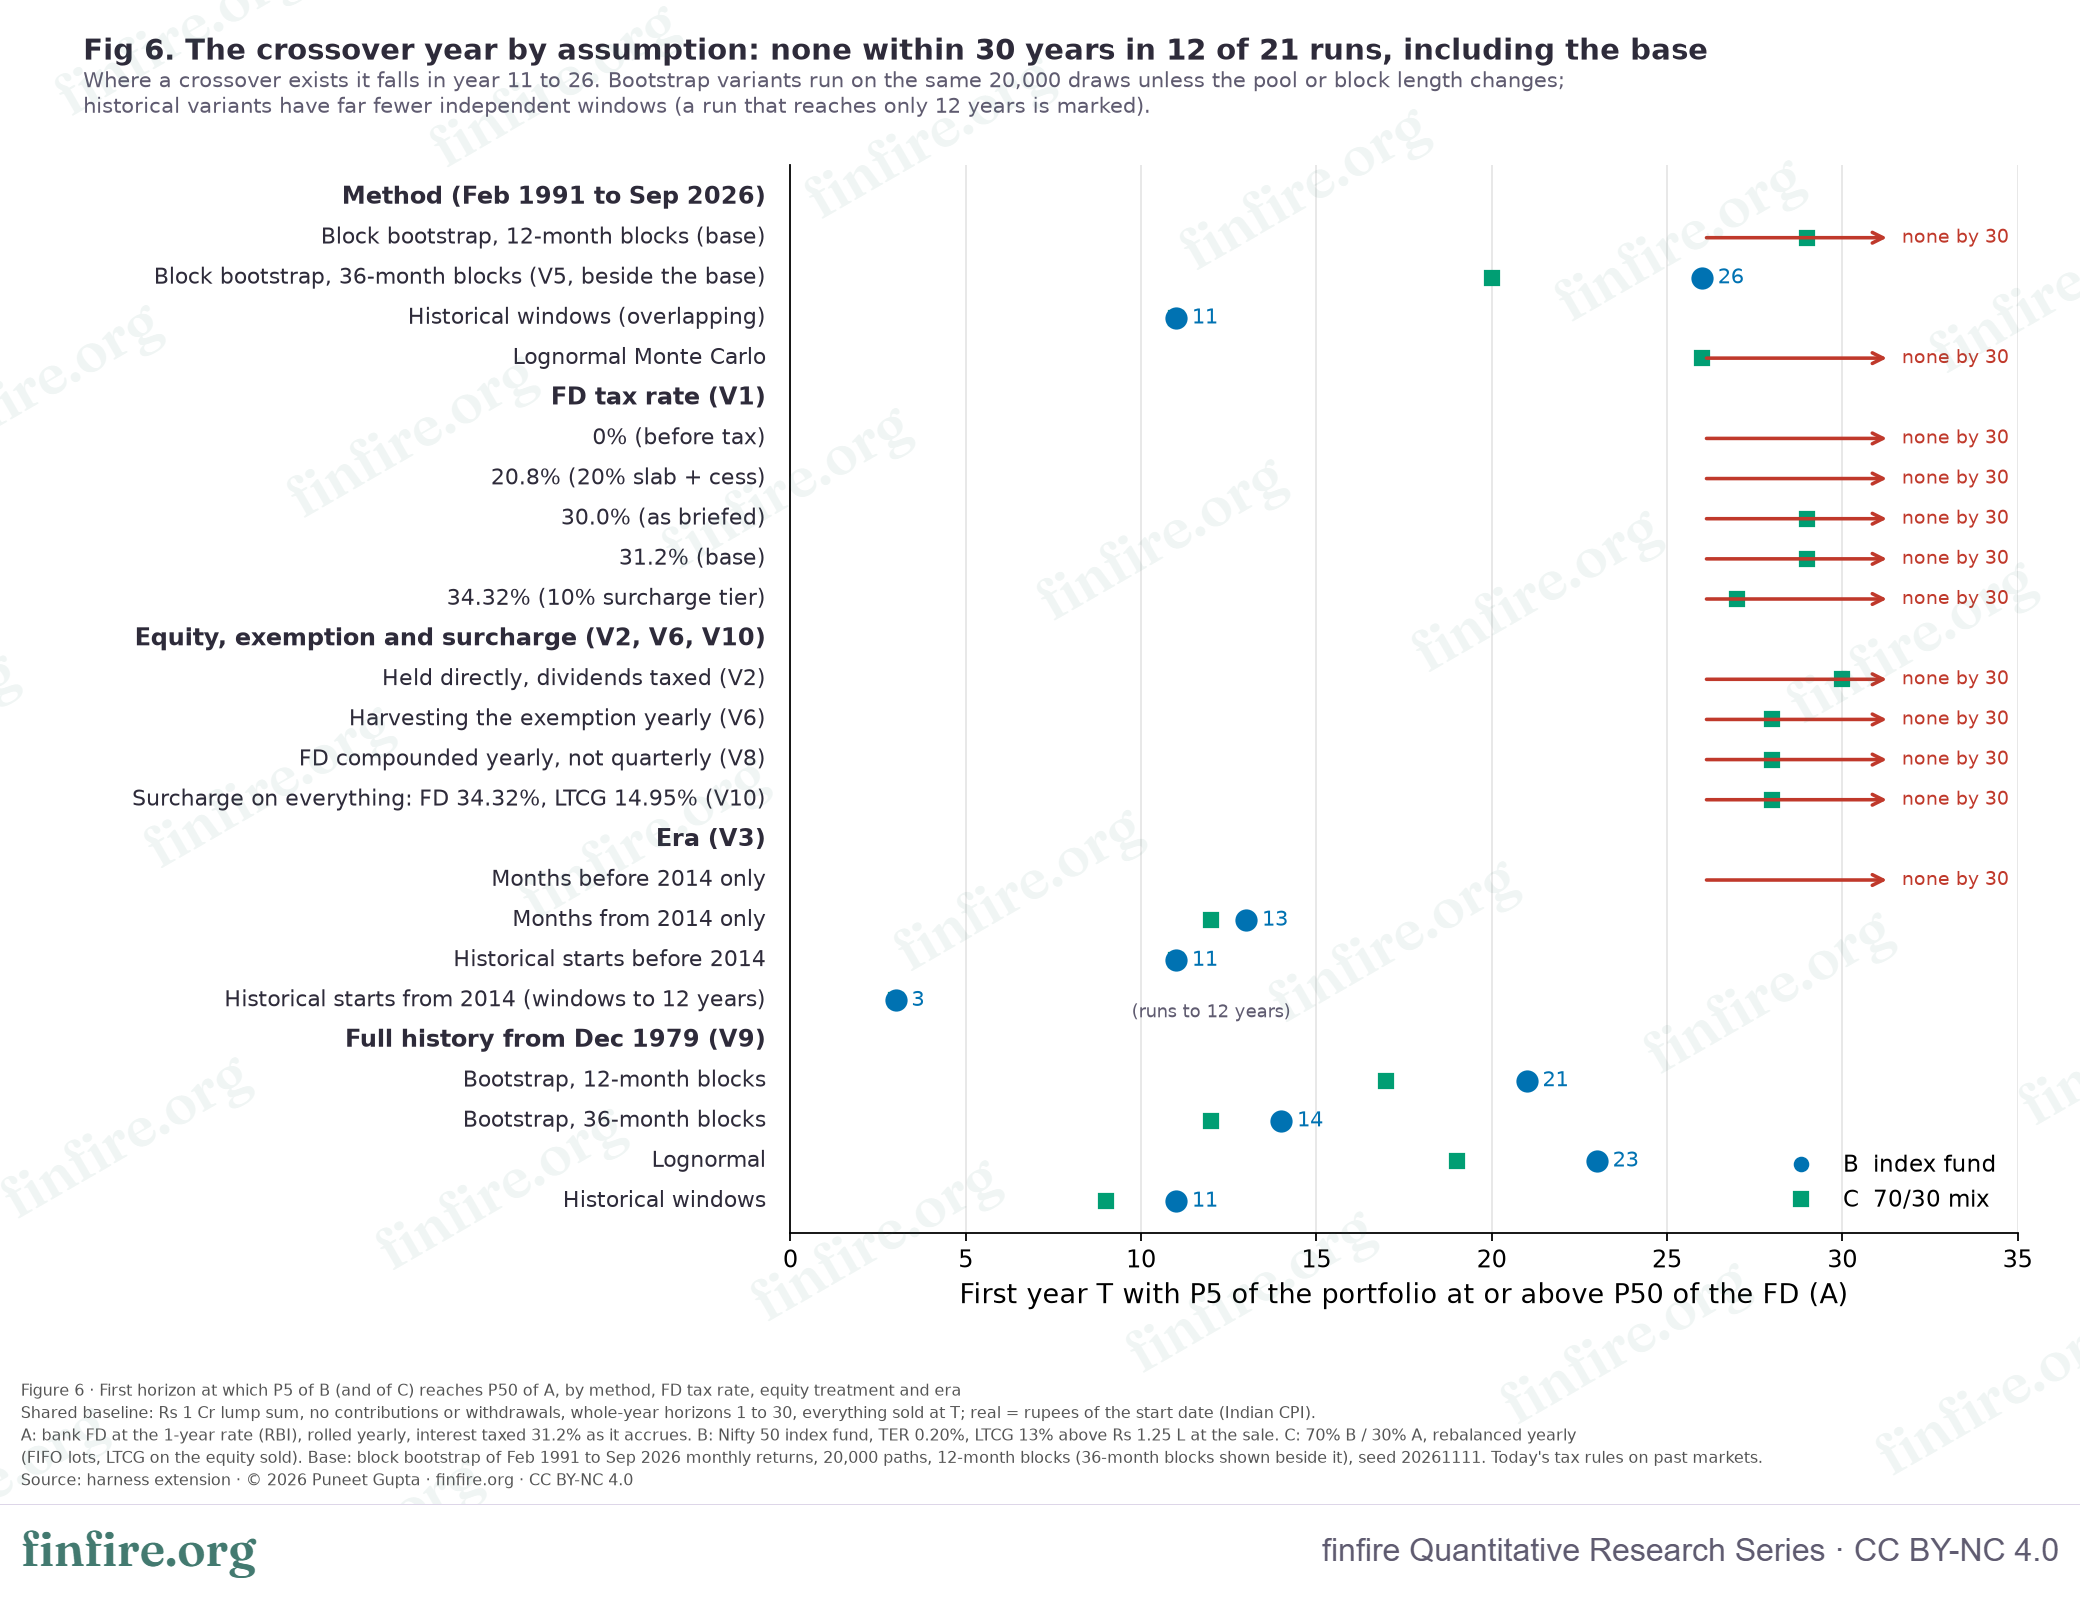
charts/fig6_crossover_by_assumption_data.csv.Table 7 gives the gap at 30 years between the index fund's bad luck (P5 of B) and the FD's median (P50 of A). A positive gap means a crossover has happened by year 30. The full table, for 10, 20 and 30 years, is Appendix A4.
Table 7 · The gap at 30 years, by assumption
| Run | P50 of A | P5 of B | P5(B) − P50(A) | Chance B < A |
|---|---|---|---|---|
| FD tax 0% (before tax) | ₹1.47 Cr | ₹58.2 L | −₹88.7 L | 16.3% |
| FD tax 20.8% (20% slab + cess) | ₹92.5 L | ₹58.2 L | −₹34.3 L | 9.5% |
| FD tax 30.0% (as first briefed, no cess) | ₹75.2 L | ₹58.2 L | −₹17.0 L | 7.2% |
| Base: FD tax 31.2%, 12-month blocks | ₹73.2 L | ₹58.2 L | −₹15.0 L | 6.9% |
| FD tax 34.32% (31.2% with the 10% surcharge tier) | ₹68.2 L | ₹58.2 L | −₹10.0 L | 6.3% |
| Equity held directly: dividends taxed each year at 31.2%, no fee (V2) | ₹73.2 L | ₹56.1 L | −₹17.1 L | 7.3% |
| Equity: harvesting the annual exemption each year (V6) | ₹73.2 L | ₹60.1 L | −₹13.1 L | 6.7% |
| FD interest compounded once a year instead of quarterly (V8) | ₹69.8 L | ₹58.2 L | −₹11.6 L | 6.5% |
| Surcharge on everything: FD 34.32%, equity LTCG 14.95% (V10, an upper bound) | ₹68.2 L | ₹57.2 L | −₹11.0 L | 6.4% |
| Only months before 2014 (V3) | ₹63.4 L | ₹31.0 L | −₹32.4 L | 11.1% |
| Only months from Jan 2014 on (V3) | ₹94.9 L | ₹1.89 Cr | +₹94.1 L | 0.5% |
| 36-month blocks (V5) | ₹72.5 L | ₹86.5 L | +₹14.0 L | 3.5% |
| Full history from Dec 1979, 12-month blocks (V9) | ₹62.4 L | ₹1.00 Cr | +₹37.6 L | 2.7% |
| Full history from Dec 1979, 36-month blocks (V9) | ₹62.7 L | ₹1.59 Cr | +₹96.5 L | 0.8% |
| Full history from Dec 1979, lognormal (V9) | ₹62.0 L | ₹92.4 L | +₹30.4 L | 2.6% |
The FD's tax. The tax is what makes the FD lose buying power. With no tax, the FD's median at 30 years is ₹1.47 Cr (1.47×). At 31.2% it is ₹73.2 L. More tax on the FD narrows the gap to the index fund's bad luck, from −₹88.7 L at 0% to −₹10.0 L at 34.32%. But even at 34.32% there is no crossover within 30 years. The tax decides whether the FD loses. By itself it does not bring the crossover inside 30 years.
How the equity is held. Holding stocks directly, harvesting the ₹1.25 L exemption each year, compounding the FD yearly, or putting the surcharge on everything moves the gap by a few lakh. None of them produces a crossover.
The years of data. Using only the months before 2014, the gap at 30 years is −₹32.4 L. Using only the months from Jan 2014 on, the crossover is year 13. That run reuses less than 13 years of history, so it says little about 30 years.
Block length. The same history and the same fund give no crossover with 12-month blocks and year 26 with 36-month blocks (year 25 to 26 across seeds). We do not know which is closer to how Indian markets behave over decades, so we show both.
The 1980s. We first ran this study from Dec 1979. The 1980–1990 years are a proxy: the Sensex price plus a flat 1.23% dividend yield. We keep them out of the base case and show them as variant V9. They matter. With them in, the crossover comes earlier: year 21 with 12-month blocks, year 14 with 36-month blocks, year 23 in the lognormal run and year 11 in the historical windows. Anyone who prefers the longer history should read the V9 rows as the answer.
So how long? No crossover within 30 years with 12-month blocks. Year 26 with 36-month blocks. Year 11 in the history alone. And with the 1980–1990 years added: year 21, 14, 23 and 11. The answer depends on three choices the data cannot settle: how much of history's order the simulation keeps, whether the 1980s are in, and what the FD pays after tax.
*
9. The 70/30 mix
Each year the mix is brought back to 70/30. Selling equity to do that creates capital gains tax. Buying equity from the FD side does not.
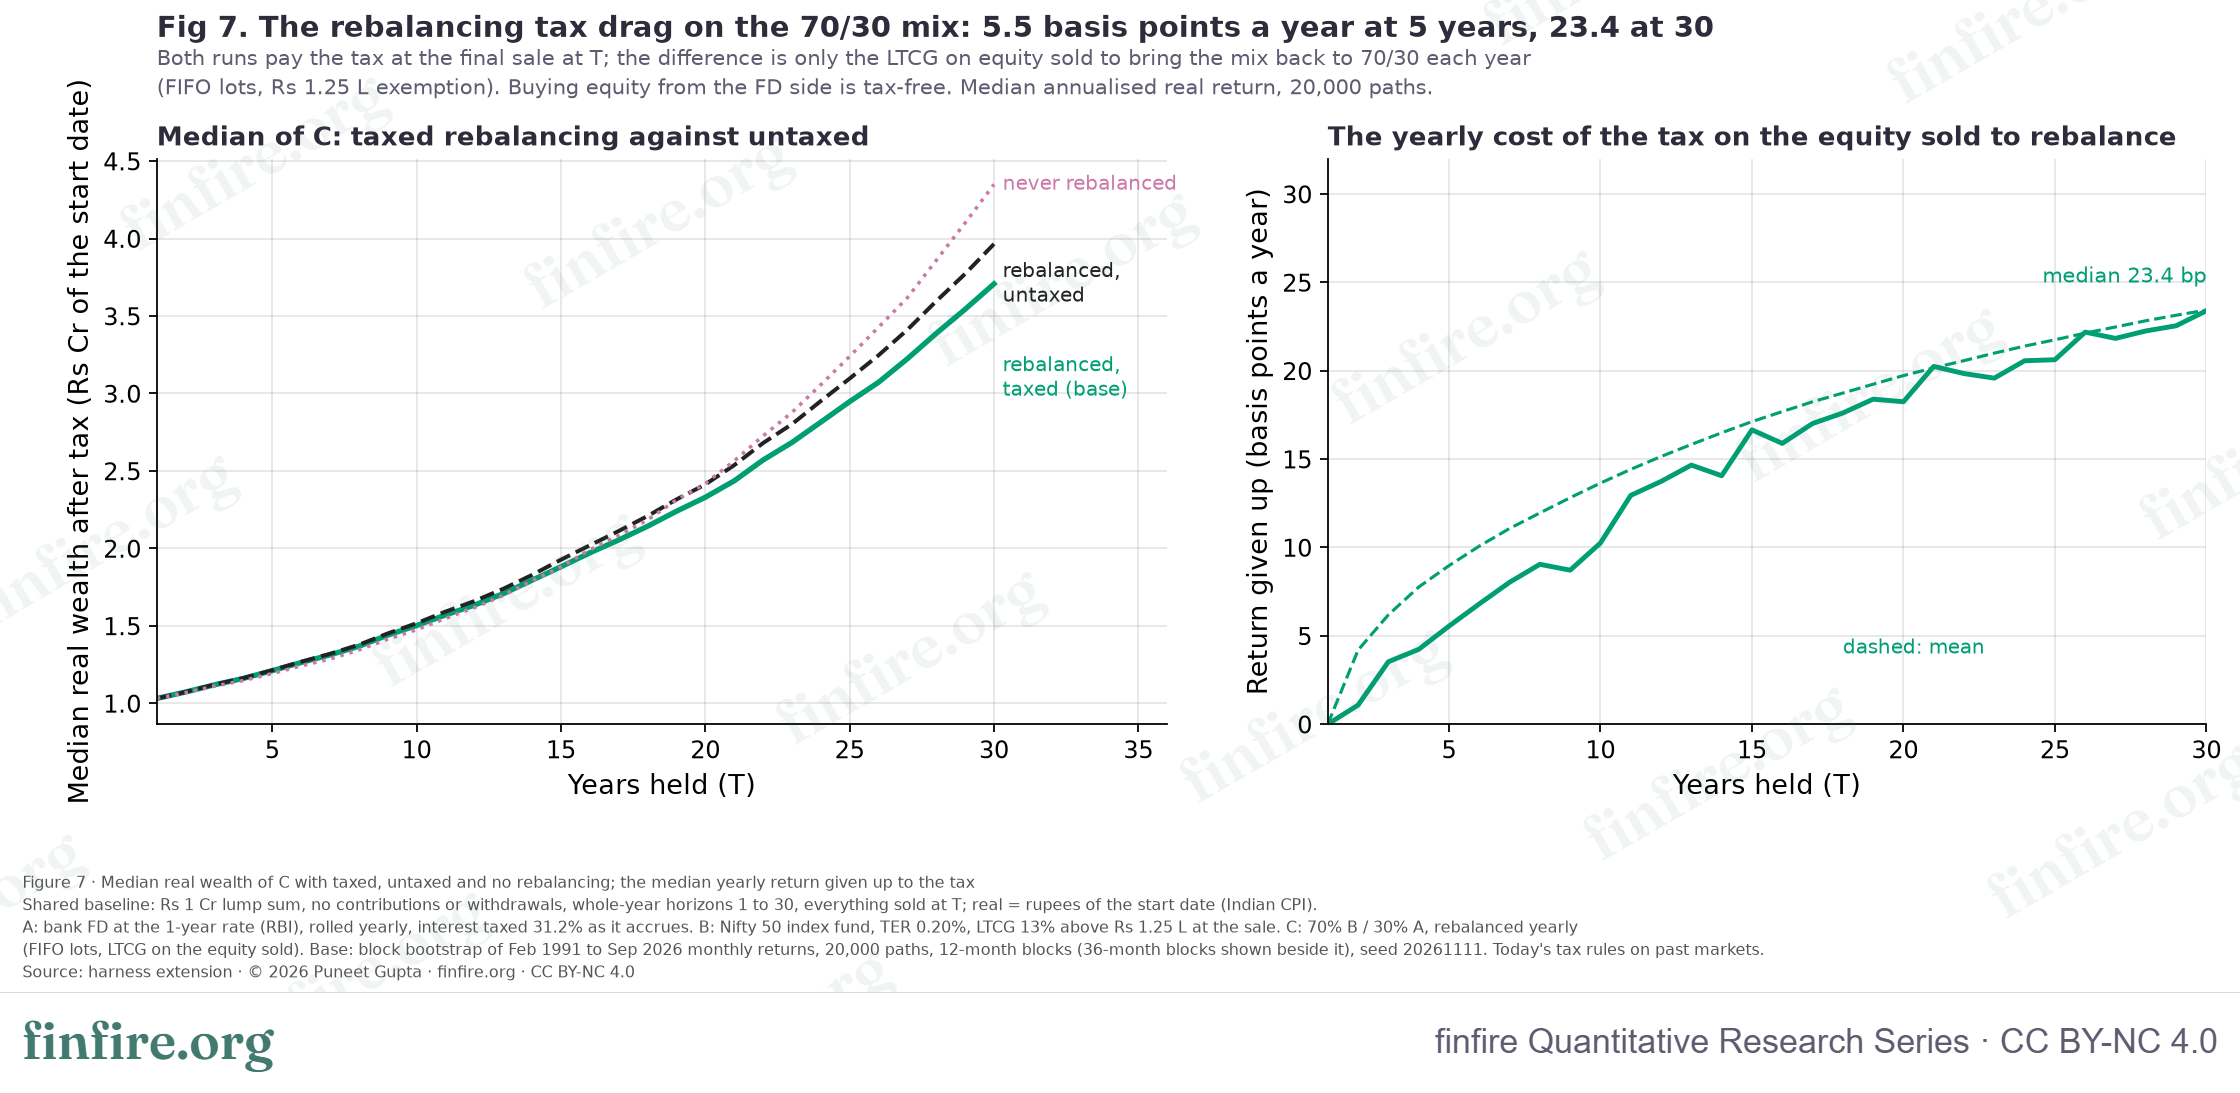
charts/fig7_rebalancing_drag_data.csv.Table 8 · The rebalancing tax on the 70/30 mix
| Years held | C median, taxed rebalancing | C median, rebalancing untaxed | Return given up (basis points a year, median) | C median, never rebalanced | C median, 5-point band |
|---|---|---|---|---|---|
| 5 | ₹1.21 Cr | ₹1.21 Cr | 5.5 | ₹1.19 Cr | ₹1.21 Cr |
| 10 | ₹1.50 Cr | ₹1.52 Cr | 10.3 | ₹1.48 Cr | ₹1.50 Cr |
| 20 | ₹2.33 Cr | ₹2.41 Cr | 18.2 | ₹2.42 Cr | ₹2.33 Cr |
| 30 | ₹3.71 Cr | ₹3.96 Cr | 23.4 | ₹4.35 Cr | ₹3.73 Cr |
The tax costs the mix a median of 5.5 basis points a year at 5 years, 10.3 at 10, 18.2 at 20 and 23.4 at 30. A mix that is never rebalanced ends higher at the median in later years (₹2.42 Cr at 20 years and ₹4.35 Cr at 30). But left alone, its bad luck no longer beats the FD's median within 30 years. The mix rebalanced when it drifts more than 5 points from 70% does (year 29). With no tax at all, on the rebalancing and at the sale, the mix's bad luck beats the FD's median in year 26. With no tax on the rebalancing only, it is year 28.
The mix's median is ₹1.50 Cr at 10 years, ₹2.33 Cr at 20 and ₹3.71 Cr at 30. Its worst 5% ends at ₹62.9 L, ₹65.8 L and ₹76.7 L. At 30 years its worst 5% is 0.77× of the start with 12-month blocks and 0.97× with 36-month blocks.
*
10. What this means for you
This paper describes a model of Indian conditions from 1991 to 2026. It does not say what you should hold. A few plain readings of the numbers:
- The FD's loss is small each year and very likely. −1.04% a year looks small. Over 30 years, at the median, it is the difference between ₹1 Cr and ₹73.2 L of buying power.
- Your tax rate decides how big that loss is. At 0% the FD's median at 30 years is ₹1.47 Cr. At 20.8% it is ₹92.5 L. At 31.2% it is ₹73.2 L (Table 7).
- The index fund's bad luck is real. One path in 20 ends at 0.49× to 0.58× of the start after 10 to 30 years. Whether and when that beats the FD's typical result depends on things we cannot settle: the FD's tax, the simulation's block length and the years of data.
- Short horizons look different. At 1 year, the FD's range (P5 to P95) is ₹94.6 L to ₹1.03 Cr, and the index fund's is ₹71.7 L to ₹1.54 Cr (Table 1).
- "Risk-free" means safe in rupees, not safe in buying power. In this model, after tax and inflation, the FD ends below its starting buying power in 98.4% of 30-year paths.
*
11. Limitations
- There is little independent history. The data hold 1.19 independent 30-year stretches. The bootstrap is simulation built from the same history. Percentiles from overlapping windows describe a few stretches.
- The crossover moves with our choices. It is none within 30 years at 12-month blocks and year 26 at 36-month blocks. With the 1980–1990 years it is year 21 and year 14. The base data cover 428 months.
- The early data are proxies. The 1990s equity numbers rest on the Sensex plus BSE's dividend yield until Jun 1999. The FD rate rests on administered deposit rates to 1995 and partly free ones to 1996.
- Today's tax rules are applied to every past year. In fact, equity LTCG was nil from 2004 to 2018, and the FD's tax rate was higher in the 1980s.
- The deposit rate is an approximation. It is the lower end of a five-bank range, on a straight line between end-March values. It matches SBI's card rate to within 0.18 points on six dated checks.
- Costs we left out. TDS, exit loads, STT, tracking error beyond the fee, premature-withdrawal penalties and the ₹5 L deposit-insurance limit.
- Only a taxable bank FD. PPF, EPF, SCSS, gilts and debt funds are not modelled. The results do not carry over to them.
- Not advice. Nothing here says what to hold.
*
12. Try this scenario yourself
The calculator takes one return, the same every year. A percentile from our simulation is not a path like that. So each link below uses a constant-return stand-in: the constant return that gives the same end value, in today's money, as the percentile. It lets you check an end value. It does not show the journey. The typed returns are after tax, so the tax is already inside them. Base inflation is 6.6%. Sign in before you open the links. The step marked (Pro) needs a Pro account.
Step 1 · The FD's median at 10 years. The page should show: After 10 years you will have ₹1.71 Cr — ₹90.27 L in today’s money. That matches the FD's median in Table 1 (₹90.3 L). → Open the FD's median, 10 years
Step 2 · The index fund's bad luck at 10 years. The page should show: After 10 years you will have ₹93.37 L — ₹49.27 L in today’s money. That matches the index fund's P5 in Table 1 (₹49.3 L). → Open the index fund's bad luck, 10 years
Step 3 · The same two at 20 years. The FD's median should show After 20 years you will have ₹2.92 Cr — ₹81.31 L in today’s money. The index fund's bad luck should show After 20 years you will have ₹1.78 Cr — ₹49.58 L in today’s money. → Open the FD's median, 20 years · Open the index fund's bad luck, 20 years
Step 4 · The same two at 30 years. The FD's median should show After 30 years you will have ₹4.98 Cr — ₹73.20 L in today’s money. The index fund's bad luck should show After 30 years you will have ₹3.96 Cr — ₹58.19 L in today’s money. → Open the FD's median, 30 years · Open the index fund's bad luck, 30 years
Step 5 · Compare them. Open the FD's median at 30 years from Step 4. Press Pin this plan. Then change Return to 4.693. The page should show After 30 years you will have ₹3.96 Cr — ₹58.19 L in today’s money. The Compare card should say that both plans stop working in the same year, with ₹15.01 L less in today’s money. The index fund's bad luck is still behind the FD's median at 30 years, as in the base case. → Open the FD's median, 30 years
Step 6 · The crossover in the 36-month run, year 26. In that run the FD's median at 26 years should show After 26 years you will have ₹3.99 Cr — ₹75.80 L in today’s money. The index fund's bad luck should show After 26 years you will have ₹4.05 Cr — ₹76.80 L in today’s money. The second is now higher. → Open the FD's median, 26 years · Open the index fund's bad luck, 26 years
Step 7 · What the tax does to an FD. This plan is ₹1 Cr in an FD at a 7.7% card rate (7.9252% a year with quarterly compounding) for 20 years, with the 31.2% tax taken out of the return (Return 5.4525). The page should show After 20 years you will have ₹2.89 Cr — ₹80.54 L in today’s money. That is close to the simulated median of ₹81.3 L but not the same, because it uses one card rate and not the 1991 to 2026 history of rates. Press Pin this plan, then change Return to 7.9252, which is no tax. The page should show After 20 years you will have ₹4.60 Cr — ₹1.28 Cr in today’s money. The Compare card should say that both plans stop working in the same year, with ₹47.49 L more in today’s money. → Open the taxed FD · Open the untaxed FD
Step 8 · The 70/30 mix at the 20-year medians (Pro). Open the FD's median at 20 years. Press Pin this plan. Tick Split between equity and debt. Type Equity return 12.8065, Debt return 5.5029 and Equity share 70. The page should show After 20 years you will have ₹7.52 Cr — ₹2.09 Cr in today’s money. The Compare card should say that both plans stop working in the same year, with ₹1.28 Cr more in today’s money. Do not expect ₹2.33 Cr, the mix's simulated median in Table 1. A mix of two medians is not the median of a mix, and the calculator rebalances without tax here. The link checks the calculator's rebalancing. It is not a copy of the simulation. → Open the 70/30 mix at the 20-year medians
Step 9 · Put in your own numbers. In any of these plans, change the amount, the years, the inflation and Return to yours. For an FD, a fair Return is your card rate, compounded, times one minus your tax rate on interest. Press Pin this plan on one version, then change the other.
*
13. Reproducibility
Every number in this paper can be checked.
- Calculator links. The calculator links are listed in urls.csv, below this section, with the plan each opens and the answer it gives. Every link was re-opened in a fresh copy of the real page: 30 values, 0 failures.
- Harness against the calculator. Our simulation code was run against the real accumulate page on seven constant-rate cases for the FD, the index fund and the mix, at every plan year. The largest gap was ₹0.000024.
- Independent check. A separate plain-Python program, sharing no code with the harness, recomputed 369 numbers from the seed. 0 failures.
- Compare and study. The Compare setups and the study were checked on the real page.
- Rerun. We ran
run_all.shtwice and compared the file hashes. The result is indata/rerun_check.txt. - Figures and tables. The numbers drawn in each figure are in the CSV named in its caption. Seeds: 20261111 for the base, and four more for the seed checks (Table A3).
*
Appendix
All amounts in the Appendix tables are in rupees: L is lakh and Cr is crore. "A" is the FD, "B" the index fund and "C" the 70/30 mix.
Table A1 · The horizon table, all methods (CSV: data/horizon_table.csv; every horizon from 1 to 30 years: data/t1_all_horizons.csv)
| Method | Years held | Portfolio | Paths or windows | Mean | Median | Std dev | P5 | P25 | P75 | P95 | Min | Max | Real return a year, median | Real return, P5 | Real return, P95 | P(real < ₹1 Cr) | P(real < ₹50 L) | P(below the FD) |
|---|---|---|---|---|---|---|---|---|---|---|---|---|---|---|---|---|---|---|
| Block bootstrap (base) | 1 | A | 20000 | 99.0 L | 99.0 L | 2.6 L | 94.6 L | 97.4 L | 1.01 Cr | 1.03 Cr | 89.9 L | 1.07 Cr | −0.95% | −5.42% | 3.11% | 63.2% | 0.0% | |
| Block bootstrap (base) | 1 | B | 20000 | 1.08 Cr | 1.04 Cr | 27.2 L | 71.7 L | 92.7 L | 1.20 Cr | 1.54 Cr | 43.6 L | 2.94 Cr | 4.49% | −28.28% | 53.76% | 40.6% | 0.9% | 38.1% |
| Block bootstrap (base) | 1 | C | 20000 | 1.05 Cr | 1.03 Cr | 19.0 L | 79.5 L | 95.0 L | 1.14 Cr | 1.37 Cr | 59.2 L | 2.34 Cr | 3.16% | −20.49% | 37.42% | 41.6% | 0.0% | 38.1% |
| Block bootstrap (base) | 5 | A | 20000 | 95.1 L | 95.2 L | 5.7 L | 85.7 L | 91.3 L | 99.0 L | 1.05 Cr | 74.4 L | 1.17 Cr | −0.99% | −3.05% | 0.91% | 80.4% | 0.0% | |
| Block bootstrap (base) | 5 | B | 20000 | 1.52 Cr | 1.29 Cr | 94.4 L | 52.8 L | 91.8 L | 1.86 Cr | 3.21 Cr | 10.8 L | 17.24 Cr | 5.28% | −12.00% | 26.28% | 31.0% | 4.2% | 27.5% |
| Block bootstrap (base) | 5 | C | 20000 | 1.32 Cr | 1.21 Cr | 56.3 L | 65.4 L | 94.9 L | 1.57 Cr | 2.35 Cr | 23.0 L | 8.74 Cr | 3.90% | −8.16% | 18.68% | 29.9% | 1.2% | 25.3% |
| Block bootstrap (base) | 10 | A | 20000 | 90.5 L | 90.3 L | 7.7 L | 78.1 L | 85.2 L | 95.6 L | 1.03 Cr | 63.4 L | 1.20 Cr | −1.02% | −2.44% | 0.34% | 89.2% | 0.0% | |
| Block bootstrap (base) | 10 | B | 20000 | 2.38 Cr | 1.72 Cr | 2.29 Cr | 49.3 L | 1.03 Cr | 2.90 Cr | 6.47 Cr | 7.2 L | 38.86 Cr | 5.56% | −6.83% | 20.53% | 23.9% | 5.2% | 20.0% |
| Block bootstrap (base) | 10 | C | 20000 | 1.78 Cr | 1.50 Cr | 1.12 Cr | 62.9 L | 1.05 Cr | 2.17 Cr | 3.88 Cr | 17.7 L | 14.75 Cr | 4.15% | −4.53% | 14.51% | 22.2% | 1.9% | 17.0% |
| Block bootstrap (base) | 20 | A | 20000 | 81.8 L | 81.3 L | 9.9 L | 66.4 L | 74.8 L | 88.2 L | 98.6 L | 49.7 L | 1.35 Cr | −1.03% | −2.02% | −0.07% | 96.1% | 0.0% | |
| Block bootstrap (base) | 20 | B | 20000 | 6.21 Cr | 3.10 Cr | 11.01 Cr | 49.6 L | 1.46 Cr | 6.89 Cr | 21.25 Cr | 5.2 L | 351.05 Cr | 5.82% | −3.45% | 16.51% | 15.9% | 5.1% | 11.7% |
| Block bootstrap (base) | 20 | C | 20000 | 3.31 Cr | 2.33 Cr | 3.37 Cr | 65.8 L | 1.38 Cr | 4.06 Cr | 9.13 Cr | 14.8 L | 71.88 Cr | 4.32% | −2.07% | 11.69% | 13.8% | 2.1% | 8.6% |
| Block bootstrap (base) | 30 | A | 20000 | 73.9 L | 73.2 L | 10.9 L | 57.2 L | 66.2 L | 80.8 L | 93.1 L | 39.2 L | 1.31 Cr | −1.03% | −1.84% | −0.24% | 98.4% | 0.5% | |
| Block bootstrap (base) | 30 | B | 20000 | 16.39 Cr | 5.90 Cr | 43.93 Cr | 58.2 L | 2.28 Cr | 15.33 Cr | 60.69 Cr | 2.6 L | 2,111.59 Cr | 6.09% | −1.79% | 14.67% | 10.4% | 4.0% | 6.9% |
| Block bootstrap (base) | 30 | C | 20000 | 6.20 Cr | 3.71 Cr | 8.58 Cr | 76.7 L | 1.93 Cr | 7.28 Cr | 19.14 Cr | 9.6 L | 283.01 Cr | 4.46% | −0.88% | 10.34% | 8.6% | 1.9% | 4.5% |
| Historical windows | 1 | A | 417 | 99.0 L | 99.0 L | 2.7 L | 94.6 L | 97.3 L | 1.01 Cr | 1.03 Cr | 89.9 L | 1.07 Cr | −0.98% | −5.42% | 3.06% | 63.8% | 0.0% | |
| Historical windows | 1 | B | 417 | 1.08 Cr | 1.04 Cr | 27.4 L | 70.9 L | 92.4 L | 1.20 Cr | 1.54 Cr | 43.6 L | 2.94 Cr | 4.43% | −29.06% | 53.66% | 40.5% | 1.0% | 38.4% |
| Historical windows | 1 | C | 417 | 1.05 Cr | 1.03 Cr | 19.1 L | 79.2 L | 94.8 L | 1.14 Cr | 1.37 Cr | 59.2 L | 2.34 Cr | 3.09% | −20.79% | 37.36% | 41.5% | 0.0% | 38.4% |
| Historical windows | 5 | A | 369 | 95.1 L | 95.5 L | 7.7 L | 81.1 L | 90.4 L | 1.01 Cr | 1.06 Cr | 79.8 L | 1.14 Cr | −0.92% | −4.10% | 1.22% | 70.2% | 0.0% | |
| Historical windows | 5 | B | 369 | 1.36 Cr | 1.22 Cr | 65.4 L | 70.6 L | 94.8 L | 1.50 Cr | 2.84 Cr | 53.4 L | 4.72 Cr | 4.11% | −6.73% | 23.19% | 27.6% | 0.0% | 23.8% |
| Historical windows | 5 | C | 369 | 1.23 Cr | 1.16 Cr | 39.5 L | 78.5 L | 98.4 L | 1.34 Cr | 2.14 Cr | 64.1 L | 3.05 Cr | 3.06% | −4.73% | 16.38% | 27.6% | 0.0% | 19.5% |
| Historical windows | 10 | A | 309 | 90.4 L | 94.1 L | 9.4 L | 74.4 L | 81.0 L | 98.0 L | 1.02 Cr | 71.8 L | 1.04 Cr | −0.61% | −2.91% | 0.16% | 82.2% | 0.0% | |
| Historical windows | 10 | B | 309 | 1.76 Cr | 1.83 Cr | 64.5 L | 78.9 L | 1.21 Cr | 2.14 Cr | 2.82 Cr | 49.6 L | 3.62 Cr | 6.22% | −2.34% | 10.94% | 14.9% | 0.3% | 11.7% |
| Historical windows | 10 | C | 309 | 1.50 Cr | 1.56 Cr | 40.7 L | 89.2 L | 1.14 Cr | 1.76 Cr | 2.18 Cr | 67.2 L | 2.64 Cr | 4.55% | −1.14% | 8.09% | 12.0% | 0.0% | 8.4% |
| Historical windows | 20 | A | 189 | 76.2 L | 76.2 L | 4.0 L | 70.4 L | 73.2 L | 78.8 L | 82.9 L | 69.5 L | 88.4 L | −1.35% | −1.74% | −0.94% | 100.0% | 0.0% | |
| Historical windows | 20 | B | 189 | 3.23 Cr | 2.90 Cr | 1.18 Cr | 1.69 Cr | 2.36 Cr | 4.05 Cr | 5.48 Cr | 1.20 Cr | 6.30 Cr | 5.48% | 2.67% | 8.88% | 0.0% | 0.0% | 0.0% |
| Historical windows | 20 | C | 189 | 2.31 Cr | 2.25 Cr | 57.1 L | 1.49 Cr | 1.88 Cr | 2.71 Cr | 3.37 Cr | 1.30 Cr | 3.64 Cr | 4.14% | 2.02% | 6.26% | 0.0% | 0.0% | 0.0% |
| Historical windows | 30 | A | 69 | 72.6 L | 72.1 L | 2.0 L | 70.0 L | 70.9 L | 74.3 L | 76.0 L | 68.6 L | 76.4 L | −1.08% | −1.18% | −0.91% | 100.0% | 0.0% | |
| Historical windows | 30 | B | 69 | 4.72 Cr | 4.57 Cr | 1.10 Cr | 3.22 Cr | 3.87 Cr | 5.28 Cr | 6.72 Cr | 2.46 Cr | 7.88 Cr | 5.20% | 3.97% | 6.56% | 0.0% | 0.0% | 0.0% |
| Historical windows | 30 | C | 69 | 3.10 Cr | 3.06 Cr | 56.0 L | 2.36 Cr | 2.70 Cr | 3.32 Cr | 4.20 Cr | 2.17 Cr | 4.84 Cr | 3.80% | 2.90% | 4.90% | 0.0% | 0.0% | 0.0% |
| Lognormal | 1 | A | 20000 | 98.9 L | 98.8 L | 4.1 L | 92.3 L | 96.1 L | 1.02 Cr | 1.06 Cr | 82.2 L | 1.16 Cr | −1.18% | −7.68% | 5.91% | 61.1% | 0.0% | |
| Lognormal | 1 | B | 20000 | 1.08 Cr | 1.05 Cr | 26.2 L | 70.1 L | 89.7 L | 1.23 Cr | 1.55 Cr | 32.9 L | 2.72 Cr | 5.36% | −29.89% | 54.90% | 41.2% | 0.2% | 38.9% |
| Lognormal | 1 | C | 20000 | 1.05 Cr | 1.03 Cr | 18.7 L | 78.2 L | 92.3 L | 1.16 Cr | 1.39 Cr | 50.9 L | 2.19 Cr | 3.49% | −21.78% | 38.75% | 42.1% | 0.0% | 38.8% |
| Lognormal | 5 | A | 20000 | 94.8 L | 94.3 L | 8.5 L | 81.5 L | 88.9 L | 1.00 Cr | 1.09 Cr | 64.2 L | 1.36 Cr | −1.16% | −4.01% | 1.82% | 74.0% | 0.0% | |
| Lognormal | 5 | B | 20000 | 1.54 Cr | 1.32 Cr | 92.0 L | 54.8 L | 92.4 L | 1.90 Cr | 3.25 Cr | 14.6 L | 12.65 Cr | 5.71% | −11.33% | 26.60% | 30.0% | 3.6% | 25.9% |
| Lognormal | 5 | C | 20000 | 1.33 Cr | 1.23 Cr | 55.6 L | 66.0 L | 95.2 L | 1.59 Cr | 2.37 Cr | 25.4 L | 6.84 Cr | 4.15% | −7.97% | 18.88% | 29.3% | 0.9% | 23.6% |
| Lognormal | 10 | A | 20000 | 90.0 L | 89.0 L | 12.3 L | 71.3 L | 81.3 L | 97.7 L | 1.12 Cr | 53.7 L | 1.57 Cr | −1.16% | −3.32% | 1.12% | 80.1% | 0.0% | |
| Lognormal | 10 | B | 20000 | 2.50 Cr | 1.81 Cr | 2.45 Cr | 51.8 L | 1.08 Cr | 3.09 Cr | 6.58 Cr | 6.2 L | 62.25 Cr | 6.14% | −6.37% | 20.74% | 21.9% | 4.5% | 17.3% |
| Lognormal | 10 | C | 20000 | 1.84 Cr | 1.56 Cr | 1.16 Cr | 64.1 L | 1.08 Cr | 2.27 Cr | 3.93 Cr | 15.4 L | 20.53 Cr | 4.52% | −4.34% | 14.67% | 21.1% | 1.8% | 14.6% |
| Lognormal | 20 | A | 20000 | 81.0 L | 79.2 L | 16.8 L | 56.8 L | 69.0 L | 91.0 L | 1.11 Cr | 34.2 L | 1.77 Cr | −1.16% | −2.79% | 0.54% | 86.9% | 1.1% | |
| Lognormal | 20 | B | 20000 | 6.90 Cr | 3.52 Cr | 11.94 Cr | 54.1 L | 1.62 Cr | 7.60 Cr | 23.90 Cr | 3.9 L | 359.19 Cr | 6.50% | −3.03% | 17.20% | 13.6% | 4.3% | 9.3% |
| Lognormal | 20 | C | 20000 | 3.53 Cr | 2.51 Cr | 3.59 Cr | 68.8 L | 1.46 Cr | 4.32 Cr | 9.82 Cr | 10.5 L | 68.19 Cr | 4.71% | −1.85% | 12.10% | 12.6% | 2.1% | 7.0% |
| Lognormal | 30 | A | 20000 | 73.1 L | 70.6 L | 19.1 L | 46.4 L | 59.4 L | 83.9 L | 1.08 Cr | 22.8 L | 1.88 Cr | −1.15% | −2.53% | 0.27% | 91.0% | 8.9% | |
| Lognormal | 30 | B | 20000 | 18.92 Cr | 6.86 Cr | 47.01 Cr | 68.3 L | 2.66 Cr | 17.93 Cr | 69.86 Cr | 1.0 L | 1,231.59 Cr | 6.63% | −1.26% | 15.21% | 8.4% | 3.2% | 5.1% |
| Lognormal | 30 | C | 20000 | 6.75 Cr | 4.05 Cr | 9.15 Cr | 81.1 L | 2.08 Cr | 7.94 Cr | 21.07 Cr | 4.3 L | 170.49 Cr | 4.77% | −0.69% | 10.69% | 7.5% | 1.6% | 3.3% |
Table A2 · The crossover by method and variant
"First year" means the first year, out of 30, in which the condition holds. "Straight line" is the crossing point read between two years. "none" means it does not happen within the years the run covers.
| Run key | What | Paths or windows | Runs to (years) | (a) First year P5(B) ≥ P50(A) | on a straight line | (b) Holds from then on | (c) Chance B < A is 10% or less | (c) 5% or less | P5(B) ≥ P25(A) | P5(B) ≥ P5(A) | P5(C) ≥ P50(A) |
|---|---|---|---|---|---|---|---|---|---|---|---|
| hist | Historical rolling windows, monthly starts (Jan 1991 to Sep 2026) | 417 | 30 | 11 | 10.9 | 11 | 11 | 12 | 11 | 10 | 11 |
| boot | Block bootstrap, 12-month blocks, 20,000 paths (base case, seed 20261111) | 20000 | 30 | none | none | 23 | none | none | 30 | 29 | |
| logn | Parametric lognormal Monte Carlo, calibrated to the same months (20,000 paths) | 20000 | 30 | none | none | 19 | none | 27 | 22 | 26 | |
| v1_tax0 | V1 FD tax 0% (pre-tax) | 20000 | 30 | none | none | none | none | none | none | none | |
| v1_tax208 | V1 FD tax 20.8% (20% slab + cess) | 20000 | 30 | none | none | 29 | none | none | none | none | |
| v1_tax30 | V1 FD tax 30.0% (as briefed, no cess) | 20000 | 30 | none | none | 24 | none | none | none | 29 | |
| v1_tax3432 | V1 FD tax 34.32% (31.2% with the 10% surcharge tier) | 20000 | 30 | none | none | 22 | none | none | 28 | 27 | |
| v2_direct | V2 equity held directly: dividends taxed each year at 31.2%, no TER | 20000 | 30 | none | none | 24 | none | none | none | 30 | |
| v3_pre2014 | V3 era split: bootstrap from months before 2014 only | 20000 | 30 | none | none | none | none | none | none | none | |
| v3_post2014 | V3 era split: bootstrap from Jan 2014 on only | 20000 | 30 | 13 | 12.9 | 13 | 9 | 14 | 12 | 10 | 12 |
| v3h_pre2014 | V3 era split: historical windows starting before 2014 | 276 | 30 | 11 | 10.9 | 11 | 11 | 12 | 11 | 10 | 11 |
| v3h_post2014 | V3 era split: historical windows starting in 2014 or later | 141 | 12 | 3 | 2.9 | 3 | 3 | 3 | 3 | 3 | 3 |
| v4_band | V4 rebalancing C when equity is more than 5 points off 70% | 20000 | 30 | none | none | 23 | none | none | 30 | 29 | |
| v4_none | V4 no rebalancing of C | 20000 | 30 | none | none | 23 | none | none | 30 | none | |
| v5_block36 | V5 block bootstrap with 36-month blocks (kept beside the 12-month base) | 20000 | 30 | 26 | 25.7 | 26 | 17 | 26 | 23 | 18 | 20 |
| v6_harvest | V6 equity LTCG: harvesting the annual exemption each year | 20000 | 30 | none | none | 23 | none | none | 29 | 28 | |
| v8_annual | V8 FD interest compounded once a year (no quarterly compounding) | 20000 | 30 | none | none | 22 | none | none | 29 | 28 | |
| full_hist | V9 the full history from Dec 1979 (adds the 1980-1990 proxy years): historical windows | 550 | 30 | 11 | 10.1 | 11 | 8 | 11 | 10 | 10 | 9 |
| full_boot | V9 the full history from Dec 1979: block bootstrap, 12-month blocks | 20000 | 30 | 21 | 20.6 | 21 | 13 | 22 | 19 | 17 | 17 |
| full_boot36 | V9 the full history from Dec 1979: block bootstrap, 36-month blocks | 20000 | 30 | 14 | 13.8 | 14 | 9 | 15 | 12 | 9 | 12 |
| full_logn | V9 the full history from Dec 1979: lognormal Monte Carlo | 20000 | 30 | 23 | 22.0 | 23 | 14 | 22 | 19 | 15 | 19 |
| v10_surcharge | V10 surcharge on everything (an upper bound): FD interest at 34.32%, equity LTCG at 14.95% (12.5% × 1.15 × 1.04) | 20000 | 30 | none | none | 22 | none | none | 29 | 28 | |
| c_rebal_free | C with no tax on the sales that rebalance it (the sale at T still taxed) | 20000 | 30 | none | none | 23 | none | none | 30 | 28 | |
| c_frictionless | C with no tax on rebalancing (and none at sale): the frictionless 70/30 | 20000 | 30 | none | none | 21 | none | none | 27 | 26 |
Table A3 · Seed stability of the crossover (five seeds)
12-month blocks (base)
| Seed | (a) First year, straight line | (a) First year P5(B) ≥ P50(A) | (b) Stays | (c) 10% | (c) 5% | P5(B) ≥ P25(A) | P5(B) ≥ P5(A) | P5(C) ≥ P50(A) |
|---|---|---|---|---|---|---|---|---|
| 20261111 | none | none | none | 23 | none | none | 30 | 29 |
| 20261112 | none | none | none | 24 | none | none | 30 | 30 |
| 20261113 | none | none | none | 24 | none | none | 30 | 29 |
| 20261114 | none | none | none | 23 | none | none | 29 | 29 |
| 20261115 | none | none | none | 23 | none | none | none | 30 |
| mean | none | none | none | 23.40 | none | none | 29.75 | 29.40 |
| sd | 0.55 | 0.50 | 0.55 | |||||
| standard error (sd / √5) | 0.24 | 0.25 | 0.24 |
36-month blocks
| Seed | (a) First year, straight line | (a) First year P5(B) ≥ P50(A) | (b) Stays | (c) 10% | (c) 5% | P5(B) ≥ P25(A) | P5(B) ≥ P5(A) | P5(C) ≥ P50(A) |
|---|---|---|---|---|---|---|---|---|
| 20261111 | 25.66 | 26 | 26 | 17 | 26 | 23 | 18 | 20 |
| 20261112 | 25.11 | 26 | 26 | 17 | 26 | 21 | 18 | 20 |
| 20261113 | 25.04 | 26 | 26 | 17 | 26 | 22 | 17 | 20 |
| 20261114 | 24.95 | 25 | 25 | 17 | 26 | 23 | 17 | 20 |
| 20261115 | 24.21 | 25 | 25 | 17 | 26 | 21 | 17 | 20 |
| mean | 24.99 | 25.60 | 25.60 | 17.00 | 26.00 | 22.00 | 17.40 | 20.00 |
| sd | 0.52 | 0.55 | 0.55 | 0.00 | 0.00 | 1.00 | 0.55 | 0.00 |
| standard error (sd / √5) | 0.23 | 0.24 | 0.24 | 0.00 | 0.00 | 0.45 | 0.24 | 0.00 |
Table A4 · Variants at 10, 20 and 30 years
Run keys are the same as in Table A2. V4 runs change only the mix (C), so their A and B figures equal the base case.
| Run key | Years held | P50 of A | P5 of B | P5(B) − P50(A) | Chance B < A |
|---|---|---|---|---|---|
| v1_tax0 | 10 | ₹1.14 Cr | ₹49.3 L | −₹64.5 L | 29.9% |
| v1_tax0 | 20 | ₹1.29 Cr | ₹49.6 L | −₹79.6 L | 22.3% |
| v1_tax0 | 30 | ₹1.47 Cr | ₹58.2 L | −₹88.7 L | 16.3% |
| v1_tax208 | 10 | ₹97.6 L | ₹49.3 L | −₹48.3 L | 23.0% |
| v1_tax208 | 20 | ₹95.0 L | ₹49.6 L | −₹45.5 L | 14.8% |
| v1_tax208 | 30 | ₹92.5 L | ₹58.2 L | −₹34.3 L | 9.5% |
| v1_tax30 | 10 | ₹91.1 L | ₹49.3 L | −₹41.8 L | 20.3% |
| v1_tax30 | 20 | ₹82.8 L | ₹49.6 L | −₹33.2 L | 12.0% |
| v1_tax30 | 30 | ₹75.2 L | ₹58.2 L | −₹17.0 L | 7.2% |
| v1_tax3432 | 10 | ₹88.2 L | ₹49.3 L | −₹38.9 L | 19.2% |
| v1_tax3432 | 20 | ₹77.6 L | ₹49.6 L | −₹28.0 L | 10.8% |
| v1_tax3432 | 30 | ₹68.2 L | ₹58.2 L | −₹10.0 L | 6.3% |
| v2_direct | 10 | ₹90.3 L | ₹48.3 L | −₹42.0 L | 20.4% |
| v2_direct | 20 | ₹81.3 L | ₹48.6 L | −₹32.7 L | 12.1% |
| v2_direct | 30 | ₹73.2 L | ₹56.1 L | −₹17.1 L | 7.3% |
| v3_pre2014 | 10 | ₹86.0 L | ₹35.2 L | −₹50.8 L | 25.2% |
| v3_pre2014 | 20 | ₹73.8 L | ₹31.2 L | −₹42.7 L | 16.4% |
| v3_pre2014 | 30 | ₹63.4 L | ₹31.0 L | −₹32.4 L | 11.1% |
| v3_post2014 | 10 | ₹98.3 L | ₹90.7 L | −₹7.5 L | 7.6% |
| v3_post2014 | 20 | ₹96.6 L | ₹1.26 Cr | +₹28.9 L | 1.9% |
| v3_post2014 | 30 | ₹94.9 L | ₹1.89 Cr | +₹94.1 L | 0.5% |
| v3h_pre2014 | 10 | ₹92.6 L | ₹77.6 L | −₹15.0 L | 13.0% |
| v3h_pre2014 | 20 | ₹76.2 L | ₹1.69 Cr | +₹93.1 L | 0.0% |
| v3h_pre2014 | 30 | ₹72.1 L | ₹3.22 Cr | +₹2.50 Cr | 0.0% |
| v3h_post2014 | 10 | ₹95.7 L | ₹1.67 Cr | +₹71.5 L | 0.0% |
| v4_band | 10 | ₹90.3 L | ₹49.3 L | −₹41.0 L | 20.0% |
| v4_band | 20 | ₹81.3 L | ₹49.6 L | −₹31.7 L | 11.7% |
| v4_band | 30 | ₹73.2 L | ₹58.2 L | −₹15.0 L | 6.9% |
| v4_none | 10 | ₹90.3 L | ₹49.3 L | −₹41.0 L | 20.0% |
| v4_none | 20 | ₹81.3 L | ₹49.6 L | −₹31.7 L | 11.7% |
| v4_none | 30 | ₹73.2 L | ₹58.2 L | −₹15.0 L | 6.9% |
| v5_block36 | 10 | ₹90.1 L | ₹61.8 L | −₹28.3 L | 16.7% |
| v5_block36 | 20 | ₹80.8 L | ₹69.4 L | −₹11.4 L | 7.4% |
| v5_block36 | 30 | ₹72.5 L | ₹86.5 L | +₹14.0 L | 3.5% |
| v6_harvest | 10 | ₹90.3 L | ₹49.4 L | −₹40.8 L | 19.7% |
| v6_harvest | 20 | ₹81.3 L | ₹50.8 L | −₹30.5 L | 11.4% |
| v6_harvest | 30 | ₹73.2 L | ₹60.1 L | −₹13.1 L | 6.7% |
| v8_annual | 10 | ₹88.9 L | ₹49.3 L | −₹39.6 L | 19.5% |
| v8_annual | 20 | ₹78.8 L | ₹49.6 L | −₹29.2 L | 11.1% |
| v8_annual | 30 | ₹69.8 L | ₹58.2 L | −₹11.6 L | 6.5% |
| full_hist | 10 | ₹84.8 L | ₹83.6 L | −₹1.2 L | 8.1% |
| full_hist | 20 | ₹76.5 L | ₹1.80 Cr | +₹1.04 Cr | 0.0% |
| full_hist | 30 | ₹66.4 L | ₹3.72 Cr | +₹3.06 Cr | 0.0% |
| full_boot | 10 | ₹85.6 L | ₹57.7 L | −₹27.9 L | 13.2% |
| full_boot | 20 | ₹73.1 L | ₹71.7 L | −₹1.4 L | 5.4% |
| full_boot | 30 | ₹62.4 L | ₹1.00 Cr | +₹37.6 L | 2.7% |
| full_boot36 | 10 | ₹85.5 L | ₹73.3 L | −₹12.2 L | 9.1% |
| full_boot36 | 20 | ₹73.2 L | ₹1.01 Cr | +₹27.8 L | 2.5% |
| full_boot36 | 30 | ₹62.7 L | ₹1.59 Cr | +₹96.5 L | 0.8% |
| full_logn | 10 | ₹85.3 L | ₹57.0 L | −₹28.3 L | 13.1% |
| full_logn | 20 | ₹72.7 L | ₹65.6 L | −₹7.1 L | 5.9% |
| full_logn | 30 | ₹62.0 L | ₹92.4 L | +₹30.4 L | 2.6% |
| v10_surcharge | 10 | ₹88.2 L | ₹49.3 L | −₹38.9 L | 19.5% |
| v10_surcharge | 20 | ₹77.6 L | ₹49.1 L | −₹28.5 L | 11.1% |
| v10_surcharge | 30 | ₹68.2 L | ₹57.2 L | −₹11.0 L | 6.4% |
Table A5 · The calculator's constant-return stand-ins
Each link feeds the calculator the constant return that gives the same end value, in today's money, as a percentile of the simulation. They are stand-ins for a percentile, not historical paths. Links sa50-26-b36 and sb5-26-b36 come from the 36-month-block run.
| Link | What it is | Years held | Annualised real return of the percentile | Typed nominal return (%) at base CPI 6.6% | Percentile, real | Page, real (today's money) |
|---|---|---|---|---|---|---|
| sa50-26-b36 | stand-in for the FD's median (P50 of A), 36-month-block run: 26 years (that run's crossover year) | 26 | −1.060% | 5.4698 | ₹75.8 L | ₹75.8 L |
| sb5-26-b36 | stand-in for the index fund's bad-luck 5th percentile (P5 of B), 36-month-block run: 26 years | 26 | −1.010% | 5.523 | ₹76.8 L | ₹76.8 L |
| sa50-10 | stand-in for the FD's median (P50 of A): 10 years | 10 | −1.019% | 5.5142 | ₹90.3 L | ₹90.3 L |
| sb5-10 | stand-in for the index fund's bad-luck 5th percentile (P5 of B): 10 years | 10 | −6.833% | -0.684 | ₹49.3 L | ₹49.3 L |
| sa50-20 | stand-in for the FD's median (P50 of A): 20 years | 20 | −1.029% | 5.5029 | ₹81.3 L | ₹81.3 L |
| sb5-20 | stand-in for the index fund's bad-luck 5th percentile (P5 of B): 20 years | 20 | −3.447% | 2.9251 | ₹49.6 L | ₹49.6 L |
| sa50-30 | stand-in for the FD's median (P50 of A): 30 years | 30 | −1.035% | 5.4971 | ₹73.2 L | ₹73.2 L |
| sb5-30 | stand-in for the index fund's bad-luck 5th percentile (P5 of B): 30 years | 30 | −1.789% | 4.693 | ₹58.2 L | ₹58.2 L |
*
Every number in this paper rests on assumptions, not forecasts. Tax rules are FY2026-27 under the new regime and may change. None of this constitutes financial, tax, or investment advice. finfire.org operates the calculator and offers paid tiers.
Reproducibility. urls.csv lists every calculator link, the plan it opens and the answer it gives. Each link was re-opened in a fresh copy of the real page: 30 values, 0 failures. urls.csv