The "Lumpy Cash Flow" Multiplier Myth
Why a 40x Corpus Fails When Kids' Education Collides with Sequence Risk
finfire Quantitative Research Series · Paper #6 · October 2026
In one minute
A family retires with ₹5.50 Cr and spends ₹1 L a month (₹12 L a year). That is 45.8 times a year's spending, a 2.18% withdrawal rate. By the usual "33x to 40x" rule, this family is more than safe.
But the family also has two college bills coming: ₹75 L each in today's money, one at Month 96 and one at Month 120 (the first day of Year 9 and of Year 11). Many people quietly assume these bills "fit inside" the big number. We tested that assumption. We ran the same family through finfire's burndown calculator in seven parallel versions, all starting from the same Day-0 numbers, with FY 2026–27 new-regime tax included.
What we found (money in today's money; nominal in brackets):
- In steady 12% markets, nothing runs out within 40 years. The college bills deplete wealth, but the survival is taken care of. Year-40 wealth falls from ₹16.75 Cr (₹250.86 Cr) with no bills to ₹10.10 Cr (₹151.28 Cr) if fees rise 7% a year, and ₹7.37 Cr (₹110.41 Cr) if they rise 11%.
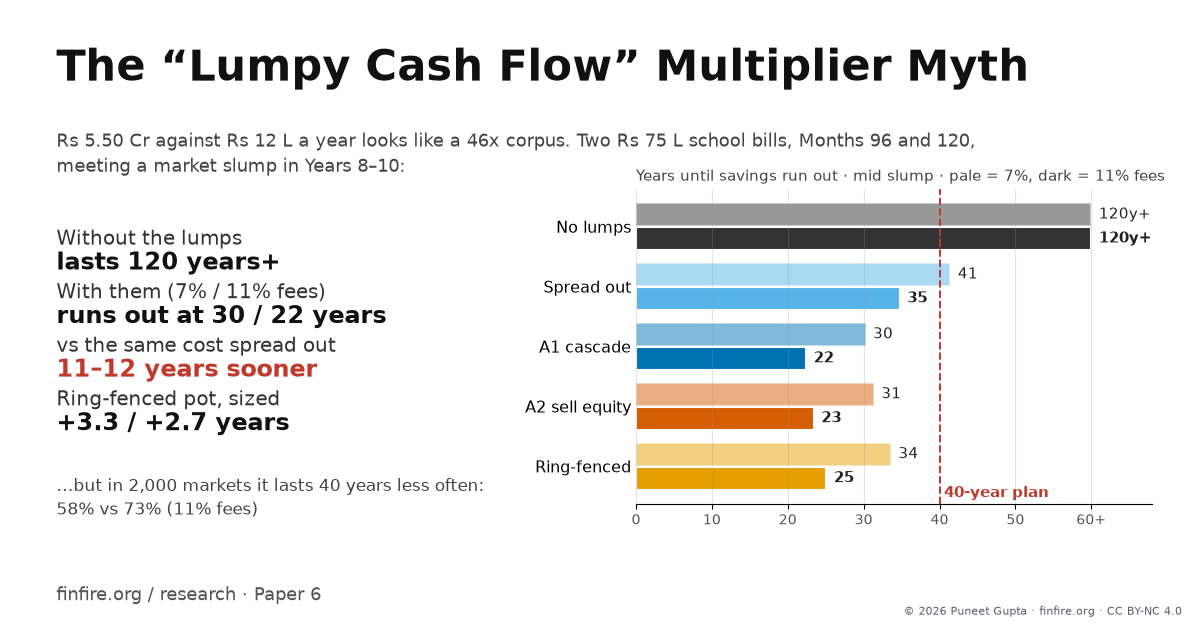
- Put a market slump on the college bill years and the plan breaks. With equity at −20%, −15% and 0% in Years 8 to 10, the savings run out at 30.3 years (fees +7%) or 22.4 years (fees +11%). Without the college bills, the same plan never runs out (120+ years). With the same education cost spread evenly over 40 years, it lasts 41.4 and 34.8 years. The lumpiness alone costs 11.2 to 12.3 years.
- A slump in Years 1 to 3 is worse still. The savings run out at 21.9 years (+7%) or 15.6 years (+11%), against 30.1 and 26.0 years with the cost spread out: 8.2 to 10.4 years lost.
- In 2,000 simulated markets, the chance of lasting 40 years falls from 94.8% (no bills) to 80.8% (+7%) and 72.75% (+11%).
- Education inflation of 11% instead of 7% costs 6.3 to 7.8 years in a slump, and raises the money you would need to set aside on Day 0 from ₹1.74 Cr to ₹2.48 Cr (+₹73.5 L, +42%).
- A ₹1.50 Cr "college pot" is not enough, even at 7%. After tax, the main savings still have to chip in ₹19.1 L (₹40.3 L) at 7% and ₹76.2 L (₹1.60 Cr) at 11%.
- Ring-fencing is insurance, not a free fix. A separate college pot adds 1.25 to 3.75 years in our scripted crashes and helps in the worst 10% of markets. But in 2,000 simulated markets it lasts 40 years less often than keeping one pot: 57.6% vs 72.75% at 11% (pot sized for the fees).
The short version: The usually assumed yearly cash flow multiplier (e.g 40x of yearly expenses) is not wrong, it is blind. It does not know when the money leaves. Two big college bills that land in a bad market can take a decade off a "safe" plan. That's the impact of not understanding the sequence of returns risk.
1. The question
Most Indian FIRE plans start with one sum: yearly spending × a multiplier. ₹12 L a year × 40 = ₹4.8 Cr. Then the kids' college fees, a wedding, or a house upgrade get "mentally parked" inside that big number.
We ask three questions in this paper:
- Does a big multiplier really absorb two large, dated bills? Or does the timing of the bills matter?
- What happens when those bills land during a market fall (this is sequence risk: bad returns arriving at exactly the wrong time)?
- Is there a solution to this? Does carving out a separate, safe "college pot" on Day 0 fix the problem?
2. The set-up
Baseline (Day 0, the same for every plan)
| Item | Value |
|---|---|
| Savings at retirement | ₹5,50,00,000 (₹5.50 Cr) |
| Spending | ₹1,00,000 a month (₹12 L in Year 1), rising 7% a year |
| Multiplier / withdrawal rate | 45.8x / 2.18% |
| Bucket 1 (liquid funds) | 18 months of spending = ₹18 L, earns 6.5% |
| Bucket 2 (bond and gilt funds) | 48 months of spending = ₹48 L, earns 7.5% |
| Bucket 3 (equity) | the rest = ₹4.84 Cr, earns 12% (median) |
| Gains already inside the savings | 50% of value is unrealised gain on Day 0 |
| Tax | FY 2026–27 new regime |
The two college bills
| Month 96 (start of Year 9) | Month 120 (start of Year 11) | Total, today's money | |
|---|---|---|---|
| Sub-Case A: fees rise 7% a year | ₹75.0 L (₹1,28,86,396) | ₹75.0 L (₹1,47,53,635) | ₹1.50 Cr |
| Sub-Case B: fees rise 11% a year | ₹1.01 Cr (₹1,72,84,033) | ₹1.08 Cr (₹2,12,95,657) | ₹2.09 Cr |
Why 11%? College fees, especially private STEM colleges in India and degrees abroad, have historically risen faster than general prices, and for foreign degrees a falling rupee adds to it. We treat 11% as a test case, not a forecast. Sub-Case A keeps fees at the same 7% as everything else.
Put simply: two cheques take away 27% (Sub-Case A) or 38% (Sub-Case B) of the starting savings, in today's money.
The seven plans (all start from the same baseline)
| Plan | Short name | What it does |
|---|---|---|
| No bills | NAIVE | The "multiplier view": ₹5.50 Cr, no college bills at all |
| Bills spread out | Flat | The same college cost in today's money, paid as an even yearly amount over 40 years (₹3,75,000 a year at 7%; ₹5,22,127 a year at 11%, both in today's money) |
| One pot, calculator's order | A1 | The bill is paid from Bucket 1, then Bucket 2, then Bucket 3. The year-end refill rebuilds Buckets 1 and 2 from equity |
| One pot, Bucket 2 first | A1b | Same idea, Bucket 2 emptied first |
| One pot, sell equity for the bill | A2 | The bill is paid by selling equity. Buckets 1 and 2 (66 months of spending) stay untouched |
| Ring-fenced ₹1.50 Cr | B | On Day 0, ₹1.50 Cr goes into a separate target-maturity debt pot for college. The other ₹4.00 Cr runs the retirement buckets with no bills |
| Ring-fenced, sized to the bill | B-sized | Same, but the college pot is sized so it pays both bills and its own tax: ₹1.74 Cr at 7%, ₹2.48 Cr at 11% |
Four kinds of market
- Steady: equity earns 12% every year.
- Early slump: equity returns −20%, −15%, 0% in Years 1 to 3, then 12%.
- Mid slump: equity returns −20%, −15%, 0% in Years 8 to 10, then 12%. The first bill lands in the −15% year; the second lands as the recovery starts.
- 2,000 simulated markets: random good and bad years around a 12% median, with ups and downs of 15.5% a year (we also checked 15% and 16%). Every plan sees the exact same 2,000 markets, so any difference between plans comes from the plan, not from luck.
### Assumptions and method
- Engines: burndown.finfire.org (Phase 2) and accumulate.finfire.org (Phase 1). Every result the calculator can produce was produced by the calculator; a standalone Python script (
verify_lumpy.py) re-ran every plan and matched the calculator to the rupee in 45 of 45 checks (largest difference 0.0%), including all 2,000 simulated markets. - Money: today's money (adjusted for 7% inflation) first, nominal in brackets.
- "Runs out": the first month the savings cannot pay that month's spending. "30.3 years" means Year 31, Month 3. "120+" means it never runs out in the calculator's 120-year run.
- Returns: compounded monthly, (1 + R)^(1/12) − 1. Equity median 12% (average 13.35% at 15.5% ups and downs). Bucket 2 bonds vary by 2% a year; Bucket 1 does not vary. In simulated markets, each year's return is drawn once and spread evenly over its 12 months. Seed 20260927.
- Spending is paid monthly from Bucket 1, then Bucket 2, then Bucket 3. Buckets are refilled once a year, after the year's tax: Bucket 2 tops up Bucket 1, then Bucket 3 tops up both.
- Bills are paid on the first day of Years 9 and 11. Their tax is settled at the end of those years.
- Tax (FY 2026–27 new regime): equity long-term capital gains (LTCG) at 12.5% above ₹1.25 L a year, plus 4% cess (13.0%), plus the unused basic exemption, which the law allows. Debt fund gains are taxed at slab rates, with the Section 87A rebate up to ₹12 L of income (never against LTCG). Surcharge of 10% above ₹50 L of income and 15% above ₹1 Cr (capped at 15% on LTCG), with marginal relief. Cost basis is average cost.
- Tax thresholds rise 7% a year (the calculator's default). Indian law does not index them; we re-ran everything with frozen thresholds (Section 10).
- Ring-fenced pot (Plans B and B-sized): target-maturity debt at 7.25%, held to maturity (not shocked in simulated markets), slab-taxed. The ₹1.50 Cr is equity sold on Day 0 (₹9,97,425 of LTCG paid that day). The pot pays the bills first; the main savings pay any shortfall; any leftover goes to equity. Core and pot are taxed as one person.
- Script-only results: the calculator cannot yet run A1b, A2, B or B-sized as single plans. These are marked [script] below. A2 was checked against a copy of the calculator's own code with one line changed (the order buckets are sold in): identical results.
3. Steady markets: no cliff
If equity earns 12% every single year, every plan lasts beyond 40 years. The only exception is the ring-fenced pot sized for 11% fees (B-sized), which runs out in Year 53.
The bills cost wealth instead:
| Plan | Year-40 wealth, fees +7% | Year-40 wealth, fees +11% |
|---|---|---|
| No bills | ₹16.75 Cr (₹250.86 Cr) | ₹16.75 Cr (₹250.86 Cr) |
| Bills spread out | ₹12.14 Cr (₹181.86 Cr) | ₹10.34 Cr (₹154.85 Cr) |
| A1 One pot | ₹10.10 Cr (₹151.28 Cr) | ₹7.37 Cr (₹110.41 Cr) |
| A2 One pot, sell equity [script] | ₹9.84 Cr (₹147.41 Cr) | ₹7.13 Cr (₹106.73 Cr) |
| B Ring-fenced ₹1.50 Cr [script] | ₹6.60 Cr (₹98.86 Cr) | ₹3.99 Cr (₹59.72 Cr) |
| B-sized [script] | ₹5.93 Cr (₹88.84 Cr) | ₹1.37 Cr (₹20.45 Cr) |
What this tells us: at 45.8x, the plan's real equity return (about 4.7% above inflation) is far above its 2.2% withdrawal. In a perfectly smooth market, the "big multiplier" really does absorb the bills. The danger is not the size of the bills. It is the bills meeting a bad market.
4. The cliff: when the bills meet a slump
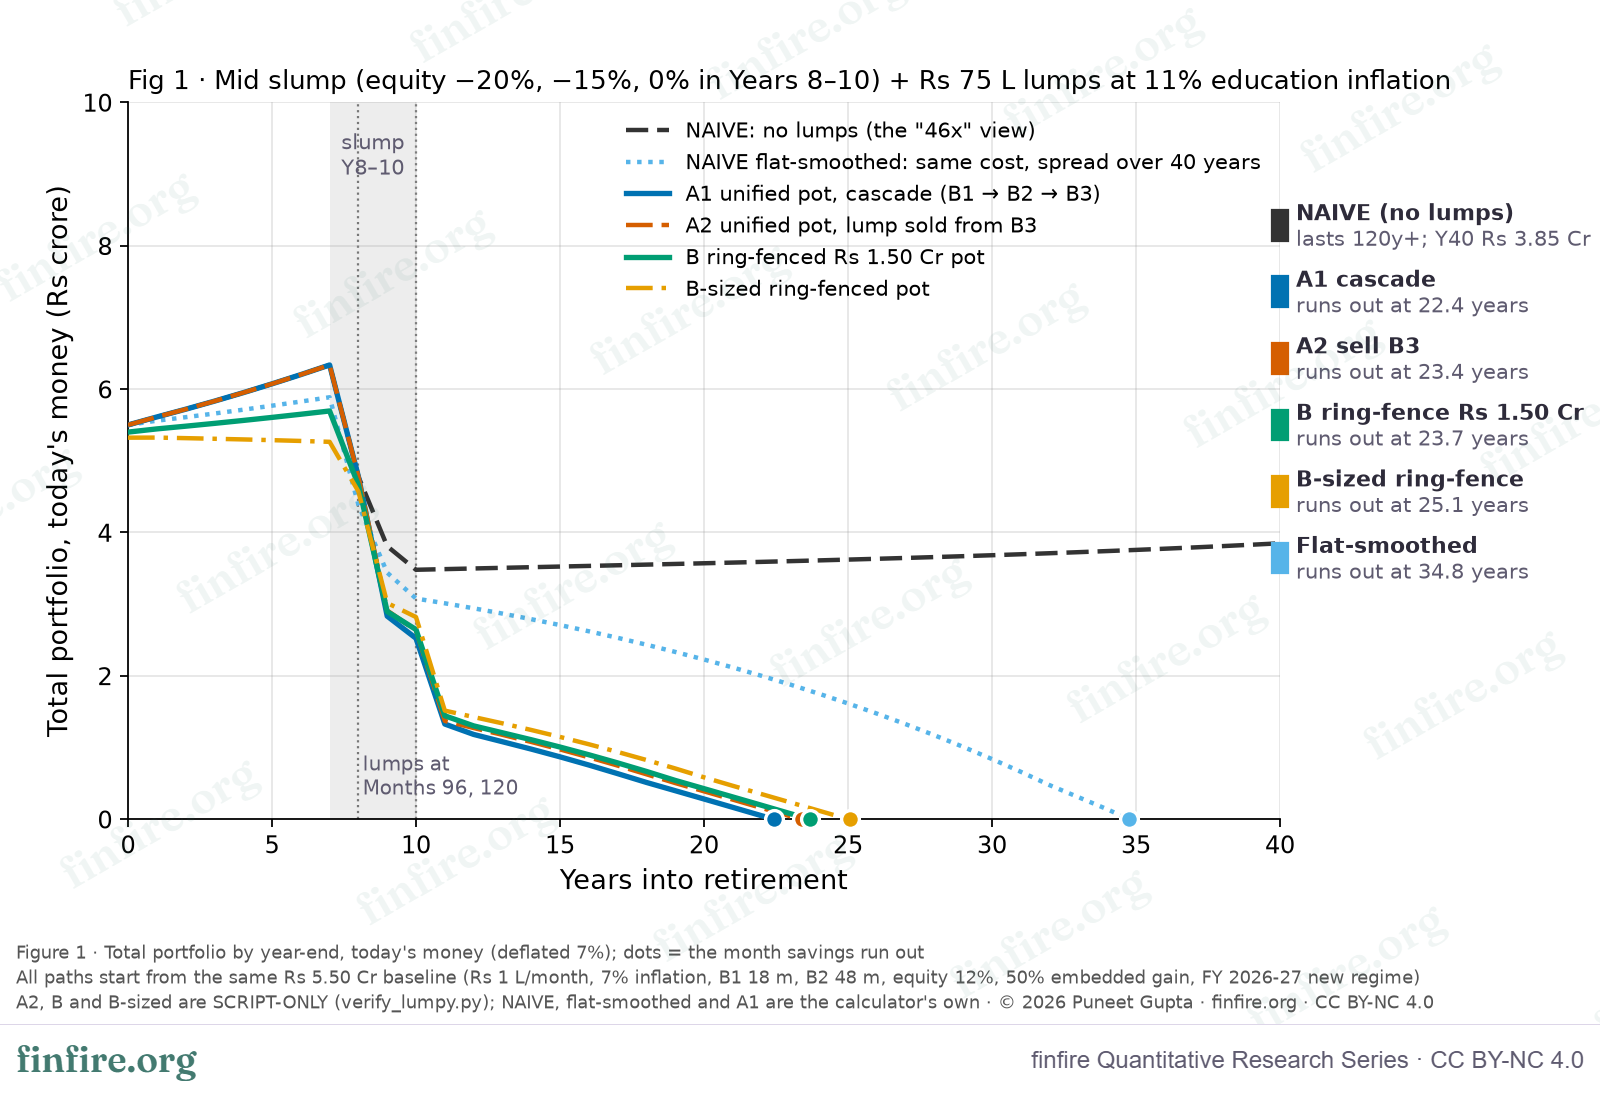
charts/fig1_trajectories_mid_slump_subB_data.csv.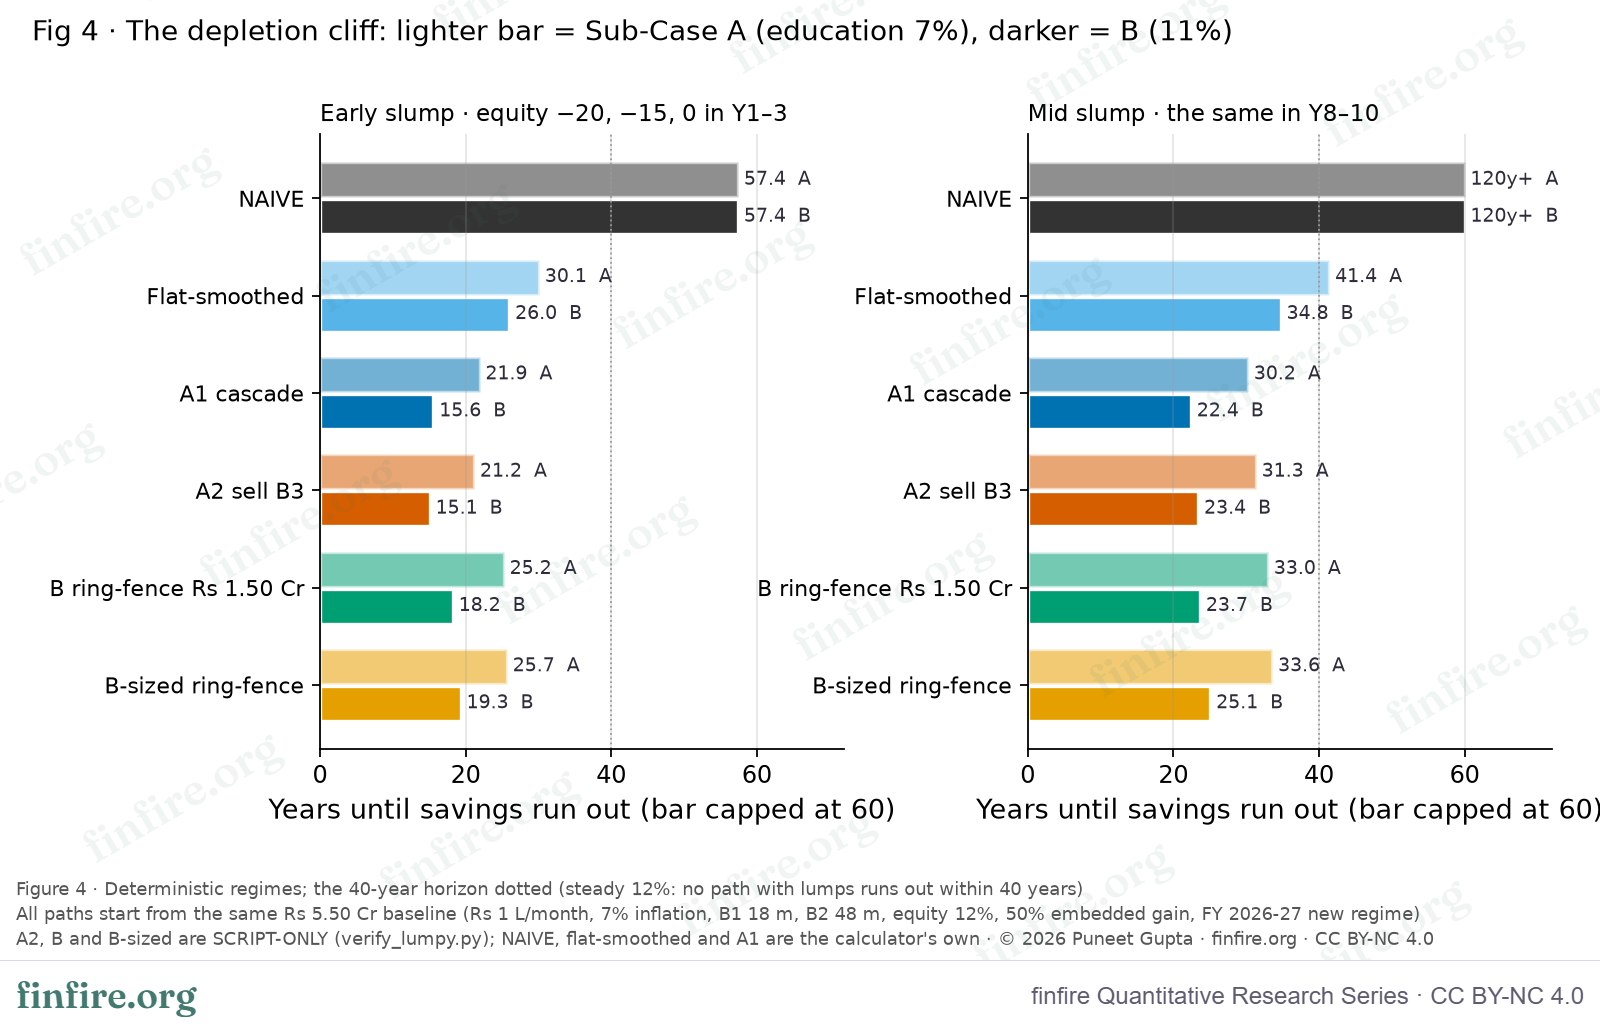
charts/fig4_depletion_cliff_data.csv.Table 1 · The depletion cliff (years until the savings run out)
| Plan | Early slump, fees +7% | Early slump, fees +11% | Mid slump, fees +7% | Mid slump, fees +11% |
|---|---|---|---|---|
| No bills | 57.4 | 57.4 | 120+ | 120+ |
| Bills spread out | 30.1 | 26.0 | 41.4 | 34.8 |
| A1 One pot | 21.9 | 15.6 | 30.3 | 22.4 |
| A1b One pot, Bucket 2 first [script] | 21.8 | 15.4 | 30.4 | 22.7 |
| A2 One pot, sell equity [script] | 21.2 | 15.1 | 31.3 | 23.4 |
| B Ring-fenced ₹1.50 Cr [script] | 25.3 | 18.3 | 33.0 | 23.7 |
| B-sized [script] | 25.7 | 19.3 | 33.6 | 25.1 |
How big is the cliff?
It depends on what you compare against, and both comparisons matter:
| Comparison (A1, one pot) | Early slump +7% | Early slump +11% | Mid slump +7% | Mid slump +11% |
|---|---|---|---|---|
| vs bills spread out (cost of the bills arriving as lumps) | 8.2 years sooner | 10.4 years sooner | 11.2 years sooner | 12.3 years sooner |
| vs no bills (the multiplier view) | 35.5 years sooner | 41.8 years sooner | from "never" to 30.3 years | from "never" to 22.4 years |
- Against the same cost spread evenly, lumpy bills run out 8.2 to 12.3 years sooner. This is the pure price of timing: the same rupees, leaving in two big cheques instead of a steady trickle.
- Against the plain multiplier view (no bills at all), the gap is far bigger: 35 to 42 years in an early slump, and a plan that "never runs out" becomes one that runs out at 22 to 30 years in a mid slump. That is the real size of the myth.
In plain words: someone who retires at 45 with "₹5.5 Cr at 45x, I'm set for life" and ignores the two college cheques could run out of money at about 67 (fees +11%, mid slump) or as early as 60 (early slump), well inside a normal lifetime, if markets fall at the wrong moment.
5. Anatomy of the break: Years 7 to 12
Why does a mid slump do so much damage? Because the bills force the plan to sell when prices are down, and the buckets that were meant to protect against exactly that get used up.
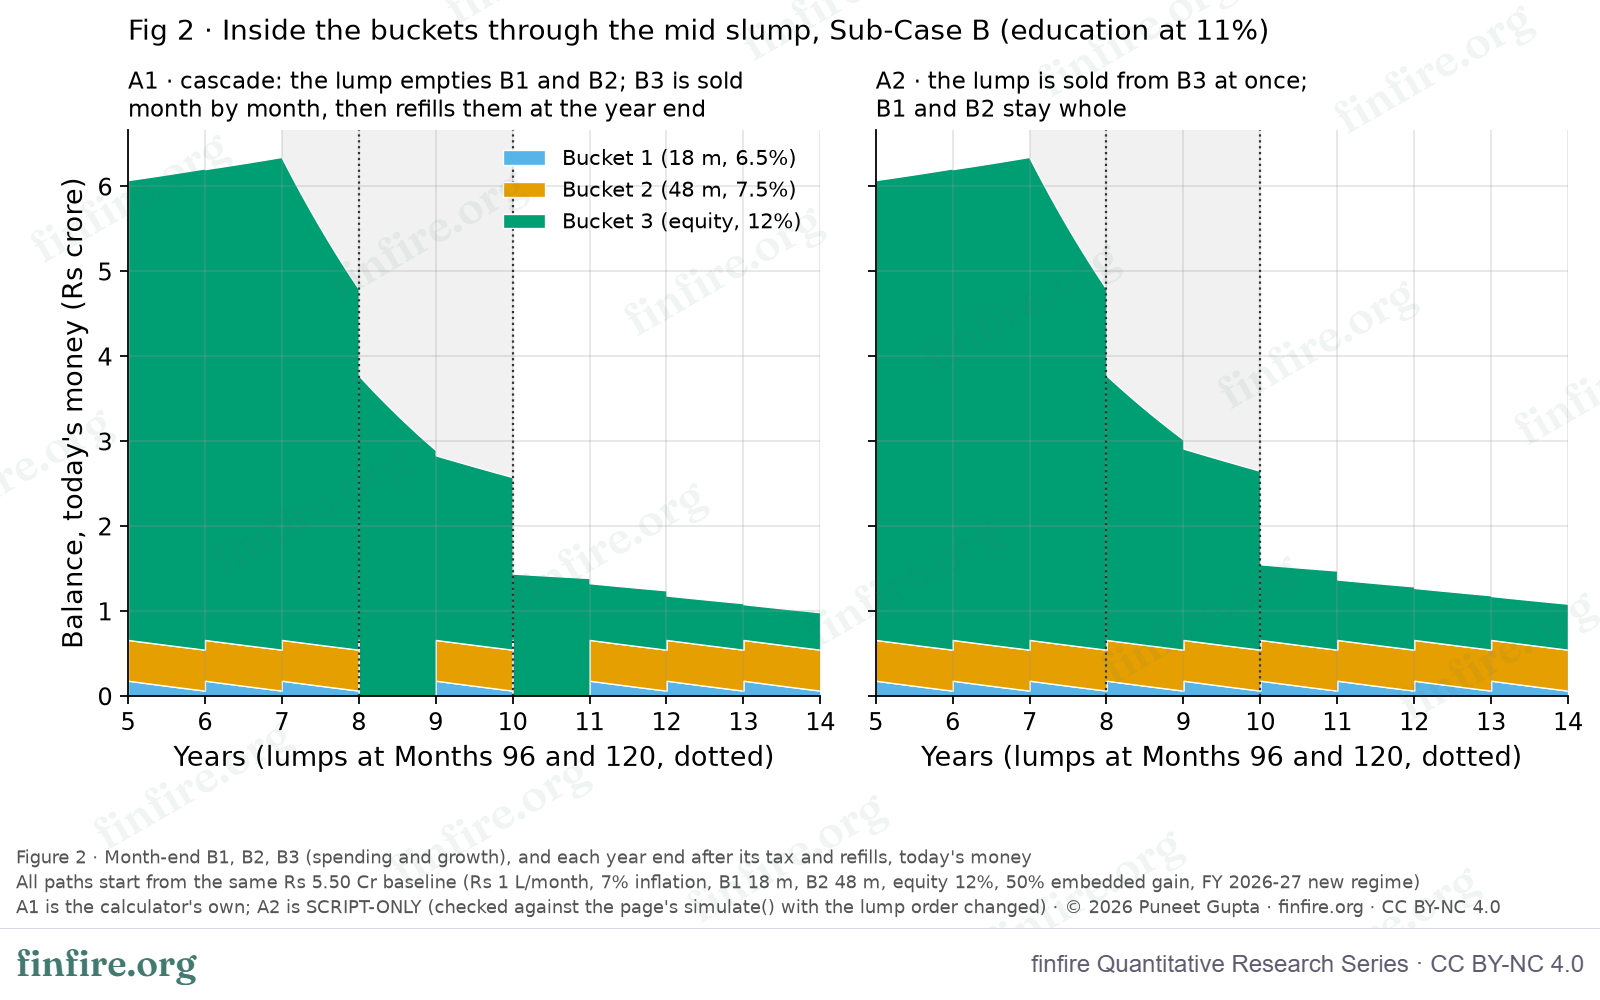
charts/fig2_buckets_A1_vs_A2_mid_subB_data.csv.Table 2 · Year-end balances, mid slump, fees +11%
Year-end balances after the year's tax and refills. Buckets 1 and 2 always show ₹18 L and ₹48 L at year end because the refill rebuilds them; Figure 2 shows they sat at zero for all of Years 9 and 11 in Plan A1. The real story is in Bucket 3.
A1 One pot (calculator)
| Year | Equity return | Bill (start of year) | Bucket 3 (equity) | Total | Tax paid | LTCG rate on the year's equity gains | Surcharge |
|---|---|---|---|---|---|---|---|
| 7 | +12% | — | ₹5.68 Cr (₹9.12 Cr) | ₹6.34 Cr (₹10.18 Cr) | ₹98,470 (₹1.6 L) | 11.36% | No |
| 8 | −20% | — | ₹4.12 Cr (₹7.08 Cr) | ₹4.78 Cr (₹8.21 Cr) | ₹1.0 L (₹1.8 L) | 11.32% | No |
| 9 | −15% | ₹1.01 Cr (₹1.73 Cr) | ₹2.17 Cr (₹3.99 Cr) | ₹2.83 Cr (₹5.21 Cr) | ₹6.2 L (₹11.4 L) | 14.38% | 10% |
| 10 | 0% | — | ₹1.86 Cr (₹3.67 Cr) | ₹2.52 Cr (₹4.96 Cr) | ₹5.3 L (₹10.3 L) | 11.68% | No |
| 11 | +12% | ₹1.08 Cr (₹2.13 Cr) | ₹66.8 L (₹1.40 Cr) | ₹1.33 Cr (₹2.79 Cr) | ₹6.2 L (₹13.0 L) | 13.85% | 10% |
| 12 | +12% | — | ₹52.3 L (₹1.18 Cr) | ₹1.18 Cr (₹2.66 Cr) | ₹6.1 L (₹13.8 L) | 12.92% | 10% |
A2 One pot, sell equity for the bill [script]
| Year | Equity return | Bill (start of year) | Bucket 3 (equity) | Total | Tax paid | LTCG rate on the year's equity gains | Surcharge |
|---|---|---|---|---|---|---|---|
| 7 | +12% | — | ₹5.68 Cr (₹9.12 Cr) | ₹6.34 Cr (₹10.18 Cr) | ₹98,470 (₹1.6 L) | 11.36% | No |
| 8 | −20% | — | ₹4.12 Cr (₹7.08 Cr) | ₹4.78 Cr (₹8.21 Cr) | ₹1.0 L (₹1.8 L) | 11.32% | No |
| 9 | −15% | ₹1.01 Cr (₹1.73 Cr) | ₹2.25 Cr (₹4.14 Cr) | ₹2.91 Cr (₹5.35 Cr) | ₹10.7 L (₹19.6 L) | 14.06% | 10% |
| 10 | 0% | — | ₹1.97 Cr (₹3.88 Cr) | ₹2.63 Cr (₹5.18 Cr) | ₹1.8 L (₹3.4 L) | 12.70% | No |
| 11 | +12% | ₹1.08 Cr (₹2.13 Cr) | ₹71.1 L (₹1.50 Cr) | ₹1.37 Cr (₹2.89 Cr) | ₹10.6 L (₹22.2 L) | 13.94% | 10% |
| 12 | +12% | — | ₹61.2 L (₹1.38 Cr) | ₹1.27 Cr (₹2.87 Cr) | ₹1.8 L (₹4.0 L) | 12.36% | No |
Reading the trace:
- In just five years (Year 7 to Year 12), equity shrinks from ₹5.68 Cr to ₹52.3 L in today's money, in Plan A1. Year 8's −20% alone cut it from ₹5.68 Cr to ₹4.12 Cr; the two bills, the refills and Year 9's −15% did the rest.
- The safety buckets don't survive the first bill. In A1, the ₹1.01 Cr bill empties Buckets 1 and 2 on the first day of Year 9. For the rest of that year, every month's spending is sold from equity, in a −15% year. This is exactly the forced selling the bucket strategy exists to prevent.
- By Year 12, the plan cannot recover. Equity of ₹52.3 L plus ₹66 L in the buffers covers roughly 10 years of spending. Even with 12% returns from Year 11 onward, it runs out at 22.4 years.
- Protecting the buffers (A2) buys about one year, not ten. Equity ends Year 12 at ₹61.2 L instead of ₹52.3 L. The bills are simply too big for any routing trick inside one pot.
6. The education inflation penalty: 11% vs 7%
What 11% fees cost each plan
| Plan | Steady: Year-40 wealth lost | Early slump: years lost | Mid slump: years lost |
|---|---|---|---|
| A1 One pot | ₹2.73 Cr | 6.3 | 7.8 |
| A2 One pot, sell equity [script] | ₹2.72 Cr | 6.1 | 7.9 |
| B Ring-fenced ₹1.50 Cr [script] | ₹2.61 Cr | 7.0 | 9.3 |
| B-sized [script] | ₹4.57 Cr (and runs out in Year 53) | 6.3 | 8.5 |
How much you would really need to set aside on Day 0 [script]
The amount that, put into 7.25% target-maturity debt, pays both bills and its own tax, with nothing left over:
| Before tax (present value) | After tax: equity sold on Day 0 (our headline) | If the pot keeps the old gain inside it | If it is fresh cash | If the pot were taxed as a separate person | |
|---|---|---|---|---|---|
| Fees +7% | ₹1.47 Cr | ₹1.74 Cr | ₹1.78 Cr | ₹1.62 Cr | ₹1.70 Cr |
| Fees +11% | ₹2.04 Cr | ₹2.48 Cr | ₹2.51 Cr | ₹2.30 Cr | ₹2.43 Cr |
Moving from 7% to 11% fee inflation raises the money you need to carve out by ₹73.5 L, or 42% (₹1.74 Cr to ₹2.48 Cr).
7. The ₹1.50 Cr college pot is not enough
A common plan: "I'll keep ₹1.5 Cr aside for the kids' college. That covers ₹75 L + ₹75 L." Before tax, it almost does. On accumulate.finfire.org, ₹1.50 Cr at 7.25% with the two goals rising at 7% ends Year 11 with just ₹6,73,201 to spare. At 11%, it leaves ₹1,09,72,738 of fees unpaid.
After tax, the 7% case also fails:
| Fees | Day-0 LTCG to create the pot | Pot's slab tax, Year 9 / Year 11 | Main savings must chip in |
|---|---|---|---|
| +7% | ₹9.97 L | ₹11.8 L / ₹13.5 L | ₹19.1 L (₹40.3 L) |
| +11% | ₹9.97 L | ₹19.7 L / ₹8.8 L | ₹76.2 L (₹1.60 Cr) |
Even if the ₹1.50 Cr were fresh cash with no tax due on Day 0, it would still fall ₹11.1 L (₹23.5 L) short at 7%. Two things eat the cushion: the tax to sell equity and move it into debt, and slab tax on the debt fund's own gains.
Lesson: if you ring-fence, size the pot after tax, at the fee inflation you actually expect.
8. 2,000 simulated markets
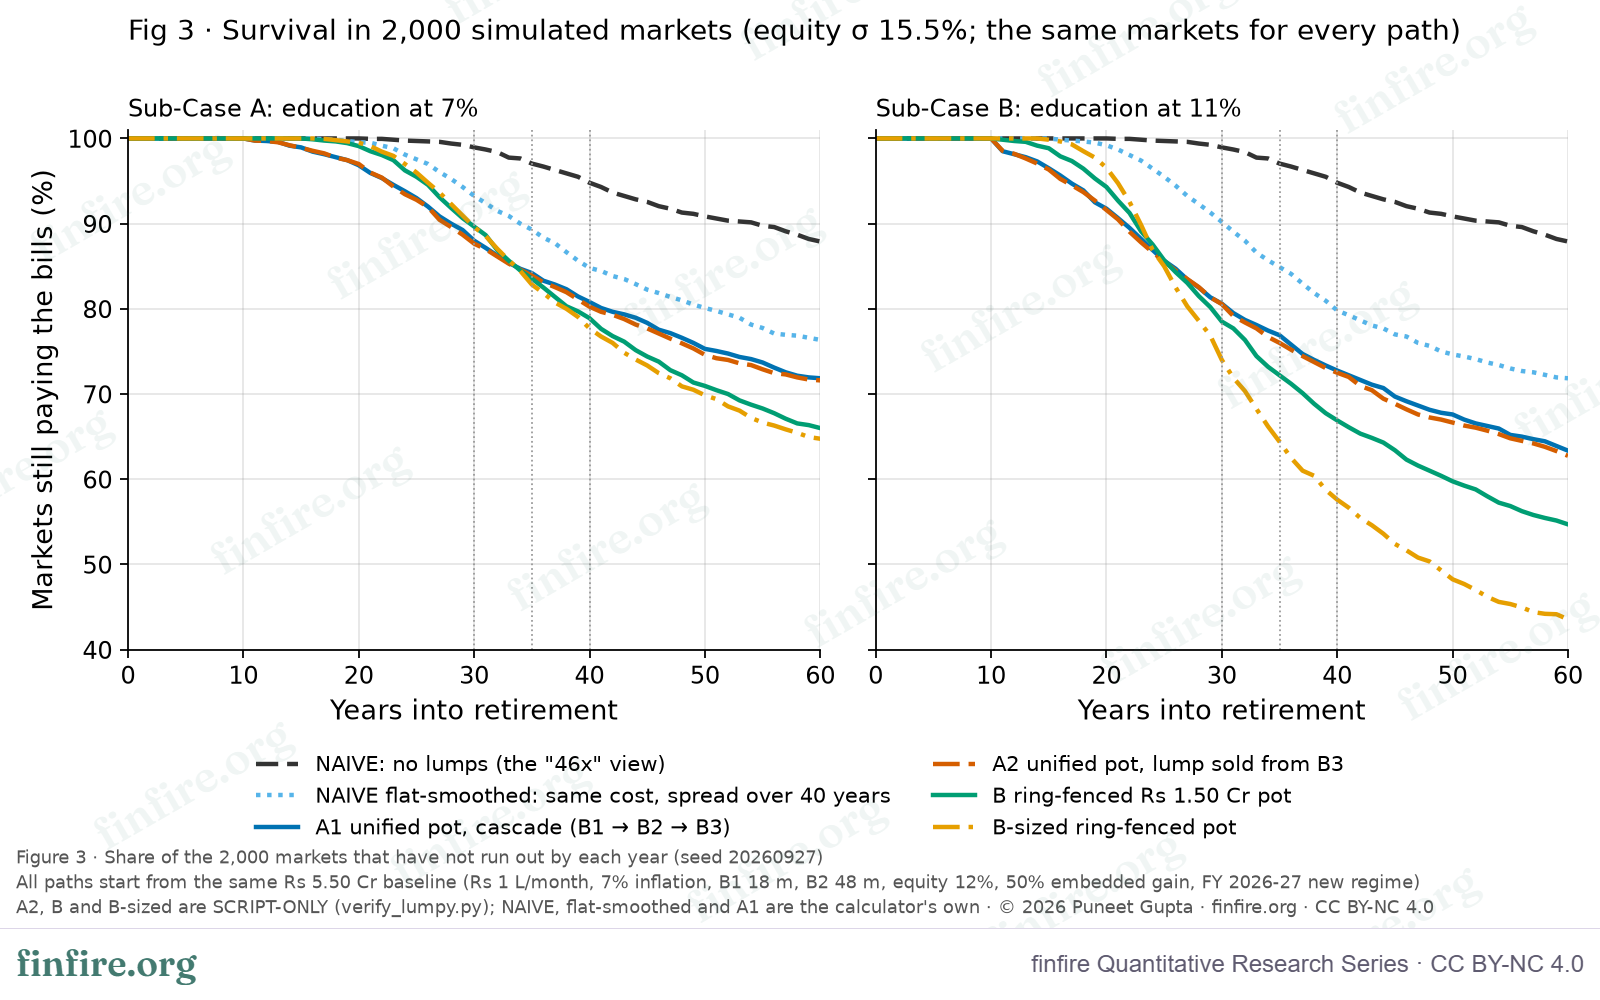
charts/fig3_mc_survival_curves_data.csv.Table 3 · Chance of lasting, and how long 8 in 10 markets last (ups and downs 15.5%)
| Plan | Fees | Lasts 30 years | Lasts 40 years | 8 in 10 markets last at least | 9 in 10 markets last at least |
|---|---|---|---|---|---|
| No bills | — | 98.95% | 94.8% | 120+ years | 54.4 years |
| Bills spread out | +7% | 93.25% | 84.8% | 50.4 years | 34.0 years |
| A1 One pot | +7% | 88.0% | 80.8% | 41.2 years | 28.0 years |
| A2 One pot, sell equity [script] | +7% | 87.65% | 80.25% | 40.4 years | 27.4 years |
| B Ring-fenced ₹1.50 Cr [script] | +7% | 89.65% | 78.9% | 38.75 years | 29.5 years |
| B-sized [script] | +7% | 89.6% | 77.7% | 38.0 years | 29.7 years |
| Bills spread out | +11% | 90.2% | 79.8% | 39.7 years | 30.2 years |
| A1 One pot | +11% | 80.6% | 72.75% | 30.6 years | 21.4 years |
| A2 One pot, sell equity [script] | +11% | 80.55% | 72.5% | 30.4 years | 21.25 years |
| B Ring-fenced ₹1.50 Cr [script] | +11% | 78.5% | 66.9% | 29.2 years | 22.7 years |
| B-sized [script] | +11% | 74.0% | 57.6% | 27.25 years | 23.0 years |
Reading it:
- The two college bills cut the 40-year success rate from 94.8% to 80.8% at 7% fees, and to 72.75% at 11%. Roughly one plan in four fails at 11%.
- In 8 out of 10 markets, the no-bills plan never runs out. With the bills at 11%, 8 in 10 markets last only 30.6 years.
- Spreading the same cost out would have kept 40-year success at 84.8% and 79.8%. Lumpiness costs 4 to 7 percentage points.
- Changing the ups and downs to 15% or 16% moves A1's 40-year success to 81.8% / 80.05% (fees +7%) and 73.5% / 72.3% (fees +11%). The ranking of plans does not change.
9. Ring-fencing: a crash hedge with a price
This is the result that surprised us, and you should know it before you act on the idea.
Where the ring-fence wins:
- In the scripted slumps it adds years over one pot (A1): early slump +3.3 / +2.7 years (₹1.50 Cr pot) and +3.75 / +3.75 (sized pot); mid slump +2.75 / +1.25 and +3.33 / +2.66 (fees +7% / +11%).
- In the worst 10% of simulated markets: the sized pot lasts 29.7 / 23.0 years against A1's 28.0 / 21.4.
- Through the first few decades: the ring-fenced plans stay ahead on the survival curve up to about year 33 (fees +7%) and year 24 (fees +11%).
Where it loses:
- In steady markets it gives up ₹3.39 Cr to ₹6.01 Cr of Year-40 wealth (today's money) against A1.
- Over 40 years in 2,000 markets, it succeeds less often: 77.7% vs 80.8% at 7%, and 57.6% vs 72.75% at 11% (sized pot).
Why: ring-fencing means selling equity on Day 0 (paying tax), then parking ₹1.5 Cr to ₹2.5 Cr in 7.25% debt for 8 to 10 years. In most markets, equity would have grown more than that over the same years, and would have paid the bills. The ring-fence protects you from one specific disaster (a crash right before the bills) by giving up growth in every other future.
So ring-fencing is a choice about which risk you'd rather carry, not a free improvement. If a crash in the years just before the fees is what would hurt your family most, it buys real protection. If you care about the overall odds, one well-tested pot did better in our markets.
10. Routing and tax: smaller effects, worth knowing
Which bucket pays the bill matters only a little
| Mid slump | Early slump | 2,000 markets, 40 years | |
|---|---|---|---|
| A2 vs A1 (sell equity vs calculator's order) | A2 lasts 1.1 / 1.0 years longer | A2 runs out 0.75 / 0.5 years sooner | A2 0.25–0.55 points worse |
| A1b vs A1 (Bucket 2 first) | within 0.25 years everywhere |
The tax gross-up
When you need ₹1.29 Cr in hand, you must sell more than ₹1.29 Cr, because the sale itself creates tax. The extra sale is the gross-up. We worked it out in a loop (sell, compute the tax, sell a bit more for the tax, repeat) until it moved by less than ₹1. [script]
| Bill (nominal) | One pot A1: must sell | Sell-equity A2: must sell |
|---|---|---|
| ₹1.29 Cr (fees +7%, steady) | ₹1.32 Cr | ₹1.46 Cr |
| ₹1.73 Cr (fees +11%, steady) | ₹1.83 Cr | ₹1.97 Cr |
- A1 looks cheaper, but only defers the tax. It pays the bill from Buckets 1 and 2, which hold mostly fresh cost, so the effective tax on the sale is just 1.6% to 5.6%. Then the year-end refill sells equity, and the gains show up next year: ₹43.3 L (₹85 L) of equity gains in Year 10 of the mid slump at 7%.
- A2 pays at once: 9.6% to 12.7% effective tax on the sale, and it lands in the 10% to 15% surcharge tier.
- The real LTCG rate is not a flat 13%. On the year's equity gains it ran from 11.3% to 14.4% in Years 7 to 12. The ₹1.25 L exemption and the unused basic exemption pull it below 13%; the 10% surcharge pushes it above.
Two tax sensitivities
- Frozen tax thresholds. The calculator raises slabs, the ₹12 L rebate limit, the ₹1.25 L exemption and the surcharge tiers by 7% a year (so the ₹50 L surcharge tier is ₹85.9 L by Year 9). Indian law does not do this. With thresholds frozen at FY 2026–27 values, the bill years pay the 10% or 15% surcharge tier, and every plan with bills runs out 0.6 to 2.3 years sooner in the mid slump. Our headline numbers are therefore on the generous side.
- How much gain is already in your savings. Raising the Day-0 unrealised gain from 30% to 70% makes A1 (mid slump, fees +11%) run out 1.8 years sooner (23.4 to 21.6 years), and raises the sized college pot from ₹2.39 Cr to ₹2.56 Cr.
11. What this means for you
- Don't let the multiplier hide the calendar. "45x" says nothing about when money leaves. List every big future cheque (college, wedding, house) with its year and amount, and model it as its own cash flow.
- Test each big bill against a bad market at the bill date. In smooth markets our family was fine. With a slump on the bill years, it lost 11 to 12 years. The plan that survives the average market can still fail the one you actually get.
- Price college at college inflation. Moving from 7% to 11% cost 6 to 8 years in a slump and ₹73.5 L more to set aside.
- If you ring-fence, size the pot after tax. ₹1.50 Cr for "₹75 L + ₹75 L" was short even at 7%. The after-tax amounts in our case were ₹1.74 Cr (7%) and ₹2.48 Cr (11%).
- Treat ring-fencing as insurance with a premium. It protects against a crash before the fees, and costs you growth and long-run odds in most other markets.
- Don't expect a routing trick to save you. Which bucket pays the bill moved the result by about a year. The size and timing of the bills, against your savings, is what matters.
- Watch the tax in bill years. A big one-year sale can push you into the surcharge tiers. The effective rate on gains ran up to 14.4% in our runs, and higher still with frozen thresholds.
12. Limitations
- 12% equity median. We did not run a lower median. A lower one would shorten every plan; the calculator lets you change it in one field.
- Fixed spending. The family never cuts spending in bad years. Real families often would.
- No other income, one taxpayer. No pension, rent, or a spouse's separate tax slabs.
- No education loan modelled. The closest comparison is the "bills spread out" plan, which spreads the same cost evenly but carries no interest.
- Slumps hit equity only. Bond and liquid returns continue as normal in the scripted slumps. Simulated markets have no scripted slump.
- The college pot is held to maturity at a fixed 7.25%: no default, no reinvestment or rate risk.
- Simulated markets use yearly draws spread evenly over 12 months, not month-by-month shocks.
- Bill amounts and dates are certain. Real fees may move, and may arrive spread over several years.
- Script-only plans (A1b, A2, B, B-sized) cannot yet be run as single plans in the calculator. Their links show the nearest one-click plan.
13. Try this scenario yourself
Every figure in this paper came from a plan you can open in one click. Sign in before you open them: the features marked (Pro) need a Pro account.
Step 1 · Open the main plan. Open the one-pot plan with fees at 11% and a mid slump. The calculator shows the savings running out in Year 23. → Open A1, mid slump, fees +11% · uses Lumpy Cash Flows (Pro), Market slump (Pro), Tax Slabs (Pro)
Step 2 · Pin it. Under Compare (Pro), press Pin this plan (create a baseline plan to compare). This plan becomes Plan A, drawn as a dashed line under the plan on screen. Compare shows two plans at a time; each link in Steps 3 to 5 opens with this plan already pinned as Plan A.
Step 3 · Compare it with the "no bills" plan. Same savings, same slump, no college bills. It never runs out. → Open No bills, mid slump, beside Step 1's plan · on its own
Step 4 · Compare it with the "bills spread out" plan. The same college cost, paid evenly. It runs out in Year 35. The gap between this line and Step 1's line is the cost of lumpiness. → Open Bills spread out, mid slump, fees +11%, beside Step 1's plan · on its own
Step 5 · Compare it with the ring-fenced core. ₹4.00 Cr, no bills, same slump (the separate college pot is not in this link; see Step 8). → Open B core ₹4.00 Cr, mid slump, beside Step 1's plan · on its own
Step 6 · Put in your own numbers. In any saved plan, change:
- Retirement savings and Monthly spending to yours.
- Lumpy Cash Flows (Pro): add each big bill in the year it lands, as a negative amount. If the bill rises with general inflation, tick Amounts are in today's rupees and type today's amount. If it rises faster (say 11%), untick it and type the future amount: today's amount × 1.11^(year − 1). Example: ₹75 L in Year 9 = ₹75 L × 1.11⁸ = ₹1,72,84,033.
- Unrealised Gains on your savings (Pro): the share of your savings that is gain.
- Press Pin this plan on one version, then change the other: Plan A stays as a dashed line beside the plan on screen.
Step 7 · Put the slump on your bill year (Pro). In Market slump, start the slump a year before your first bill (−20%, −15%, 0%). Then try it in Years 1 to 3. Add both to Compare.
Step 8 · Check a college pot (Pro). On accumulate.finfire.org, use Goals to see if a separate pot pays the fees, each goal with its own inflation (Pro). (This view is before tax. In our case the after-tax pot had to be about 18% to 22% bigger than the before-tax figure, as Section 6 shows.) → Open College pot, fees +7% · Open College pot, fees +11%
Step 9 · Run 2,000 markets (Pro). Turn on Simulated markets in your plan to see your chance of lasting 30, 35 and 40 years, and how long 8 in 10 markets last. Compare with and without your bills. → Open A1, fees +11%, 2,000 markets · Open No bills, 2,000 markets
14. Reproducibility
Everything behind this paper is in the repository folder research/lumpy-cash-flow-myth/:
inputs/— 39 plan files (JSON), andurls.md/urls.csvwith 46 calculator links. Each link was opened in the real page, its share link read back and re-opened, and checked to give the same answer.inputs/README.mdmaps every figure and table to its input file and link.scripts/verify_lumpy.py— a standalone Python re-run of every plan, including the script-only plans, the gross-up loop and the college-pot ledger.scripts/engine_check.js— runs the same plans in the real calculator page. 45 of 45 checks match to the rupee (results/06_crosscheck.md).results/— every table as CSV and Markdown;charts/— every figure as PNG, SVG and the data drawn.- Simulated markets: seed 20260927, 2,000 markets, the same markets for every plan.
- Engine versions: burndown
index.htmlcommit67e14c5a20a36910add302099f7da7e572f2d2cf; accumulateaccumulate.htmlcommit46bc03bd56d76863659c46d1c351bbd7a4e52eb8.
Script-only results (A1b, A2, B, B-sized, the gross-up loop table, run-out months) are explained in ENGINE_NOTES.md, Section 7.
Every number in this paper rests on assumptions, not forecasts. Tax rules are FY2026-27 under the new regime and may change. None of this constitutes financial, tax, or investment advice. finfire.org operates the calculator and offers paid tiers.
Reproducibility. Every calculator link behind this paper, with the plan it opens and the answer the calculator gives (plans the calculator cannot run yet are marked SCRIPT-ONLY): urls.csv