The Pre-Retirement Glide Path Paradox — De-Risking 5 Years Early vs. Staying 85% Equity Until Day Zero
The real cost of gliding
finfire Quantitative Research Series · Paper #8 · October 2026
In one minute
Many investors with ₹3–10 Cr hold 80–90% equity until a few years before their FIRE date. Planners say to cut to about 50:50 early. The investors answer that the shift triggers tax and gives up the last, biggest stretch of compounding. We tested both claims across 2,000 simulated markets and six crash replays. All amounts are in the money of year 20.
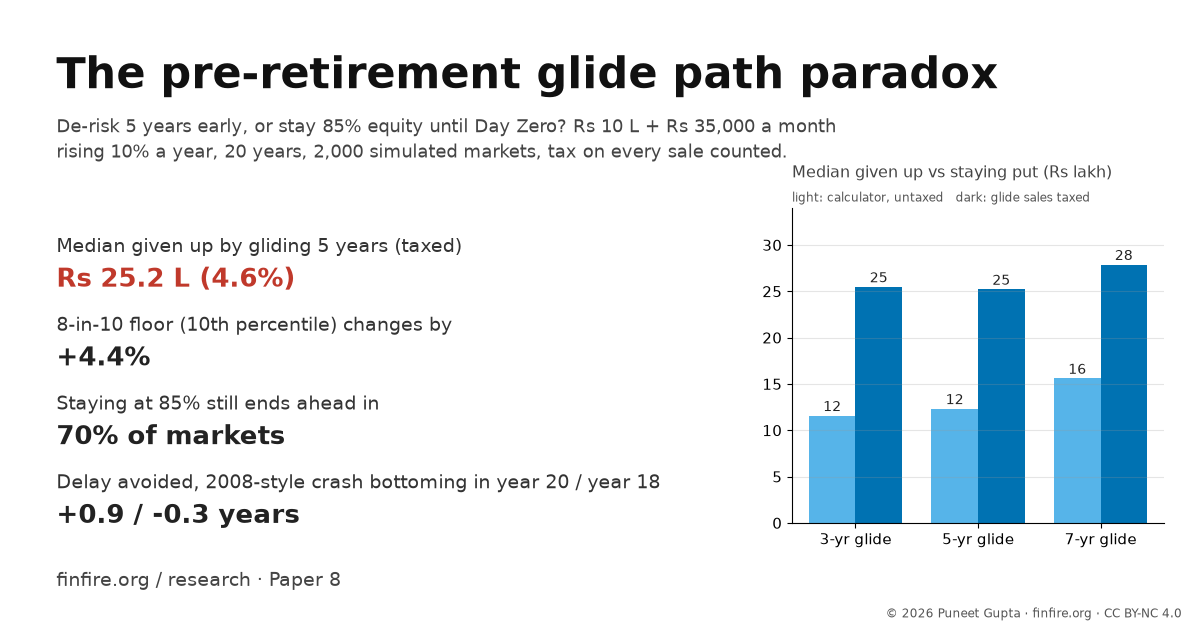
- The "insurance premium" is small in the calculator and twice as big once tax is counted. Gliding from 85% to 55% equity over the last 5 years (path B5) gives up ₹12.3 L of median corpus (2.26%) in the calculator. The calculator charges no tax on the glide. When the sales are taxed, the gap is ₹25.2 L (4.61%).
- The investors are right about tax. The glide pays ₹10,49,269 of tax at steady returns and ₹13,20,519 on average across the markets. About half of the taxed premium is tax.
- The investors are also right about the odds. Staying at 85% (path A) ends ahead of B5 in 59.9% of markets in the calculator, and in 70.0% once the glide is taxed.
- The planners are right about the bad tail. In the 10th percentile, B5 ends at ₹3.49 Cr against ₹3.32 Cr for A (+5.1%). In the calculator's Market slump, B5 ends at ₹3.77 Cr against ₹3.38 Cr.
- Crash timing decides everything. A 2008-style crash that bottoms on Day Zero delays A by 3.98 years and B5 by 3.10 years. If the same crash bottoms in year 18, B5 is 0.99 years behind and A is 0.68 (only path C, which sells everything early, does slightly better than A, at 0.63). Averaged over six crash replays, B5 prevents 0.13 years of delay.
- Selling everything 5 years early costs the most, and not selling does not get you there. Switching to 50:50 at once (path C) gives up ₹41.2 L (7.53%). Sending new money only to debt (path D) pays no tax, but takes equity only from 85% to 66.4%.
The short version. In this plan, five years of glide cost about ₹25.2 L of median corpus once tax is counted. In return, the worst crash timing we tested delays retirement by 0.88 years less. An earlier crash gives no such help, and sometimes makes things worse. Both sides of the debate have a point.
The question
Does it pay to cut equity in the last years before you stop? The two sides:
- The planner: a crash just before Day Zero can force you to work longer. Cut risk early.
- The investor: cutting early means paying capital gains tax when the portfolio is at its largest, and giving up the final growth.
This paper puts a rupee number on each side. The cost of the glide is the "insurance premium". The protection is the years of retirement delay it prevents.
Words used
| Term | Meaning |
|---|---|
| Day Zero | The end of year 20, the day the SIP stops |
| Glide | The equity share falls in equal yearly steps |
| Median market | Half of the 2,000 simulated markets end above it |
| 10th percentile | "9 in 10 markets end above this" |
| 20th percentile | "8 in 10 markets end above this" |
| Market slump | The calculator's last 3 working years at −10% a year in equity |
| Steady returns | The plan with no ups and downs (9% equity, 6% debt a year) |
| Shift taxed | Sales made by the glide or the switch are taxed from the first year of the shift |
| Premium | Median of path A minus median of the path |
| Delay | Extra years of SIP and median-return growth needed to reach the target |
| Delay with the rebound | The same delay, counting the 24 months of recovery that follow the crash bottom, including months after Day Zero |
| Target | Path A's no-crash, steady-return corpus: ₹5.27 Cr (₹5,26,57,950) |
The set-up and the paths
Every path shares the same baseline: ₹10 L today, a SIP of ₹35,000 a month rising 10% a year from year 2, 20 years, and 85% equity from year 1. Equity returns 9% a year and debt 6% (medians), with volatility of 18% and 4%. We used 2,000 simulated markets with one fixed seed.
All rupee amounts are in the money of year 20, which is the calculator's "Money of each year" view. The calculator opens in "Today's money". At its default 7% inflation, the ₹5.46 Cr median of path A is Rs 1.41 Cr in today's money.
We first tried a SIP of ₹50,000 a month. That gave a median of ₹7.56 Cr, above the ₹5–6 Cr we aimed for, so we used ₹35,000.
| Path | What it does | Engine |
|---|---|---|
| A | Stay at 85% equity to Day Zero | calculator |
| B3 | Glide 85% → 55% over the last 3 years | calculator |
| B5 | Glide 85% → 55% over the last 5 years | calculator |
| B7 | Glide 85% → 55% over the last 7 years | calculator |
| C | Sell equity 5 years early and switch to 50:50 (tax at sale) | harness extension |
| D | No selling; from 5 years out, new money goes 100% to debt | harness extension |
What the calculator does. Its glide is linear. At the start of each year, it rebalances the whole balance to that year's equity share. For a 5-year glide the shares are 85, 79, 73, 67, 61 and 55% in years 15 to 20. It charges no tax on these sales. Its "8 in 10" band is the 10th to 90th percentile. The 20th percentile is not on the page, so we report both.
What the harness adds. The calculator cannot tax a sale, switch at once, or replay a crash in years 18 to 20. Our harness does these. It re-runs the page's own yearly steps on tax lots. With tax switched off, it matches the page to the paisa, in the steady-return plan and in every one of the 2,000 markets.
Assumptions and method
- Calculator: accumulate.finfire.org with Equity and debt (Pro), Glide, Simulated markets (Pro) and Market slump (Pro). Paths A, B3, B5 and B7.
- Harness extension: tax lots, first in first out. Equity LTCG 13% (12.5% + 4% cess) above ₹1,25,000 a year, STCG 20.8%, debt-fund gains at the 31.2% slab rate. Tax is paid out of the sale. Used for paths C and D and every taxed twin. Equal to the page to the paisa with tax off.
- Markets: 2,000, seed 20260927. Percentiles by nearest rank.
- Crashes: real monthly Nifty 50 price index (Yahoo Finance, fetched 28 Oct 2026) plus a 1.3% yield. 2008-style is Jan–Nov 2008 (−55.1% month-end to month-end). 2020-style is Jan–Mar 2020 (−29.3%). Each is followed by 24 months of recovery. The bottom falls at the end of year 18, 19 or 20.
- Amounts: money of year 20. Target is ₹5.27 Cr.
- Not modelled: credit events, exit loads, carry-forward of losses, the 87A rebate, and sequence risk after Day Zero.
Result 1: the premium is small, then tax doubles it
Table 1 shows every path. "Untaxed" rows follow the calculator's rules. "Shift taxed" rows tax the sales.
Table 1. Terminal corpus by path
| Path | Engine | Steady-return corpus | 10th pct | 20th pct | Median | 90th pct | Median vs A | Market Slump | Markets ending below the target |
|---|---|---|---|---|---|---|---|---|---|
| A (untaxed) | calculator | ₹5.27 Cr | ₹3.32 Cr | ₹3.91 Cr | ₹5.46 Cr | ₹9.35 Cr | 0.00% | ₹3.38 Cr | 46.1% |
| B3 (untaxed) | calculator | ₹5.18 Cr | ₹3.45 Cr | ₹3.99 Cr | ₹5.35 Cr | ₹8.92 Cr | −2.12% | ₹3.72 Cr | 47.8% |
| B5 (untaxed) | calculator | ₹5.15 Cr | ₹3.49 Cr | ₹4.01 Cr | ₹5.34 Cr | ₹8.76 Cr | −2.26% | ₹3.77 Cr | 48.4% |
| B7 (untaxed) | calculator | ₹5.11 Cr | ₹3.52 Cr | ₹4.03 Cr | ₹5.31 Cr | ₹8.59 Cr | −2.85% | ₹3.78 Cr | 49.0% |
| C (untaxed) | harness extension | ₹5.05 Cr | ₹3.60 Cr | ₹4.07 Cr | ₹5.23 Cr | ₹8.30 Cr | −4.22% | ₹3.91 Cr | 50.7% |
| D (untaxed) | harness extension | ₹5.20 Cr | ₹3.45 Cr | ₹3.94 Cr | ₹5.31 Cr | ₹9.06 Cr | −2.79% | ₹3.69 Cr | 48.9% |
| B3 (shift taxed) | harness extension | ₹5.04 Cr | ₹3.40 Cr | ₹3.93 Cr | ₹5.21 Cr | ₹8.59 Cr | −4.66% | ₹3.65 Cr | 51.3% |
| B5 (shift taxed) | harness extension | ₹5.02 Cr | ₹3.47 Cr | ₹3.95 Cr | ₹5.21 Cr | ₹8.44 Cr | −4.61% | ₹3.71 Cr | 51.2% |
| B7 (shift taxed) | harness extension | ₹5.00 Cr | ₹3.49 Cr | ₹3.96 Cr | ₹5.18 Cr | ₹8.25 Cr | −5.10% | ₹3.72 Cr | 51.5% |
| C (shift taxed) | harness extension | ₹4.93 Cr | ₹3.53 Cr | ₹3.96 Cr | ₹5.05 Cr | ₹7.87 Cr | −7.53% | ₹3.77 Cr | 54.6% |
| D (shift taxed) | harness extension | ₹5.20 Cr | ₹3.45 Cr | ₹3.94 Cr | ₹5.31 Cr | ₹9.06 Cr | −2.79% | ₹3.69 Cr | 48.9% |
Path D sells nothing, so its taxed and untaxed rows are the same.
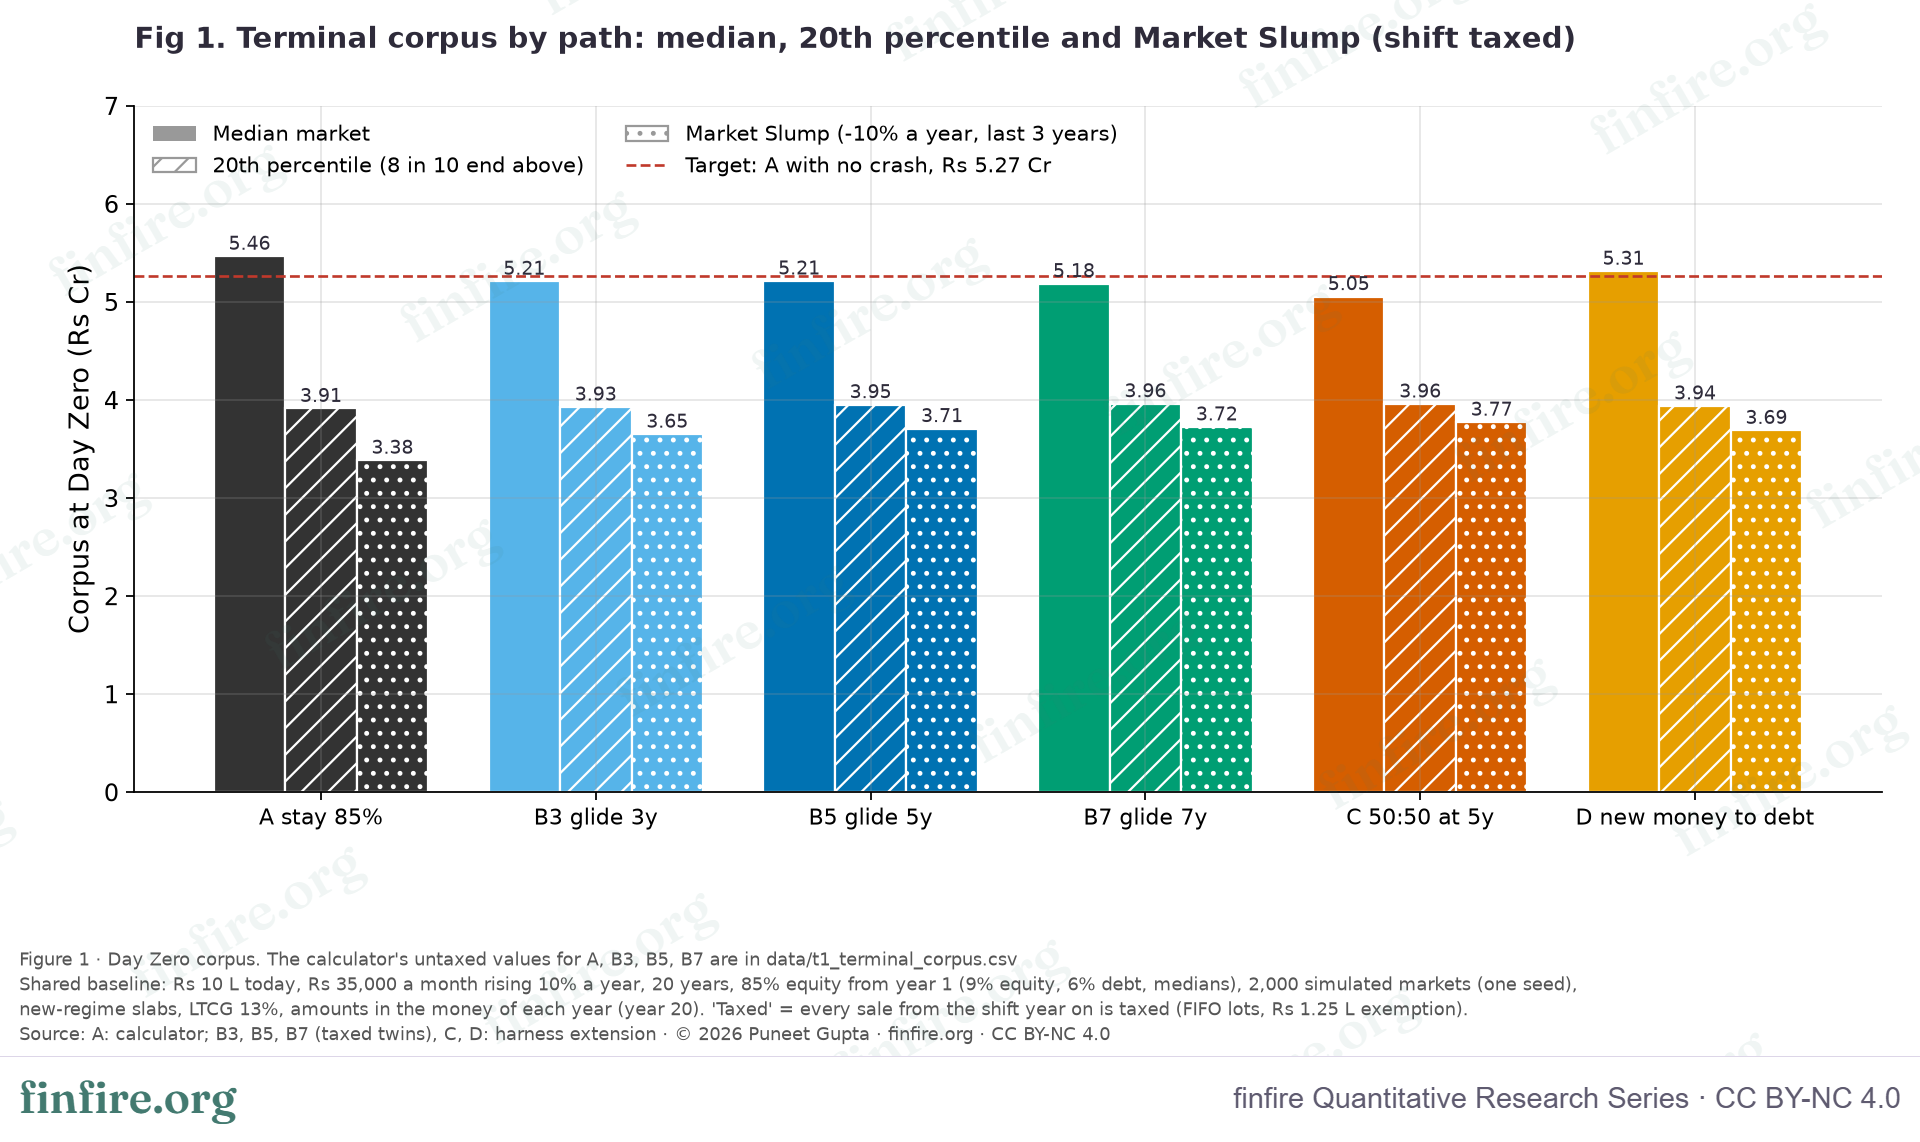
charts/fig1_terminal_corpus_by_path_data.csv.The median of A is ₹5.46 Cr. The median of B5 is ₹5.34 Cr in the calculator and ₹5.21 Cr once the glide sales are taxed. The "last compounding surge" is real, but at this plan size it is not large. Equity beats debt by 3 points a year in our set-up, and part of the balance is new SIP money that has little time to grow.
Table 2. The insurance premium and the cross-over
| Path | Regime | Median given up vs A | % of A | Per year of glide | Steady-return gap | A and path cross at percentile | Path ends ahead of A in |
|---|---|---|---|---|---|---|---|
| B3 | untaxed (calculator rules) | ₹11.6 L | 2.12% | ₹3.9 L | ₹8.2 L | 32.3 | 41.1% |
| B5 | untaxed (calculator rules) | ₹12.3 L | 2.26% | ₹2.5 L | ₹11.8 L | 32.3 | 40.2% |
| B7 | untaxed (calculator rules) | ₹15.6 L | 2.85% | ₹2.2 L | ₹15.1 L | 31.8 | 38.0% |
| C | untaxed (calculator rules) | ₹23.1 L | 4.22% | ₹4.6 L | ₹21.9 L | 32.5 | 38.4% |
| D | untaxed (calculator rules) | ₹15.2 L | 2.79% | ₹3.0 L | ₹7.0 L | 26.1 | 34.6% |
| B3 | shift taxed | ₹25.5 L | 4.66% | ₹8.5 L | ₹22.4 L | 13.2 | 28.5% |
| B5 | shift taxed | ₹25.2 L | 4.61% | ₹5.0 L | ₹24.8 L | 24.9 | 30.0% |
| B7 | shift taxed | ₹27.9 L | 5.10% | ₹4.0 L | ₹26.8 L | 26.3 | 29.0% |
| C | shift taxed | ₹41.2 L | 7.53% | ₹8.2 L | ₹33.9 L | 22.1 | 29.1% |
| D | shift taxed | ₹15.2 L | 2.79% | ₹3.0 L | ₹7.0 L | 26.1 | 34.6% |
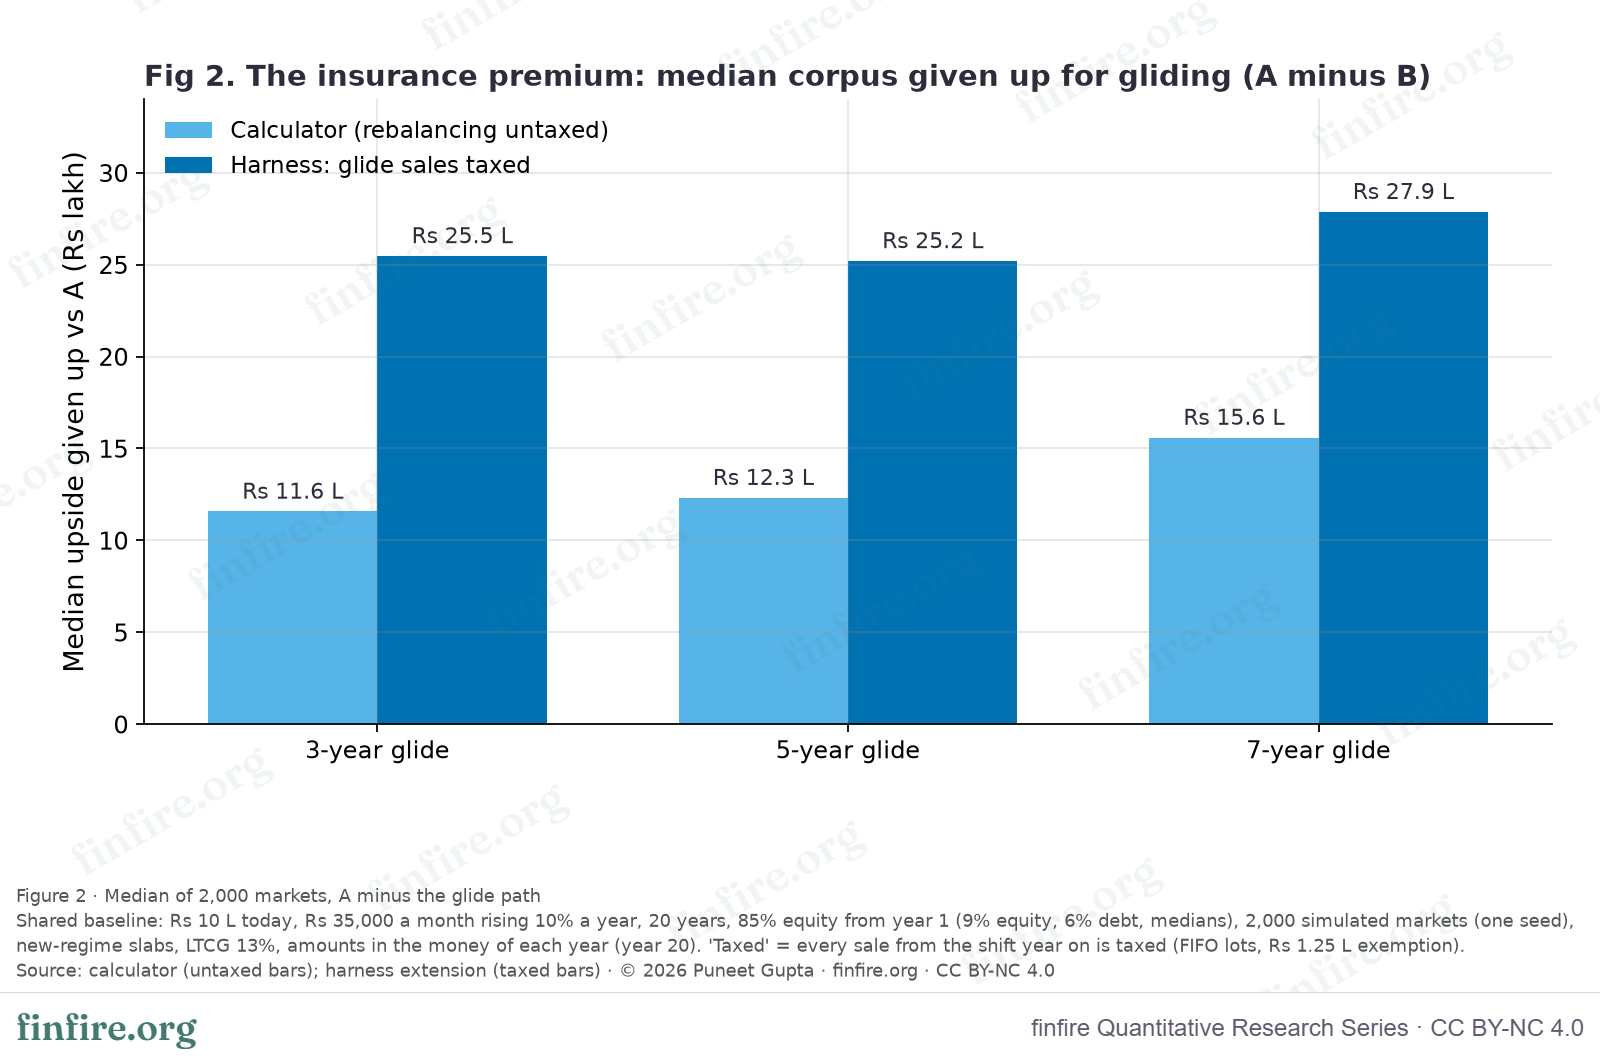
charts/fig2_insurance_premium_data.csv.For B5, the premium is ₹12.3 L (₹2.5 L per year of glide) in the calculator. It is ₹25.2 L (₹5.0 L per year) once the sales are taxed. A longer glide gives up more: B3 gives up ₹11.6 L in the calculator and ₹25.5 L taxed, and B7 gives up ₹15.6 L and ₹27.9 L.
Result 2: the tax claim is right
The calculator cannot show this, because it charges nothing on the glide. Of B5's taxed premium of ₹25.2 L, ₹12.9 L is tax on the glide (median).
Table 3. Tax drag, split out
| Path | Tax at steady returns | Mean over 2,000 markets | Median | 9 in 10 pay less than | Mean if every sale were taxed | Tax on selling all at Day Zero (steady) |
|---|---|---|---|---|---|---|
| B3 | ₹12,25,357 | ₹14,50,747 | ₹11,99,039 | ₹28,16,523 | ₹17,46,553 | ₹29,21,031 |
| B5 | ₹10,49,269 | ₹13,20,519 | ₹10,57,796 | ₹25,93,005 | ₹15,00,921 | ₹31,31,830 |
| B7 | ₹8,93,640 | ₹12,50,343 | ₹9,96,801 | ₹24,74,019 | ₹13,52,929 | ₹33,06,859 |
| C | ₹8,40,058 | ₹15,40,137 | ₹13,18,062 | ₹29,74,454 | ₹17,17,578 | ₹34,76,517 |
| D | ₹0 | ₹0 | ₹0 | ₹0 | ₹1,93,438 | ₹42,07,978 |
| A (no shift) | ₹0 | ₹0 | ₹0 | ₹0 | ₹6,09,624 | ₹40,15,072 |
"Mean if every sale were taxed" also taxes the yearly rebalance back to 85% that all paths do in earlier years. Path A would then pay ₹6,09,624 on average, and lose ₹8.7 L of median.
The tax bill is large because the gain is large. At the start of year 16, before any sale:
| Item (start of year 16, before any sale) | Value | Cost basis | Gain | Gain share |
|---|---|---|---|---|
| Equity | ₹2,24,10,689 | ₹1,20,01,973 | ₹1,04,08,717 | 46.4% |
| Debt funds | ₹38,49,077 | ₹25,94,584 | ₹12,54,493 | 32.6% |
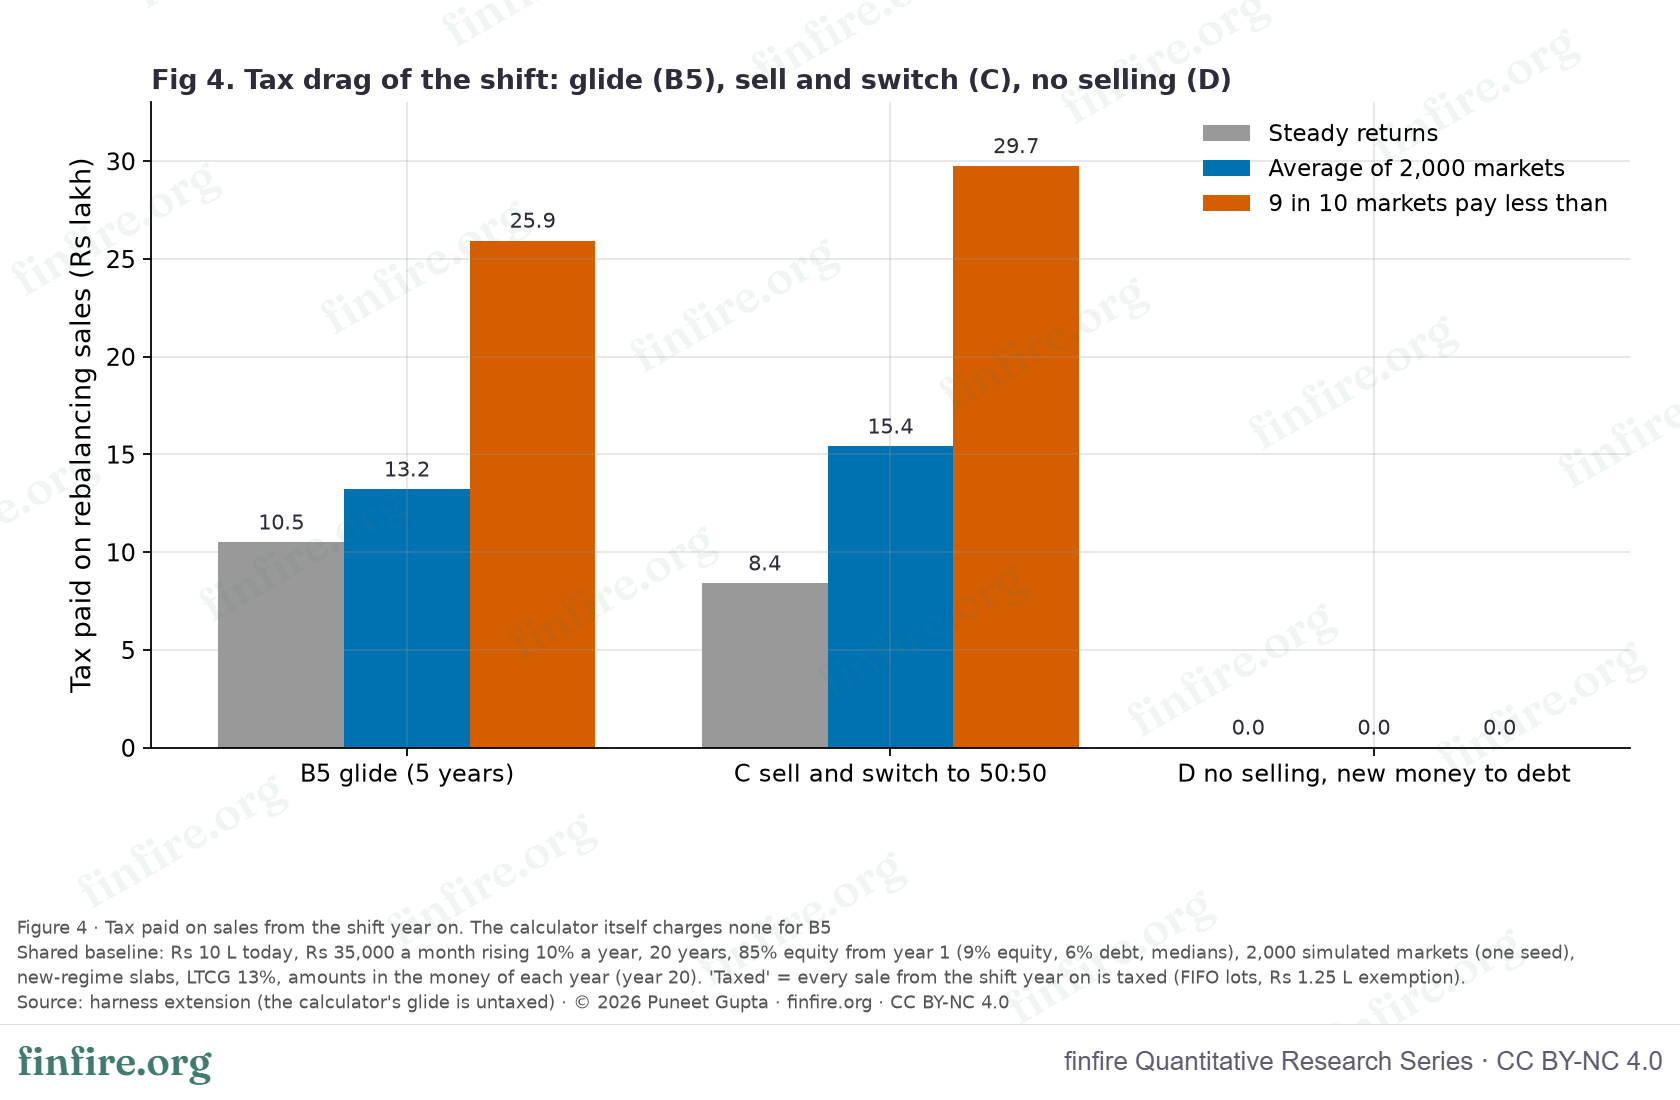
charts/fig4_tax_drag_of_rebalancing_data.csv.Path C pays ₹8,40,058 at steady returns and ₹15,40,137 on average over the markets. B5 pays ₹10,49,269 at steady returns and ₹13,20,519 on average, so C pays less in the steady plan and more across the markets.
Deferring the bill does not remove it. If we sell everything on Day Zero and pay the tax then, the gap between A and B5 in the calculator's rules falls from ₹12.3 L to ₹6.4 L. This happens because A carries more untaxed gain. The taxed gap falls from ₹25.2 L to ₹18.1 L. Even so, the tax paid on the glide still costs about ₹11.8 L, net of the bill it removes later. After a final sale, the medians are A ₹5.07 Cr, B5 ₹4.89 Cr, C ₹4.75 Cr and D ₹4.89 Cr.
The tax rules matter, but not by a lot. We re-ran paths C and B5 under other tax rules.
| Variant | C tax, steady | C tax, mean of markets | B5 tax, steady | B5 tax, mean | C median | B5 median |
|---|---|---|---|---|---|---|
| Base: LTCG 13%, Rs 1.25 L exemption, debt at 31.2% | ₹8,40,058 | ₹15,40,137 | ₹10,49,269 | ₹13,20,519 | ₹5.05 Cr | ₹5.21 Cr |
| All equity gains treated as STCG (20.8%) | ₹15,07,266 | ₹24,08,599 | ₹18,61,195 | ₹22,90,722 | ₹4.95 Cr | ₹5.11 Cr |
| Surcharge variant (LTCG 14.95%, STCG 23.92%, slab 35.88%) | ₹9,71,010 | ₹17,79,370 | ₹12,14,427 | ₹15,29,830 | ₹5.02 Cr | ₹5.19 Cr |
| No LTCG exemption | ₹9,23,309 | ₹15,89,970 | ₹11,33,870 | ₹13,98,093 | ₹5.04 Cr | ₹5.20 Cr |
| Debt gains at a 20.8% slab | ₹8,40,058 | ₹14,41,525 | ₹10,49,269 | ₹13,13,844 | ₹5.06 Cr | ₹5.21 Cr |
If every equity gain were short-term, the B5 median would fall to ₹5.11 Cr.
Result 3: the odds favour staying put
In the calculator, A ends ahead of B5 in 59.9% of markets. Once the glide is taxed, that rises to 70.0%.
The two paths cross at percentile 32.3 in the calculator and 24.9 once taxed. In plain words: B5 does better than A only in the worst third of markets (about the worst quarter, taxed). In the better markets, A is ahead.
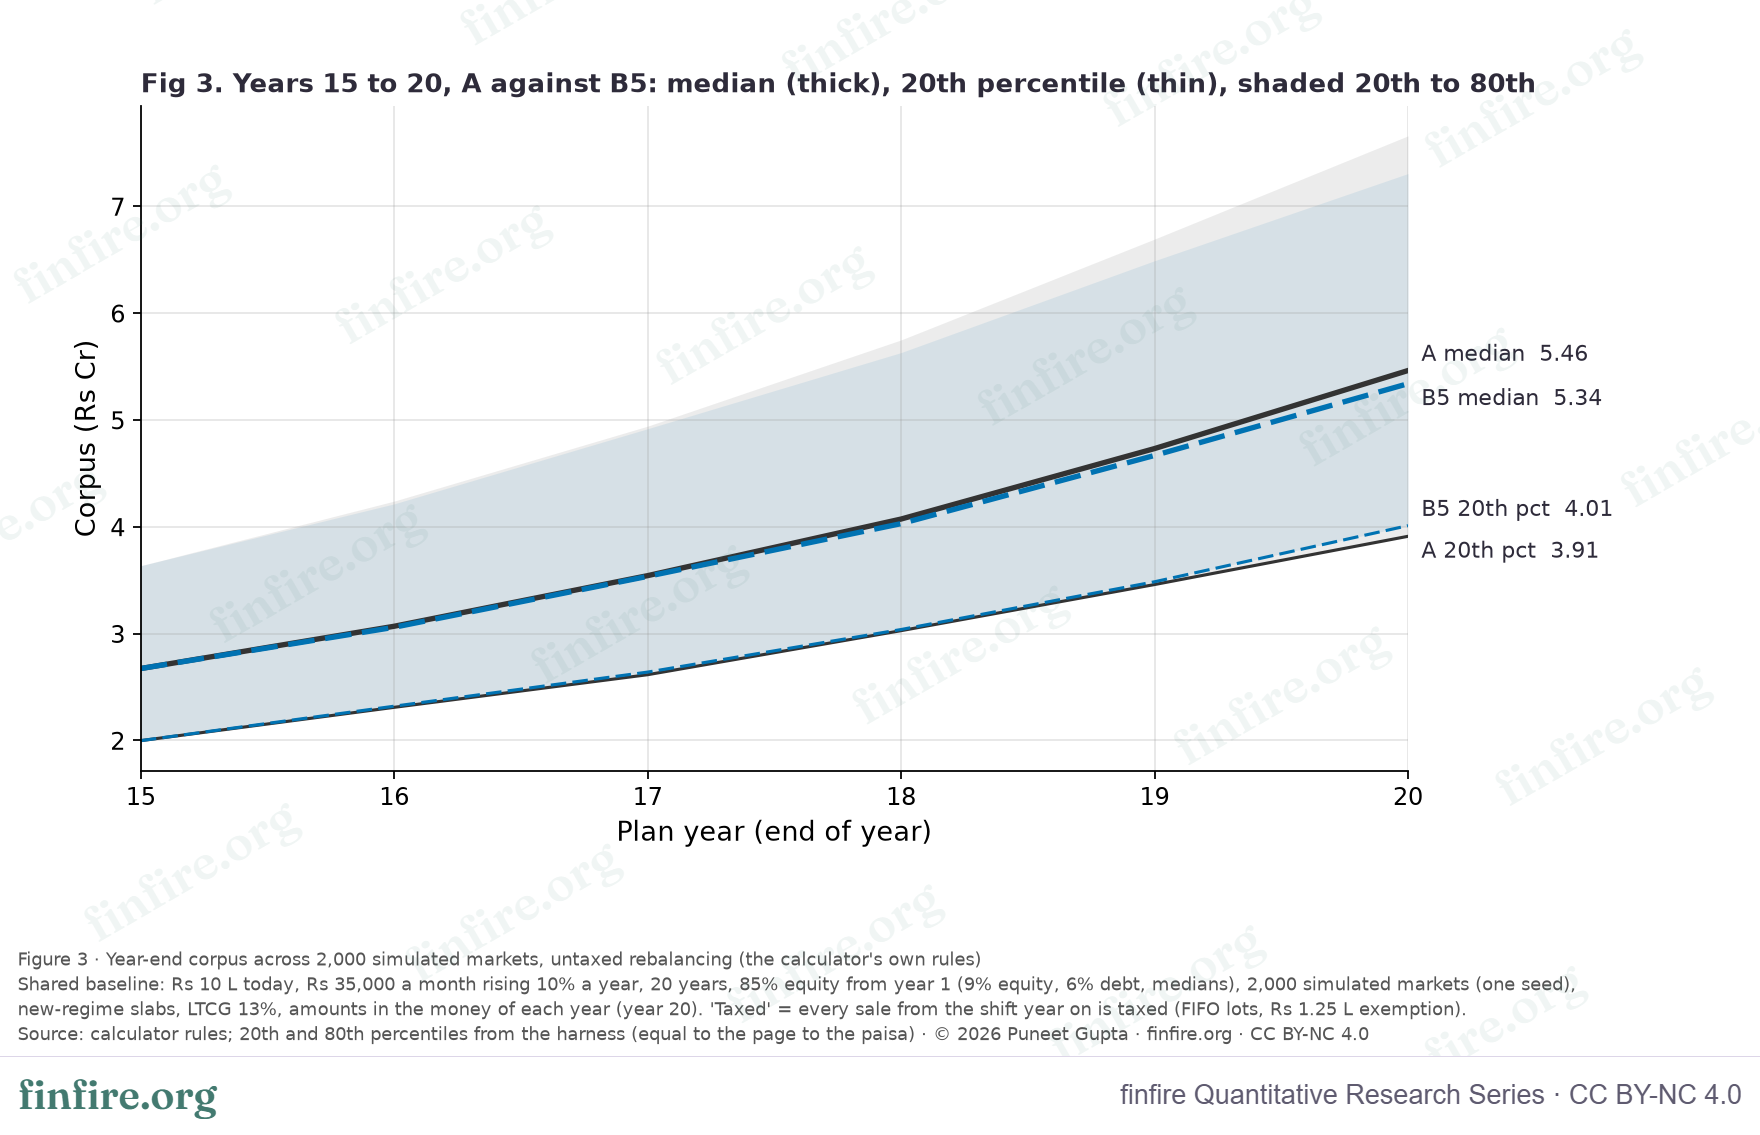
charts/fig3_fan_chart_a_vs_b5_data.csv.A note on the target. A's steady-return corpus (₹5.27 Cr) is below A's median market (₹5.46 Cr). So 46.1% of A's markets end below it.
Result 4: the bad tail favours the glide
The glide does what it says in the weak markets.
- 10th percentile: B5 ₹3.49 Cr against ₹3.32 Cr for A (+5.1%). Taxed, B5 is ₹3.47 Cr (+4.4%).
- 20th percentile: B5 ₹4.01 Cr against ₹3.91 Cr for A.
- Market slump (calculator): A ₹3.38 Cr, B5 ₹3.77 Cr.
A longer glide protects the tail a little more. The 10th percentile is ₹3.45 Cr for B3, ₹3.49 Cr for B5 and ₹3.52 Cr for B7. The price is a lower median.
Result 5: crash timing decides everything
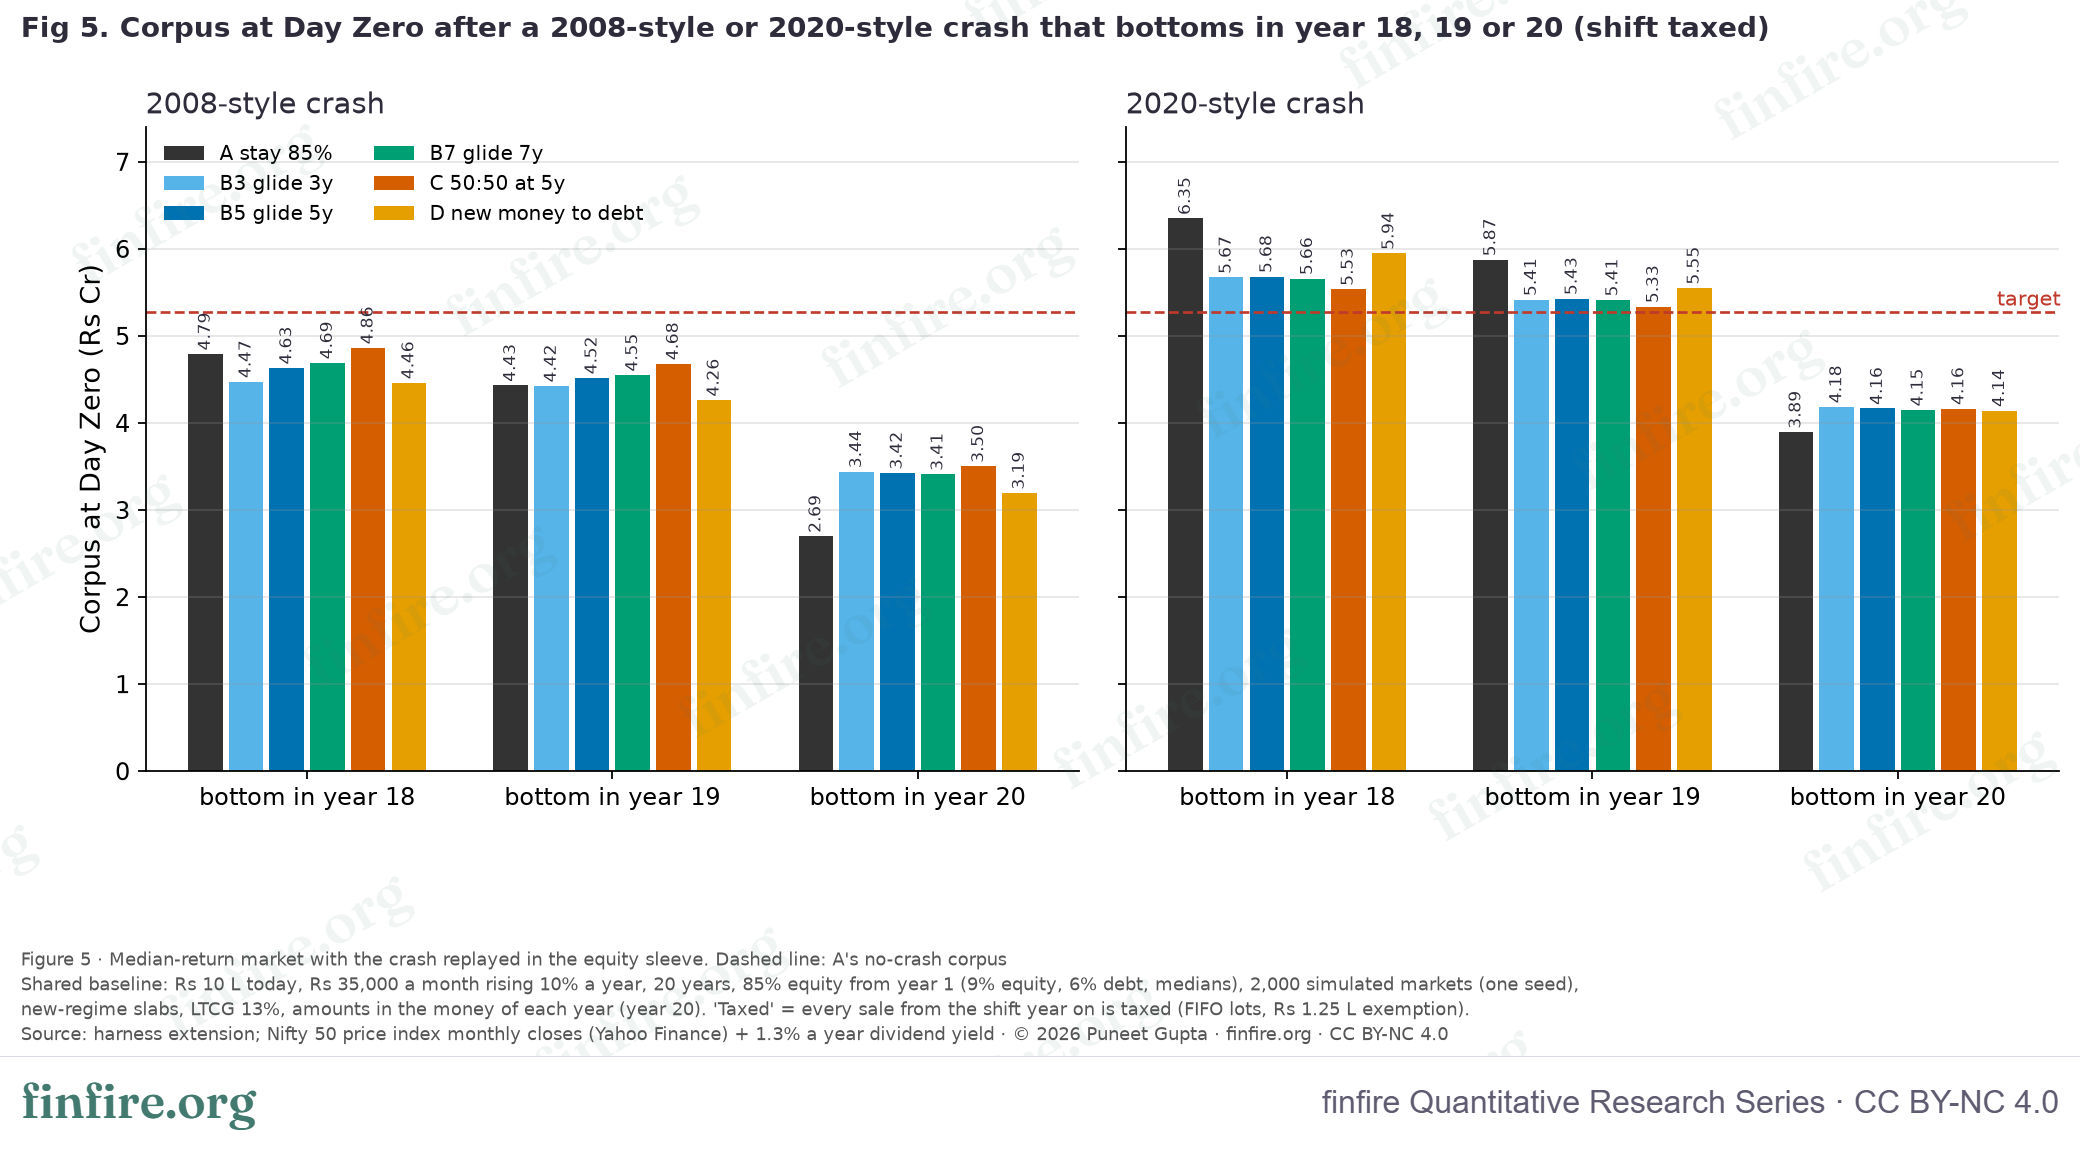
We replayed a 2008-style and a 2020-style crash with the bottom in year 18, 19 or 20. We then measured how many extra years each path needs to reach the target. The table below shows delay in years. The full table is in the appendix.
Table 4a. Years of retirement delay (shift taxed)
| Scenario | A | B3 | B5 | B7 | C | D |
|---|---|---|---|---|---|---|
| 2008-style, bottom in year 18 | 0.68 | 1.24 | 0.99 | 0.90 | 0.63 | 1.23 |
| 2008-style, bottom in year 19 | 1.22 | 1.37 | 1.23 | 1.18 | 0.98 | 1.55 |
| 2008-style, bottom in year 20 | 3.98 | 3.06 | 3.10 | 3.13 | 2.99 | 3.36 |
| 2020-style, bottom in year 18 | 0.00 | 0.00 | 0.00 | 0.00 | 0.00 | 0.00 |
| 2020-style, bottom in year 19 | 0.00 | 0.00 | 0.00 | 0.00 | 0.00 | 0.00 |
| 2020-style, bottom in year 20 | 2.05 | 1.80 | 1.83 | 1.85 | 1.85 | 1.76 |
| Market Slump (calculator) | 2.85 | 2.61 | 2.52 | 2.49 | 2.41 | 2.49 |
charts/fig5_crash_corpus_at_day_zero_data.csv.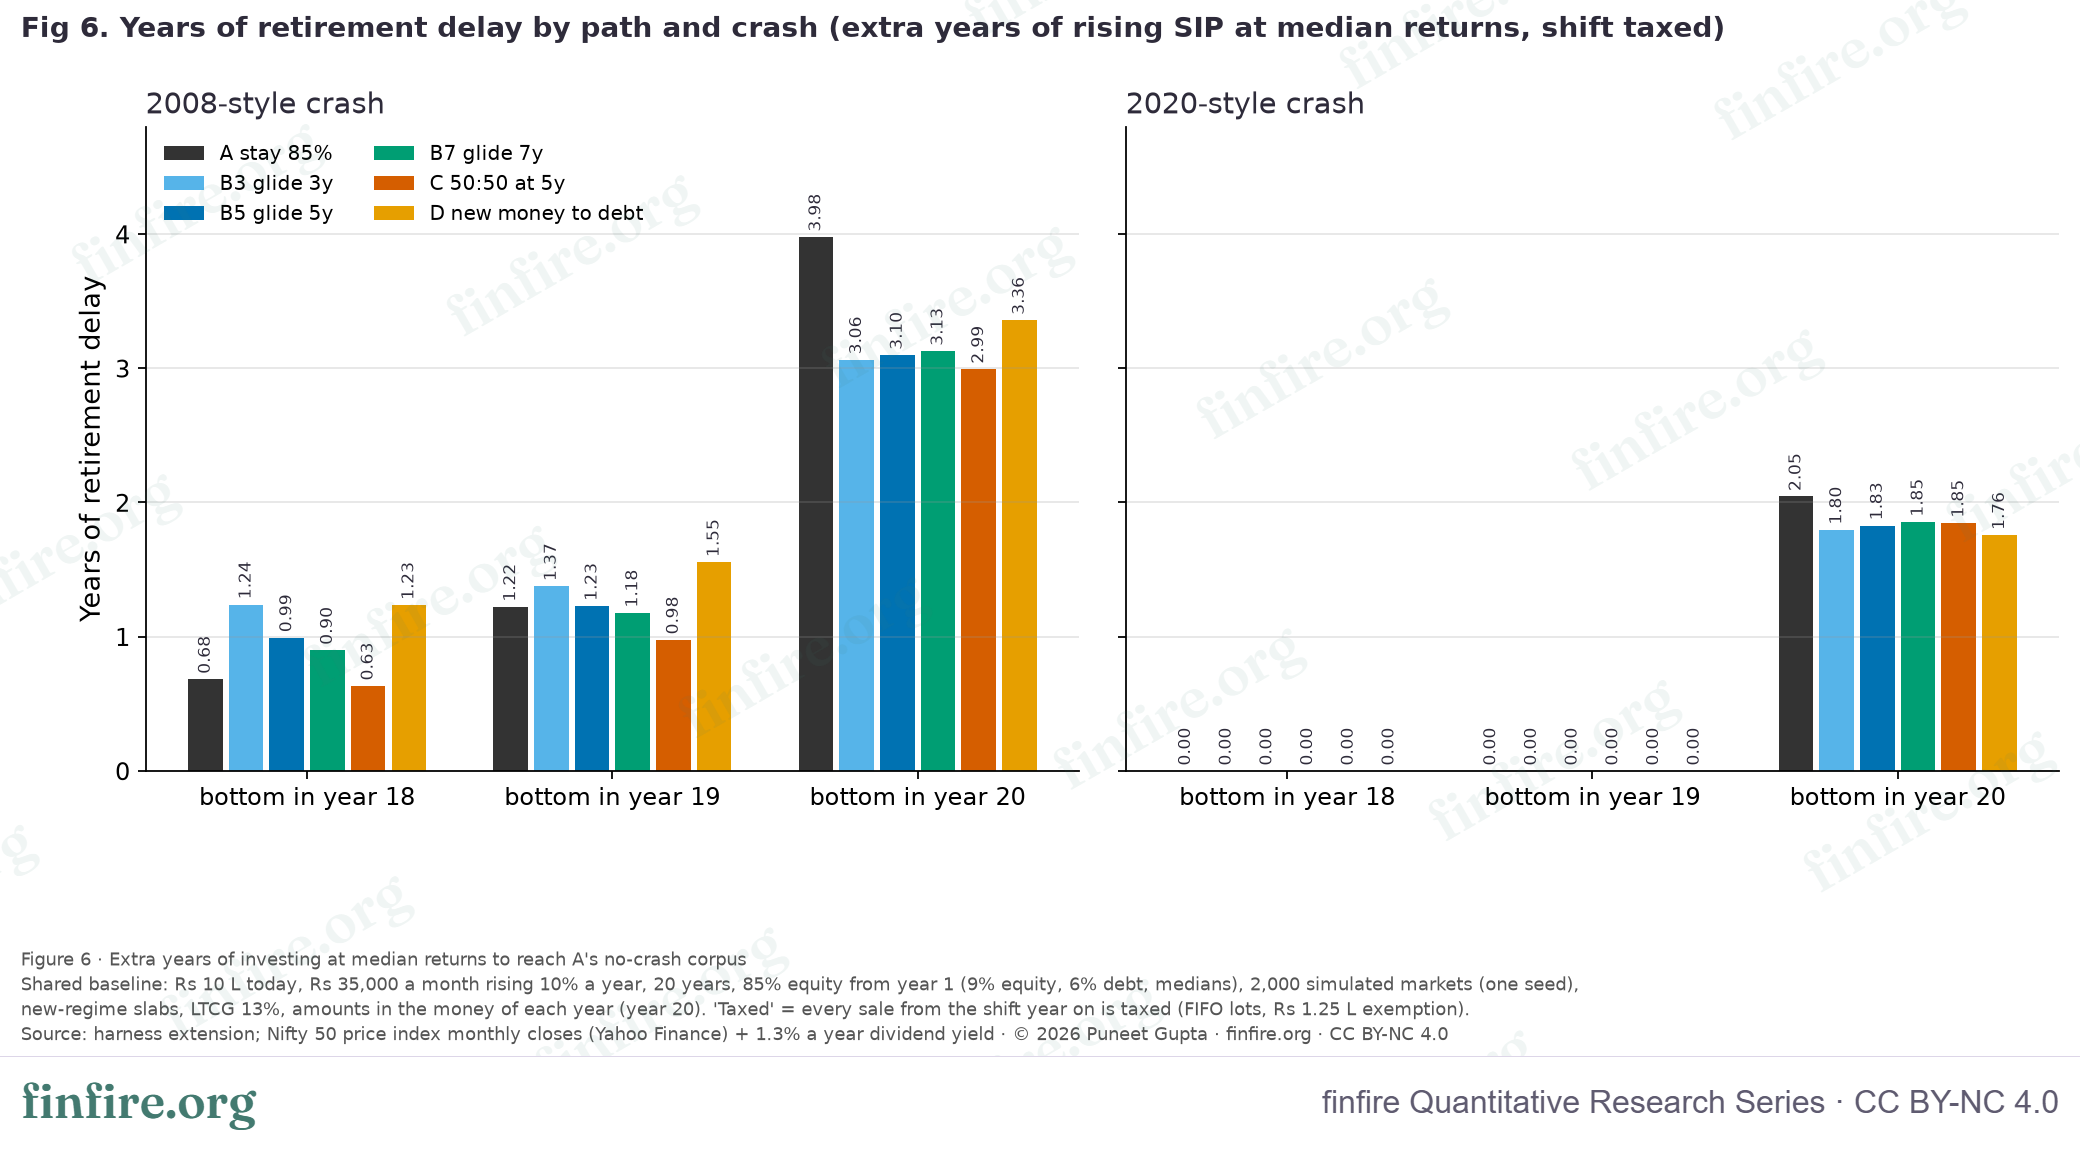
charts/fig6_years_of_delay_data.csv.What the table shows:
- A crash that bottoms on Day Zero is where the glide pays. After a 2008-style fall, A has ₹2.69 Cr and is 3.98 years from the target. B5 has ₹3.42 Cr and is 3.10 years away. After a 2020-style fall at Day Zero, A needs 2.05 years and B5 needs 1.83.
- An earlier crash can make the glide worse. With a 2008-style bottom in year 18, A is 0.68 years from the target. B3 (1.24), B5 (0.99), B7 (0.90) and D (1.23) are all further away. Path C is the exception at 0.63. With the bottom in year 19, B3 and D are worse than A, B5 is about level (1.23 against 1.22) and B7 is slightly better (1.18). A likely reason is that a glide keeps selling equity after the bottom, so it gets less of the rebound. The data show the result, not the reason.
- A 2020-style crash that bottoms in year 18 or 19 is harmless for every path. All of them end above the target.
- Path C does well in the 2008 replays. It has the shortest delay at every 2008 timing (0.63, 0.98, 2.99 years) and in the Market slump (2.41). That protection costs the most: ₹41.2 L of median.
- Path D gives little help. It avoids 0.00 years of delay on average over the six replays. In the worst timing it avoids 0.62.
"Delay with the rebound" counts the 24 months of recovery after the bottom. It matters when the bottom falls in year 19 or 20, because part of the recovery then comes after Day Zero. For a 2008-style bottom in year 20, A's delay falls from 3.98 to 1.30 years, and B5's from 3.10 to 0.83.
Result 6: premium against protection
How much median does each path give up for each year of delay it prevents? Table 5a shows path B5. The full table is in the appendix.
Table 5a. B5: premium against protection
| Scenario | Median given up (taxed) | Delay years, A | Delay years, B5 | Delay avoided | Median given up per year avoided |
|---|---|---|---|---|---|
| 2008-y18 | ₹25.2 L | 0.68 | 0.99 | -0.31 | not above 0.1 year |
| 2008-y19 | ₹25.2 L | 1.22 | 1.23 | -0.01 | not above 0.1 year |
| 2008-y20 | ₹25.2 L | 3.98 | 3.10 | 0.88 | ₹28.6 L |
| 2020-y18 | ₹25.2 L | 0.00 | 0.00 | 0.00 | not above 0.1 year |
| 2020-y19 | ₹25.2 L | 0.00 | 0.00 | 0.00 | not above 0.1 year |
| 2020-y20 | ₹25.2 L | 2.05 | 1.83 | 0.22 | ₹115.8 L |
| slump | ₹25.2 L | 2.85 | 2.52 | 0.33 | ₹76.6 L |
| average of six replays | ₹25.2 L | 1.32 | 1.19 | 0.13 | ₹193.3 L |
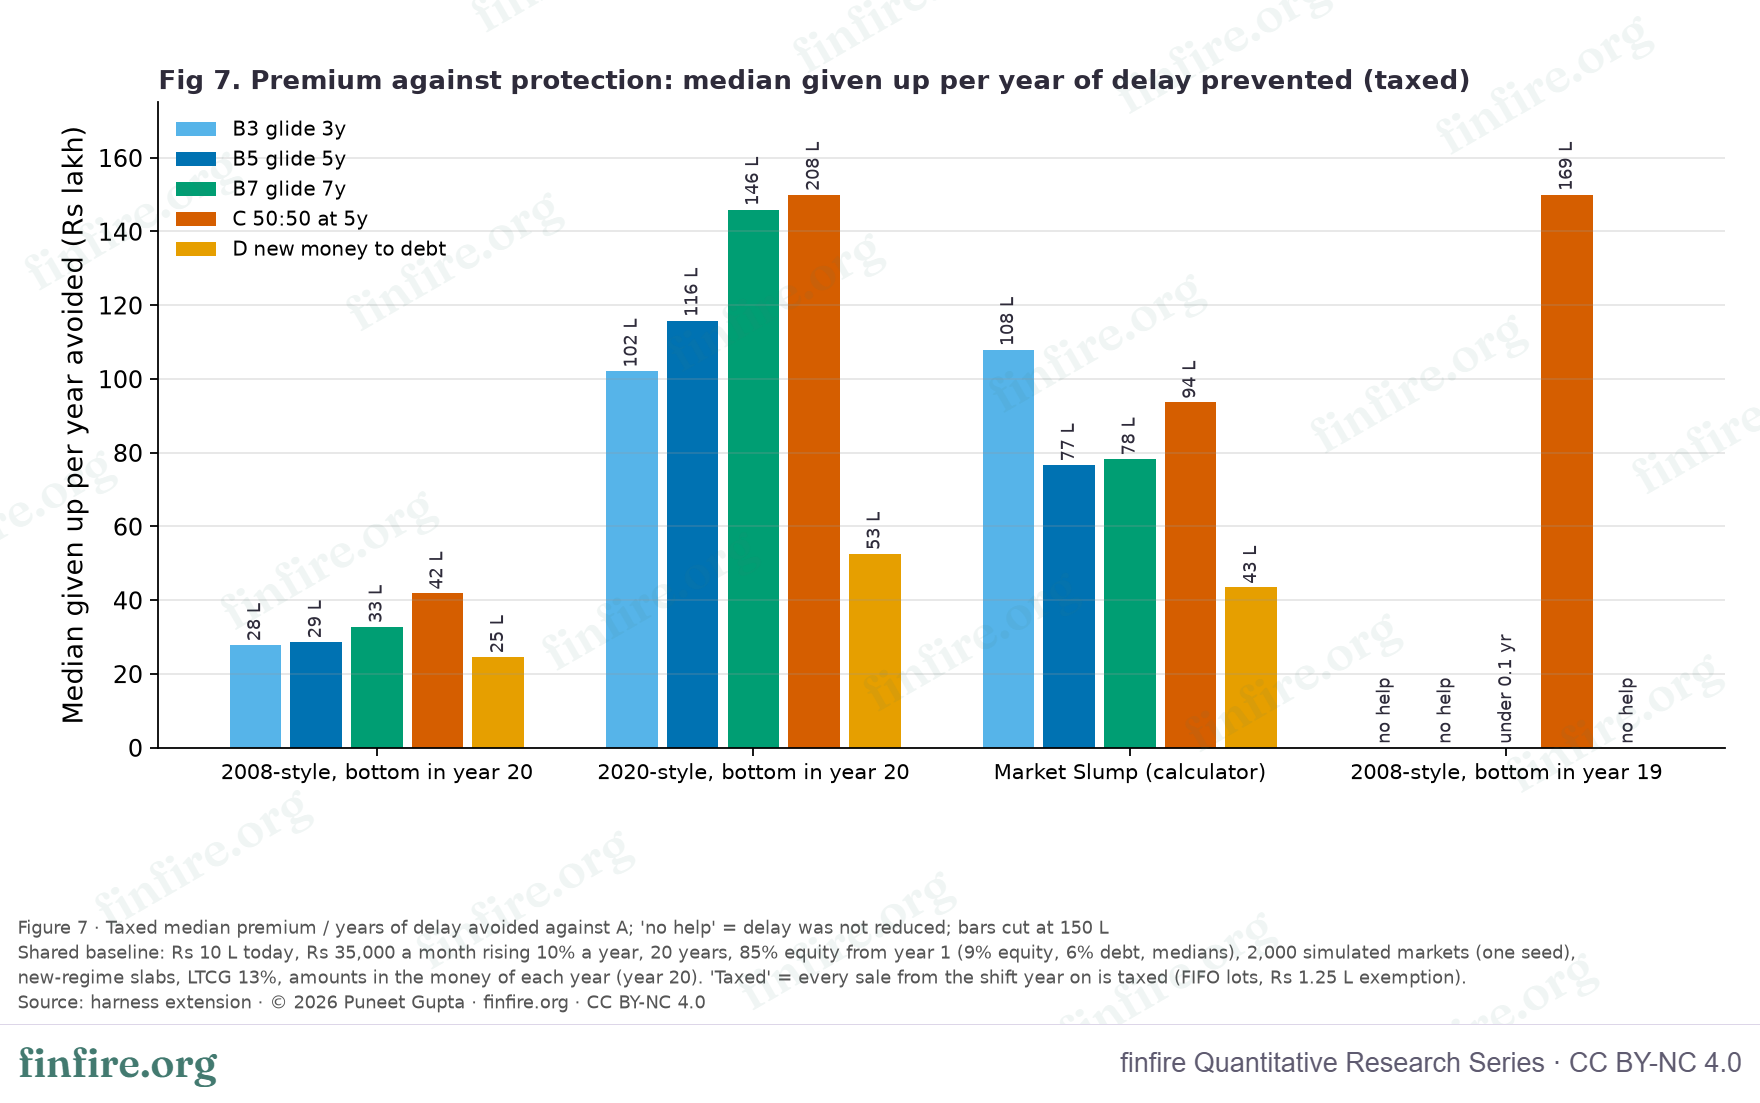
charts/fig7_premium_vs_protection_data.csv.In the best case for the glide, a 2008-style crash that bottoms on Day Zero, B5 gives up ₹28.6 L of median for each year of delay avoided. In a 2020-style crash on Day Zero, it gives up ₹115.8 L per year avoided. In the calculator's Market slump, the figure is ₹76.6 L. Averaged over the six replays, B5 avoids 0.13 years of delay, and the premium works out to ₹193.3 L per year avoided.
The other paths:
- B3 avoids 0.91 years in its best timing (₹27.9 L per year avoided) and 0.08 on average.
- B7 avoids 0.85 years in its best timing (₹32.8 L per year avoided) and 0.14 on average.
- C avoids 0.98 years in its best timing (₹41.8 L per year avoided) and 0.25 on average.
- D avoids 0.62 years in its best timing (₹24.6 L per year avoided) and 0.00 on average.
What this means for you
This is a description of one plan, not advice.
- Both sides have a point. The investor is right that the glide costs median corpus, that tax is a big part of the cost, and that staying put wins in most markets. The planner is right that the glide lifts the bad tail and the slump.
- The premium is a few percent. For B5 it is 2.26% of the median in the calculator and 4.61% once tax is counted. About half of the taxed figure is tax, which the calculator does not show.
- What the insurance pays depends on when the crash comes. In the six replays, B5 helps clearly only when the bottom falls on Day Zero. A 2008-style crash in year 18 leaves B3, B5, B7 and D further from the target than staying put, and in year 19 it does the same to B3 and D.
- You cannot have the protection without the tax or the cost. Path D pays no tax, but it only reaches 66.4% equity and avoids no delay on average. Path C reaches 50:50 at once and has the shortest delay in the 2008 replays, but it gives up ₹41.2 L.
- Check your own numbers. Your cost basis, your tax slab, your SIP and your years to go will move the premium. The "Try this scenario yourself" section shows how to run your own plan.
Limitations
- One baseline, one seed. A different corpus, SIP or equity share will give different numbers.
- The calculator charges no tax on its glide. Taxed results come from the harness, which uses first-in-first-out lots, a 31.2% slab rate on debt gains and the tax rules listed above.
- Six crash replays are six paths, not a distribution. Monthly closes miss the lows inside a month. The crashes use the Nifty 50 price index plus a 1.3% yield, not a total-return file.
- The target (₹5.27 Cr) is below the median market (₹5.46 Cr), so it is not a conservative goal.
- The 20th percentile comes from the harness. The calculator page shows the 10th, 50th and 90th.
- Not modelled: credit events, exit loads, carry-forward of losses, the 87A rebate, and what happens after Day Zero.
- This paper describes results. It is not financial advice.
Try this scenario yourself
Compare (Pro), Equity and debt (Pro) and Simulated markets (Pro) need a Pro account, signed in. Compare keeps Plan A only in the open tab, so each setup opens one link, pins it, then changes fields on the same page. Under every link, set Show amounts in to Money of each year.
Setup 1 · Stay at 85% to the end, or glide the last 5 years? (same inputs) · Pro
Step 1 · Open Path A. ₹10 L today, ₹35,000 a month, Yearly raise 10%, 20 years, Equity share 85% all the way. → Open
Step 2 · Pin it. Open Compare (Pro) and press Pin this plan (create a baseline plan to compare). It becomes Plan A, a dashed line.
Step 3 · Add the glide. Under Equity and debt, tick Glide to a smaller equity share, set Equity share when you stop to 55 and Start gliding to 5. Or open the finished plan: Open Path B5
Step 4 · Read the answer. Steady returns: A Rs 5.27 Cr, B5 Rs 5.15 Cr. Median of the 2,000 markets: A Rs 5.46 Cr, B5 Rs 5.34 Cr. 10th percentile: A Rs 3.32 Cr, B5 Rs 3.49 Cr. Market slump: A Rs 3.38 Cr, B5 Rs 3.77 Cr.
Step 5 · Take off the tax yourself (outside the calculator). The calculator charges no tax on the glide. With the glide sales taxed (FIFO lots, 13% LTCG after ₹1.25 L), the harness gives B5 a median of ₹5.21 Cr and ₹10,49,269 of tax at steady returns.
Setup 2 · How long should the glide be? 3, 5 or 7 years · Pro
Step 1 · Open Path B5. → Open and pin it.
Step 2 · Shorten it. Set Start gliding to 3. Or: Open Path B3
Step 3 · Lengthen it. Set Start gliding to 7. Or: Open Path B7
Step 4 · Read the gap. Median of markets: B3 Rs 5.35 Cr, B5 Rs 5.34 Cr, B7 Rs 5.31 Cr. 10th percentile: B3 Rs 3.45 Cr, B5 Rs 3.49 Cr, B7 Rs 3.52 Cr. Market slump: B3 Rs 3.72 Cr, B5 Rs 3.77 Cr, B7 Rs 3.78 Cr. A longer glide gives up more of the median and protects the bad tail and the slump a little more.
Step 5 · Put in your numbers. Use your corpus, SIP, years and equity share, then repeat. Remember that the tax on the sales is not in the calculator.
Reproducibility
Every number in this paper can be checked.
- Calculator links. The four links in "Try this scenario yourself" (paths A, B3, B5 and B7) are listed in urls.csv, below this section, with the plan each opens and the answer it gives. Each was opened in a fresh copy of the real page and its share link was read back: 20 of 20 values match to the paisa (the steady-return corpus, the 10th percentile, the median, the 90th percentile and the Market slump, for each of the four links).
- Harness. The harness re-runs the page's own yearly steps on tax lots. With tax switched off it matches the calculator to the paisa for A, B3, B5 and B7: in the steady-return plan, in every one of the 2,000 markets and in the Market slump.
- Independent check. A separate Python program with no shared code re-computed 42 headline numbers (steady-return corpus, tax paid, 10th percentile, median, 90th percentile and average tax, for six path and tax combinations) from the calculator's published random-number rules: 42 of 42 match.
- Same answer every time. We ran the whole analysis twice from scratch. Both runs gave identical results.
- Markets. Seed 20260927, 2,000 markets, the same markets for every path.
- Figures. The numbers drawn in each figure are in the CSV named in its caption.
Harness-only results (paths C and D, every taxed twin, the 20th percentile and the crash replays) have no one-click link. The nearest calculator view is in "Try this scenario yourself".
The text, data and figures are © 2026 Puneet Gupta · finfire.org, licensed CC BY-NC 4.0. The calculators and engine code are not covered.
Appendix
Table 4. Crash replays (full)
| Scenario | Path | Day Zero corpus | Shortfall vs target | Delay (years) | Delay with the rebound (years) | Day Zero corpus, untaxed | Delay untaxed (years) |
|---|---|---|---|---|---|---|---|
| 2008-style, bottom in year 18 | A | ₹4.79 Cr | ₹0.48 Cr | 0.68 | 0.68 | ₹4.79 Cr | 0.68 |
| 2008-style, bottom in year 18 | B3 | ₹4.47 Cr | ₹0.79 Cr | 1.24 | 1.24 | ₹4.65 Cr | 0.95 |
| 2008-style, bottom in year 18 | B5 | ₹4.63 Cr | ₹0.64 Cr | 0.99 | 0.99 | ₹4.85 Cr | 0.64 |
| 2008-style, bottom in year 18 | B7 | ₹4.69 Cr | ₹0.58 Cr | 0.90 | 0.90 | ₹4.91 Cr | 0.53 |
| 2008-style, bottom in year 18 | C | ₹4.86 Cr | ₹0.41 Cr | 0.63 | 0.63 | ₹5.12 Cr | 0.22 |
| 2008-style, bottom in year 18 | D | ₹4.46 Cr | ₹0.81 Cr | 1.23 | 1.23 | ₹4.46 Cr | 1.23 |
| 2008-style, bottom in year 19 | A | ₹4.43 Cr | ₹0.84 Cr | 1.22 | 0.79 | ₹4.43 Cr | 1.22 |
| 2008-style, bottom in year 19 | B3 | ₹4.42 Cr | ₹0.84 Cr | 1.37 | 0.89 | ₹4.58 Cr | 1.05 |
| 2008-style, bottom in year 19 | B5 | ₹4.52 Cr | ₹0.75 Cr | 1.23 | 0.81 | ₹4.71 Cr | 0.86 |
| 2008-style, bottom in year 19 | B7 | ₹4.55 Cr | ₹0.72 Cr | 1.18 | 0.81 | ₹4.74 Cr | 0.80 |
| 2008-style, bottom in year 19 | C | ₹4.68 Cr | ₹0.59 Cr | 0.98 | 0.78 | ₹4.91 Cr | 0.55 |
| 2008-style, bottom in year 19 | D | ₹4.26 Cr | ₹1.01 Cr | 1.55 | 1.21 | ₹4.26 Cr | 1.55 |
| 2008-style, bottom in year 20 | A | ₹2.69 Cr | ₹2.57 Cr | 3.98 | 1.30 | ₹2.69 Cr | 3.98 |
| 2008-style, bottom in year 20 | B3 | ₹3.44 Cr | ₹1.83 Cr | 3.06 | 0.82 | ₹3.53 Cr | 2.75 |
| 2008-style, bottom in year 20 | B5 | ₹3.42 Cr | ₹1.85 Cr | 3.10 | 0.83 | ₹3.51 Cr | 2.79 |
| 2008-style, bottom in year 20 | B7 | ₹3.41 Cr | ₹1.86 Cr | 3.13 | 0.99 | ₹3.49 Cr | 2.83 |
| 2008-style, bottom in year 20 | C | ₹3.50 Cr | ₹1.77 Cr | 2.99 | 0.99 | ₹3.58 Cr | 2.69 |
| 2008-style, bottom in year 20 | D | ₹3.19 Cr | ₹2.08 Cr | 3.36 | 1.56 | ₹3.19 Cr | 3.36 |
| 2020-style, bottom in year 18 | A | ₹6.35 Cr | ₹0.00 Cr | 0.00 | 0.00 | ₹6.35 Cr | 0.00 |
| 2020-style, bottom in year 18 | B3 | ₹5.67 Cr | ₹0.00 Cr | 0.00 | 0.00 | ₹5.84 Cr | 0.00 |
| 2020-style, bottom in year 18 | B5 | ₹5.68 Cr | ₹0.00 Cr | 0.00 | 0.00 | ₹5.87 Cr | 0.00 |
| 2020-style, bottom in year 18 | B7 | ₹5.66 Cr | ₹0.00 Cr | 0.00 | 0.00 | ₹5.86 Cr | 0.00 |
| 2020-style, bottom in year 18 | C | ₹5.53 Cr | ₹0.00 Cr | 0.00 | 0.00 | ₹5.80 Cr | 0.00 |
| 2020-style, bottom in year 18 | D | ₹5.94 Cr | ₹0.00 Cr | 0.00 | 0.00 | ₹5.94 Cr | 0.00 |
| 2020-style, bottom in year 19 | A | ₹5.87 Cr | ₹0.00 Cr | 0.00 | 0.00 | ₹5.87 Cr | 0.00 |
| 2020-style, bottom in year 19 | B3 | ₹5.41 Cr | ₹0.00 Cr | 0.00 | 0.00 | ₹5.52 Cr | 0.00 |
| 2020-style, bottom in year 19 | B5 | ₹5.43 Cr | ₹0.00 Cr | 0.00 | 0.00 | ₹5.56 Cr | 0.00 |
| 2020-style, bottom in year 19 | B7 | ₹5.41 Cr | ₹0.00 Cr | 0.00 | 0.00 | ₹5.56 Cr | 0.00 |
| 2020-style, bottom in year 19 | C | ₹5.33 Cr | ₹0.00 Cr | 0.00 | 0.00 | ₹5.54 Cr | 0.00 |
| 2020-style, bottom in year 19 | D | ₹5.55 Cr | ₹0.00 Cr | 0.00 | 0.00 | ₹5.55 Cr | 0.00 |
| 2020-style, bottom in year 20 | A | ₹3.89 Cr | ₹1.37 Cr | 2.05 | 0.57 | ₹3.89 Cr | 2.05 |
| 2020-style, bottom in year 20 | B3 | ₹4.18 Cr | ₹1.08 Cr | 1.80 | 0.60 | ₹4.30 Cr | 1.50 |
| 2020-style, bottom in year 20 | B5 | ₹4.16 Cr | ₹1.10 Cr | 1.83 | 0.61 | ₹4.27 Cr | 1.55 |
| 2020-style, bottom in year 20 | B7 | ₹4.15 Cr | ₹1.12 Cr | 1.85 | 0.61 | ₹4.24 Cr | 1.59 |
| 2020-style, bottom in year 20 | C | ₹4.16 Cr | ₹1.10 Cr | 1.85 | 0.62 | ₹4.26 Cr | 1.57 |
| 2020-style, bottom in year 20 | D | ₹4.14 Cr | ₹1.13 Cr | 1.76 | 0.59 | ₹4.14 Cr | 1.76 |
| Market Slump (calculator) | A | ₹3.38 Cr | ₹1.88 Cr | 2.85 | – | ₹3.38 Cr | 2.85 |
| Market Slump (calculator) | B3 | ₹3.65 Cr | ₹1.62 Cr | 2.61 | – | ₹3.72 Cr | 2.44 |
| Market Slump (calculator) | B5 | ₹3.71 Cr | ₹1.56 Cr | 2.52 | – | ₹3.77 Cr | 2.36 |
| Market Slump (calculator) | B7 | ₹3.72 Cr | ₹1.54 Cr | 2.49 | – | ₹3.78 Cr | 2.34 |
| Market Slump (calculator) | C | ₹3.77 Cr | ₹1.49 Cr | 2.41 | – | ₹3.91 Cr | 2.15 |
| Market Slump (calculator) | D | ₹3.69 Cr | ₹1.58 Cr | 2.49 | – | ₹3.69 Cr | 2.49 |
Table 5. Premium against protection (full)
| Path | Scenario | Median given up (taxed) | Delay years, A | Delay years, path | Delay avoided | Median given up per year avoided |
|---|---|---|---|---|---|---|
| B3 | 2008-y18 | ₹25.5 L | 0.68 | 1.24 | -0.56 | not above 0.1 year |
| B3 | 2008-y19 | ₹25.5 L | 1.22 | 1.37 | -0.15 | not above 0.1 year |
| B3 | 2008-y20 | ₹25.5 L | 3.98 | 3.06 | 0.91 | ₹27.9 L |
| B3 | 2020-y18 | ₹25.5 L | 0.00 | 0.00 | 0.00 | not above 0.1 year |
| B3 | 2020-y19 | ₹25.5 L | 0.00 | 0.00 | 0.00 | not above 0.1 year |
| B3 | 2020-y20 | ₹25.5 L | 2.05 | 1.80 | 0.25 | ₹102.1 L |
| B3 | slump | ₹25.5 L | 2.85 | 2.61 | 0.24 | ₹107.9 L |
| B3 | average of six replays | ₹25.5 L | 1.32 | 1.25 | 0.08 | not above 0.1 year |
| B5 | 2008-y18 | ₹25.2 L | 0.68 | 0.99 | -0.31 | not above 0.1 year |
| B5 | 2008-y19 | ₹25.2 L | 1.22 | 1.23 | -0.01 | not above 0.1 year |
| B5 | 2008-y20 | ₹25.2 L | 3.98 | 3.10 | 0.88 | ₹28.6 L |
| B5 | 2020-y18 | ₹25.2 L | 0.00 | 0.00 | 0.00 | not above 0.1 year |
| B5 | 2020-y19 | ₹25.2 L | 0.00 | 0.00 | 0.00 | not above 0.1 year |
| B5 | 2020-y20 | ₹25.2 L | 2.05 | 1.83 | 0.22 | ₹115.8 L |
| B5 | slump | ₹25.2 L | 2.85 | 2.52 | 0.33 | ₹76.6 L |
| B5 | average of six replays | ₹25.2 L | 1.32 | 1.19 | 0.13 | ₹193.3 L |
| B7 | 2008-y18 | ₹27.9 L | 0.68 | 0.90 | -0.22 | not above 0.1 year |
| B7 | 2008-y19 | ₹27.9 L | 1.22 | 1.18 | 0.04 | not above 0.1 year |
| B7 | 2008-y20 | ₹27.9 L | 3.98 | 3.13 | 0.85 | ₹32.8 L |
| B7 | 2020-y18 | ₹27.9 L | 0.00 | 0.00 | 0.00 | not above 0.1 year |
| B7 | 2020-y19 | ₹27.9 L | 0.00 | 0.00 | 0.00 | not above 0.1 year |
| B7 | 2020-y20 | ₹27.9 L | 2.05 | 1.85 | 0.19 | ₹145.9 L |
| B7 | slump | ₹27.9 L | 2.85 | 2.49 | 0.36 | ₹78.2 L |
| B7 | average of six replays | ₹27.9 L | 1.32 | 1.18 | 0.14 | ₹192.3 L |
| C | 2008-y18 | ₹41.2 L | 0.68 | 0.63 | 0.05 | not above 0.1 year |
| C | 2008-y19 | ₹41.2 L | 1.22 | 0.98 | 0.24 | ₹168.7 L |
| C | 2008-y20 | ₹41.2 L | 3.98 | 2.99 | 0.98 | ₹41.8 L |
| C | 2020-y18 | ₹41.2 L | 0.00 | 0.00 | 0.00 | not above 0.1 year |
| C | 2020-y19 | ₹41.2 L | 0.00 | 0.00 | 0.00 | not above 0.1 year |
| C | 2020-y20 | ₹41.2 L | 2.05 | 1.85 | 0.20 | ₹207.6 L |
| C | slump | ₹41.2 L | 2.85 | 2.41 | 0.44 | ₹93.6 L |
| C | average of six replays | ₹41.2 L | 1.32 | 1.08 | 0.25 | ₹167.3 L |
| D | 2008-y18 | ₹15.2 L | 0.68 | 1.23 | -0.55 | not above 0.1 year |
| D | 2008-y19 | ₹15.2 L | 1.22 | 1.55 | -0.33 | not above 0.1 year |
| D | 2008-y20 | ₹15.2 L | 3.98 | 3.36 | 0.62 | ₹24.6 L |
| D | 2020-y18 | ₹15.2 L | 0.00 | 0.00 | 0.00 | not above 0.1 year |
| D | 2020-y19 | ₹15.2 L | 0.00 | 0.00 | 0.00 | not above 0.1 year |
| D | 2020-y20 | ₹15.2 L | 2.05 | 1.76 | 0.29 | ₹52.6 L |
| D | slump | ₹15.2 L | 2.85 | 2.49 | 0.35 | ₹43.4 L |
| D | average of six replays | ₹15.2 L | 1.32 | 1.32 | 0.00 | not above 0.1 year |
Every number in this paper rests on assumptions, not forecasts. Tax rules are FY2026-27 under the new regime and may change. None of this constitutes financial, tax, or investment advice. finfire.org operates the calculator and offers paid tiers.
Reproducibility. Every calculator link behind this paper, with the plan it opens and the answer the calculator gives (results the calculator cannot run yet are harness extensions, listed in the paper): urls.csv