Does Gold Actually Help? Equity, Debt and Gold in an Indian SIP, after Tax, across 1999–2026 and 2,000 Simulated Markets
Testing the idea that gold is dead weight that only shines in a crisis
finfire Quantitative Research Series · Paper #12 · November 2026
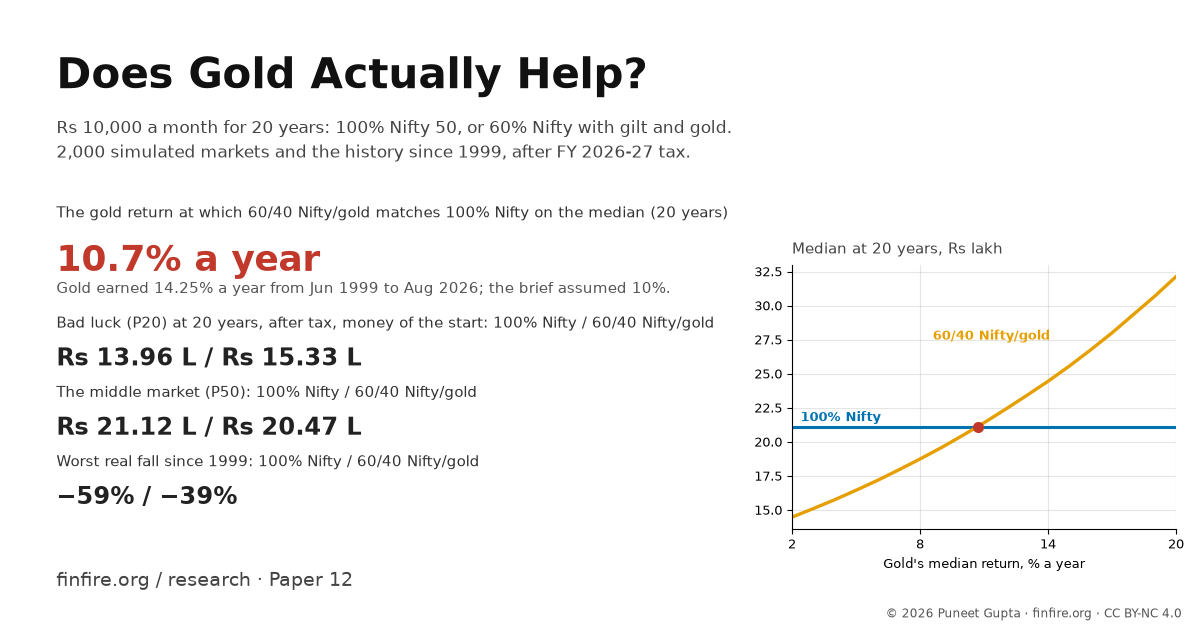
In one minute
Indian investors argue about gold all the time. Some say a little gold makes a long SIP safer. Others say it is dead weight that only shines in a crisis. We tested both views with numbers. We followed ₹10,000 a month for 10 to 25 years in four mixes: 100% Nifty 50, 60/40 Nifty/gilt, 60/40 Nifty/gold and 60/20/20 Nifty/gilt/gold. Every result counts the monthly timing of the SIP, a rebalance each March and FY 2026-27 tax. Results are after inflation, in money of the day the SIP starts.
Before we ran anything, we wrote down what we expected: 100% Nifty wins on the median, but the gold mixes, rebalanced each year, cut the worst falls, remove the losing stretches and lift the bad-luck outcome.
What we found:
- The median depends on one number: what gold earns. With gold at 10% a year (our starting assumption), 100% Nifty has the best median at every horizon from 15 to 25 years. At 20 years it is ₹21.12 L, against ₹20.47 L for 60/40 Nifty/gold and ₹18.81 L for 60/20/20 (real, after tax). History says the opposite. Gold earned 14.25% a year from Jun 1999 to Aug 2026, more than the Nifty 50's 13.21%. In history, 60/40 Nifty/gold had the higher median: ₹27.80 L against ₹24.51 L with the historical inputs, and a median real return of 6.19% against 5.84% across the 20-year SIPs. The break-even is 10.7%. Above that, 60/40 Nifty/gold's median beats 100% Nifty's. 60/20/20 needs gold at 15.2%.
- Gold cut the worst fall by about a third. Since 1999, 100% Nifty's worst real fall was −59.1%. The three mixes fell −40.1% (gilt), −39.3% (gold) and −39.7% (60/20/20). The gap was in recovery time. 100% Nifty spent up to 156 months below an earlier peak. 60/40 Nifty/gold spent at most 46.
- Losing stretches were rare, and the gold mixes had none. Of 207 ten-year SIPs, 2 ended with a negative real return after tax for 100% Nifty and 10 for 60/40 Nifty/gilt. 60/40 Nifty/gold had 0, and 60/20/20 had 0 (its worst was 0.0001%). From 15 years on, no mix had one.
- The bad-luck outcome ("8 in 10 markets"): 60/40 Nifty/gold lifts it, 60/20/20 barely, and the gilt mix lowers it. At 20 years, 8 markets in 10 end above ₹13.96 L for 100% Nifty, ₹15.33 L for 60/40 Nifty/gold (+9.9%), ₹14.38 L for 60/20/20 (+3.1%) and ₹13.21 L for 60/40 Nifty/gilt (−5.4%). The cost of 60/40 Nifty/gold is 3.1% of the median.
- "Gold only shines in a crisis" is half right. In the months of our four stress windows, gold earned 23.4% a year and the Nifty 3.1%. In every other month gold earned 10.0% a year, against the Nifty's 18.6% and the gilt's 8.3%. So gold did shine in the crises. But it was not dead weight outside them: it still beat the gilt index and inflation (5.9%). Two of the four windows were picked for a gold surge, which flatters the crisis figure.
The short version: Gold made a long SIP fall less and recover faster, and it lifted the bad-luck outcome. Whether it also costs you at the median depends on gold's future return. That return has to be about 10.7% a year for a 60/40 Nifty/gold mix to break even with 100% Nifty. From 1999 to 2026 it was 14.25%. Nobody knows the next 20 years.
*
1. The question
The debate is simple. One side says gold is a hedge: it rises when equity falls, so a SIP with gold in it suffers less. The other side says gold earns little over time, so it drags down what you end up with.
Most charts in this debate compare lump-sum returns from one date to another. A SIP is different. Money goes in every month, through good markets and bad. If you rebalance, you sell what has run ahead and buy what has fallen behind. Each sale can trigger tax. Gold ETFs and equity funds are not taxed the same way. We wanted an answer that counts all of this.
So we asked: does adding gold to a long Nifty 50 SIP improve the bad-luck outcomes (the worst fall, the time spent below an earlier peak, and the 20th-percentile corpus) by enough to justify what it costs at the median, after monthly timing, rebalancing and FY 2026-27 tax?
Words used
| Word | Meaning |
|---|---|
| L, Cr | lakh (₹1,00,000) and crore (₹1,00,00,000) |
| SIP | a fixed amount invested every month |
| Nifty 50 index fund | a fund that copies India's 50 largest companies, dividends reinvested |
| Gilt fund | a fund of government bonds. Here one that tracks a 10-year bond |
| Gold ETF | a fund listed on the exchange that holds gold |
| TER | the fund's yearly fee, taken out of its value |
| Rebalance | trading back to the target mix (here each 31 March) |
| Real | after Indian inflation, in money of the day the SIP starts |
| XIRR | the yearly return of a stream of monthly payments |
| P20, "8 in 10 markets" | the outcome that 8 simulated markets in 10 beat (rank 400 of 2,000). We call it the bad-luck outcome |
| P50 | the median: the middle market |
| P10, P90 | 9 markets in 10 beat P10; 1 market in 10 beats P90 |
| Drawdown | how far a portfolio has fallen below its last peak |
| Underwater | the months spent below a past peak |
| LTCG, STCG | long-term and short-term capital gains tax |
| Cess | a 4% add-on to the tax. So 12.5% becomes 13% and the 30% slab becomes 31.2% |
| FIFO | first in, first out: the oldest units are sold first |
| Window | the same SIP started in a different month. Neighbouring windows overlap |
| Independent window | a stretch of history that does not overlap another |
| Bootstrap | new paths built from 24-month blocks of the same history: simulation, not more history |
*
2. The set-up
Baseline (the same for every figure)
| Item | Value |
|---|---|
| SIP | ₹10,000 a month, flat, at each month end, for 10, 15, 20 or 25 years. 20 years is the flagship: ₹24,00,000 put in |
| Case 1 | 100% Nifty 50 index fund |
| Case 2 | 60% Nifty 50 / 40% gilt fund |
| Case 3 | 60% Nifty 50 / 40% gold ETF |
| Case 4 | 60% Nifty 50 / 20% gilt / 20% gold ETF |
| Keeping the mix | three ways: buy-and-hold (each SIP split at the target, never traded); new money only (each SIP goes to the funds that are below target, nothing is sold); sell to rebalance each 31 March (the base: back to target, oldest units sold first, tax booked and paid the next April) |
| Tax (FY 2026-27) | Equity fund: LTCG 13% after 12 months above ₹1.25 L a year, STCG 20.8%. Gold ETF: LTCG 13% after 12 months with no ₹1.25 L exemption, short-term gains 31.2%. Gilt fund: 31.2% on every gain. Everything is sold at the end |
| Data | 327 month ends, Jun 1999 to Aug 2026: the Nifty 50 total return index, a 10-year gilt index, RBI's Mumbai gold price (monthly average) and Indian CPI |
Case 1 has nothing to rebalance, so its three methods are the same.
Three ways to build the paths
- History. The same SIP started in every possible month since Jun 1999. There are 207 ten-year windows and only 87 twenty-year ones.
- 2,000 simulated markets. We use the calculator's own random numbers and add gold, with the three assets moving together as their correlations say. Our base inputs are the brief's: Nifty 12% a year, gilt 7.25%, gold 10%. We also run the same simulation with inputs taken from history.
- A block bootstrap. New 20-year paths built from 24-month blocks of the same history. The months inside a block stay together, so a crash and gold's response to it stay together too.
Assumptions and method
- ₹10,000 a month, flat, at each month end; 10 to 25 years; 20 years is the flagship. Real = after Indian CPI, money of the start.
- Funds: Nifty 50 index fund (TER 0.20%), gilt index fund on a 10-year bond (0.20%), gold ETF (0.59%, the median of five large gold ETFs in AMFI's Oct 2026 data).
- Tax FY 2026-27: equity LTCG 13% above ₹1.25 L (held in real terms), STCG 20.8%; gold ETF LTCG 13% with no exemption, short-term 31.2%; gilt fund 31.2%. Paid each April; everything sold at the end.
- Base method: sell to rebalance each 31 March (FIFO). Also buy-and-hold and new money only.
- History: Jun 1999 to Aug 2026; gold is RBI's Mumbai monthly average price. Today's tax rules on every past year.
- Monte Carlo: 2,000 markets, medians Nifty 12% (vol 17%), gilt 7.25% (3.5%), gold 10% (14.5%), correlations 0.10, −0.05, 0.05; 7% inflation. Also historical parameters and a 24-month block bootstrap.
Where we differ from the brief. We checked the law and the data before running anything. Three points changed:
- Gold ETFs do not get the ₹1.25 L exemption. That exemption is under s.112A, which covers equity funds only. A gold ETF's long-term gain falls under s.112: 12.5% (13% with cess) and no exemption. This is confirmed in the Budget 2024 memorandum. We run the brief's reading, where gold shares the exemption, as a variant. It moves 60/40 Nifty/gold's 20-year median from ₹20.47 L to ₹20.82 L.
- Gold ETFs are long-term after 12 months. This applies to listed units sold from 23 Jul 2024. Since 1 Apr 2025, gold ETFs are also outside the "specified mutual fund" rule, which now covers only funds with more than 65% in debt.
- The Nifty 50's yearly return over our window is 13.21%, not the brief's "about 12.9%". The 12.9% figure runs to Sep 2026, one month past the end of the gold data.
The gilt and gold inputs to the simulation, and two of its three correlations, were our own fill-ins, because the brief was cut off. Table 4 sets them beside history.
*
3. History: every 20-year SIP
We started the same ₹10,000 SIP in each of the 87 months from Jun 1999 to Aug 2006 and ran each for 20 years. Figure 1 shows each SIP's real return after tax.
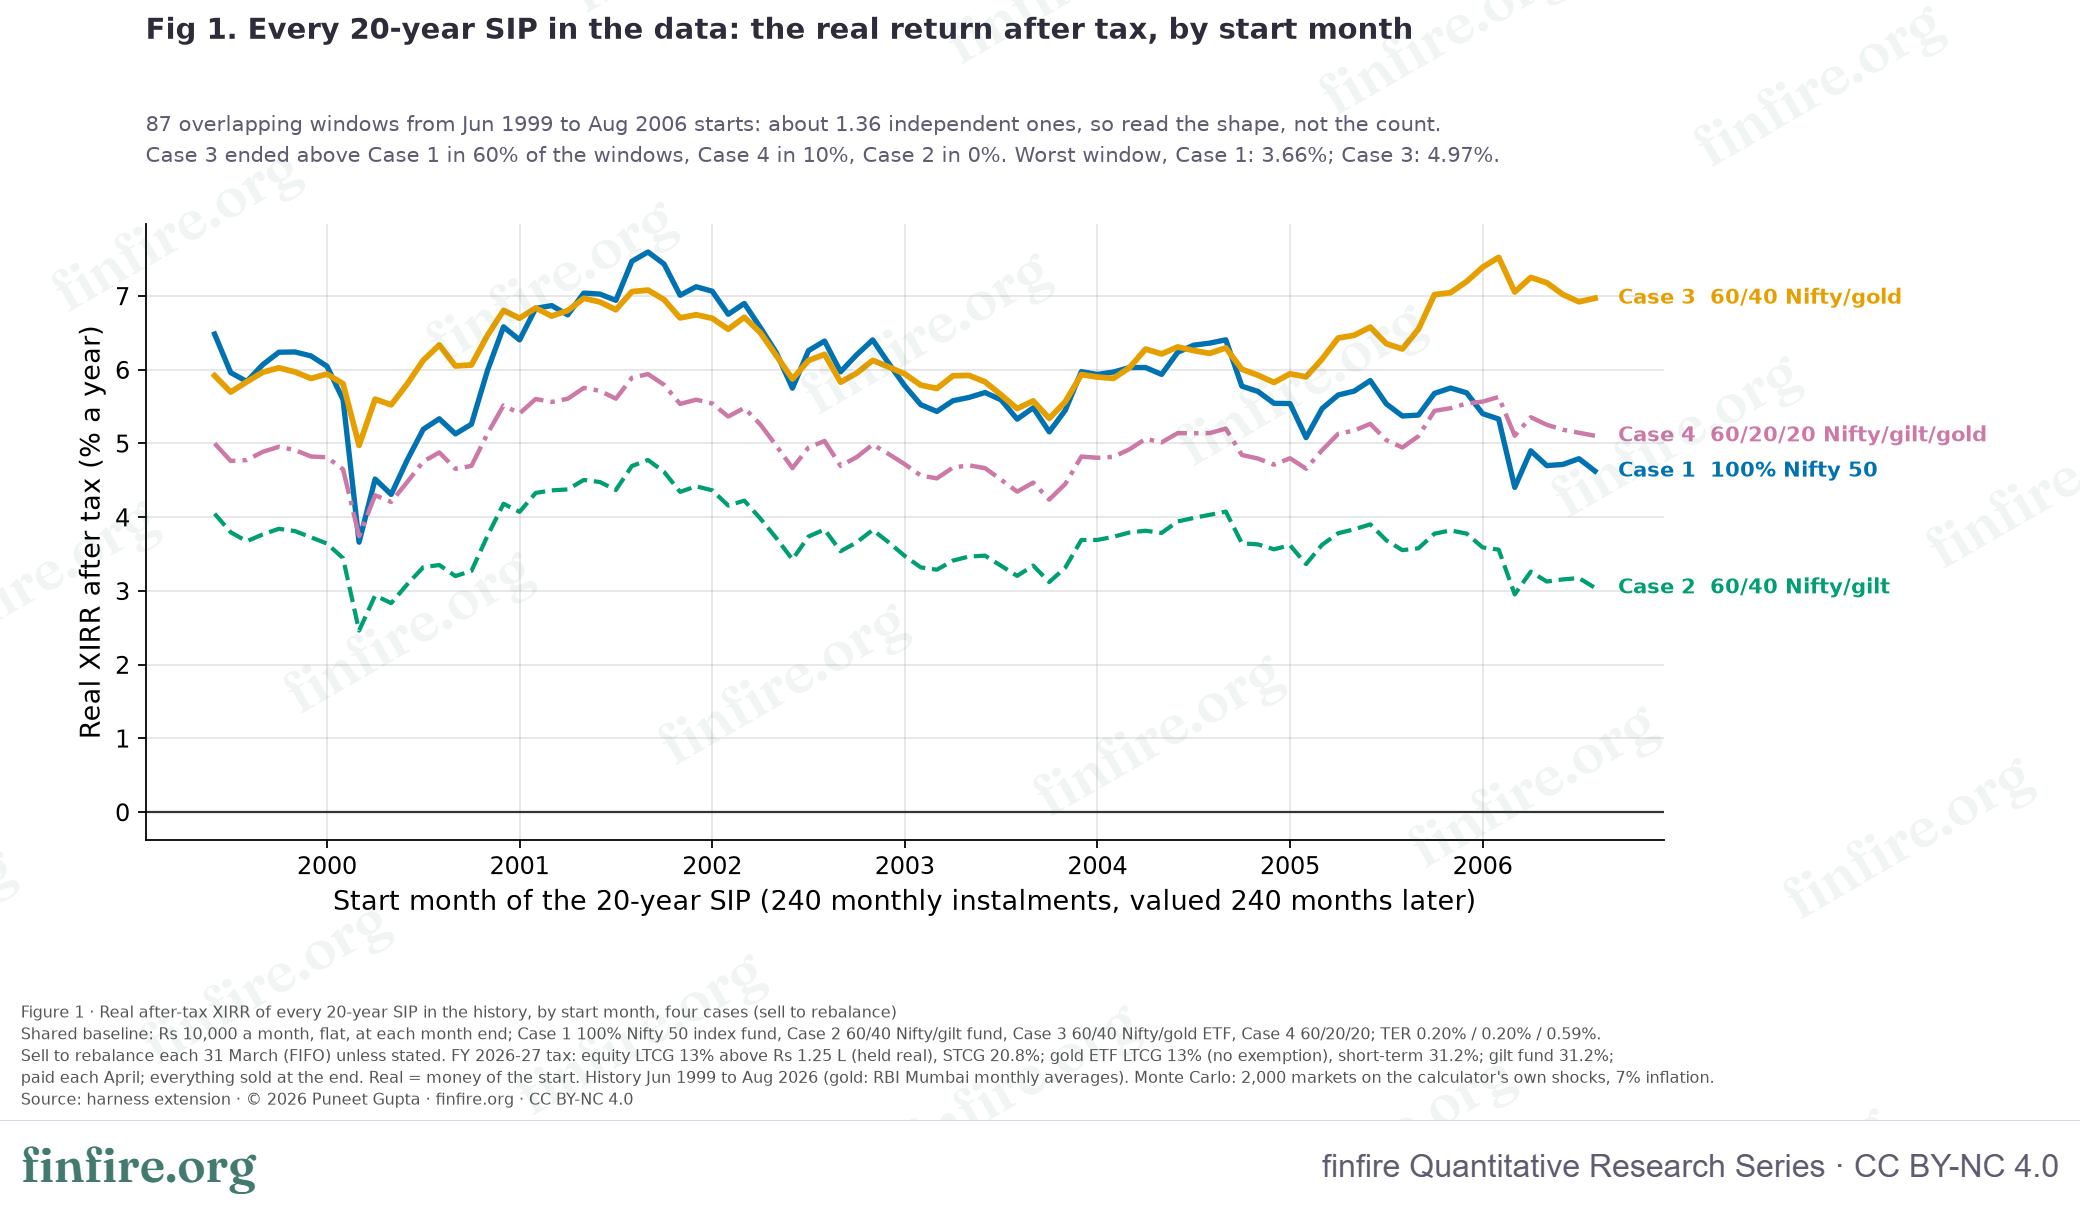
charts/fig1_rolling_20y_xirr_data.csv.Three things stand out.
- Every 20-year SIP beat inflation, in every case and with every method. Every one also beat 7% a year in nominal terms.
- 60/40 Nifty/gold had the best median and the best worst case: a median real return of 6.19% and a worst of 4.97%. For 100% Nifty they were 5.84% and 3.66%. It ended ahead of 100% Nifty in 60% of the windows.
- 60/40 Nifty/gilt was last in every window. Its median was 3.69%, and it never beat 100% Nifty.
Table 1 · History, 20 years (87 windows, about 1.36 independent)
| Case | Method | Real XIRR after tax: min | median | max | Nominal XIRR after tax: median | Real XIRR before tax: median | Windows above 7% nominal | Windows with real XIRR > 0 | Worst real drawdown (SIP's TWR) | Longest real underwater (months) | Longest below money put in (months) | Worst gap below money put in | End value, real (nominal), median | Beat Case 1 in |
|---|---|---|---|---|---|---|---|---|---|---|---|---|---|---|
| 100% Nifty 50 | all | 3.66% | 5.84% | 7.59% | 12.63% | 6.61% | 100% | 100% | −59.1% | 156 | 39 | −35.2% | ₹28.05 L (₹99.30 L) | |
| 60/40 Nifty/gilt | buy-and-hold | 2.13% | 3.78% | 5.16% | 10.31% | 4.65% | 100% | 100% | −49.2% | 156 | 10 | −16.0% | ₹21.24 L (₹75.12 L) | 0% |
| 60/40 Nifty/gilt | new money only | 1.92% | 3.26% | 4.12% | 9.75% | 4.18% | 100% | 100% | −42.0% | 156 | 10 | −16.1% | ₹19.80 L (₹70.30 L) | 0% |
| 60/40 Nifty/gilt | sell to rebalance | 2.46% | 3.69% | 4.77% | 10.25% | 4.57% | 100% | 100% | −40.1% | 137 | 10 | −15.8% | ₹21.13 L (₹74.55 L) | 0% |
| 60/40 Nifty/gold | buy-and-hold | 3.80% | 5.26% | 6.68% | 12.02% | 6.02% | 100% | 100% | −44.9% | 127 | 33 | −16.2% | ₹26.60 L (₹92.25 L) | 17% |
| 60/40 Nifty/gold | new money only | 4.24% | 5.50% | 7.23% | 12.33% | 6.25% | 100% | 100% | −38.0% | 85 | 33 | −16.9% | ₹27.55 L (₹95.79 L) | 31% |
| 60/40 Nifty/gold | sell to rebalance | 4.97% | 6.19% | 7.52% | 12.96% | 6.98% | 100% | 100% | −39.3% | 46 | 33 | −16.7% | ₹30.06 L (₹1.03 Cr) | 60% |
| 60/20/20 | buy-and-hold | 3.01% | 4.62% | 5.69% | 11.16% | 5.42% | 100% | 100% | −47.0% | 137 | 11 | −14.8% | ₹23.97 L (₹83.18 L) | 3% |
| 60/20/20 | new money only | 3.11% | 4.44% | 5.35% | 10.99% | 5.29% | 100% | 100% | −39.4% | 128 | 11 | −15.3% | ₹23.31 L (₹81.47 L) | 7% |
| 60/20/20 | sell to rebalance | 3.74% | 4.97% | 5.94% | 11.59% | 5.81% | 100% | 100% | −39.6% | 113 | 11 | −15.4% | ₹25.15 L (₹87.58 L) | 10% |
"Longest below money put in" counts the months in which the SIP was worth less than the rupees paid into it so far. For 100% Nifty that lasted up to 39 months, and at the worst point the SIP was 35.2% below the money put in. For the mixes it was 10 to 33 months, and 14.8% to 16.9% below.
Is this true at other horizons?
Not at 15 years. Table 2 shows the median and the worst real return for each horizon. 60/40 Nifty/gold had the higher median at 10, 20 and 25 years, but 100% Nifty had it at 15 (5.69% against 5.39%). 60/40 Nifty/gold ended ahead of 100% Nifty in 58% of 10-year windows, 41% of 15-year windows, 60% of 20-year windows and 74% of 25-year windows.
Table 2 · History by horizon (sell to rebalance)
| Years | Windows (independent) | 100% Nifty 50: median / min real XIRR after tax | 60/40 Nifty/gilt: median / min real XIRR after tax | 60/40 Nifty/gold: median / min real XIRR after tax | 60/20/20: median / min real XIRR after tax |
|---|---|---|---|---|---|
| 10 | 207 (2.72) | 5.43% / −0.83% | 3.37% / −1.07% | 6.14% / 0.90% | 5.14% / 0.00% |
| 15 | 147 (1.81) | 5.69% / 0.30% | 3.38% / 0.46% | 5.39% / 2.51% | 4.44% / 1.49% |
| 20 | 87 (1.36) | 5.84% / 3.66% | 3.69% / 2.46% | 6.19% / 4.97% | 4.97% / 3.74% |
| 25 | 27 (1.09) | 6.98% / 6.18% | 4.43% / 3.81% | 7.47% / 6.87% | 6.00% / 5.63% |
A warning about all of this. The 87 twenty-year windows overlap almost completely. Together they hold about 1.36 independent 20-year stretches. They describe one history, not a law. This is why we also simulate.
*
4. 2,000 simulated markets
History gives one path. A simulation gives many. We ran 2,000 simulated markets on the calculator's own random numbers, added gold as a third asset, and let the three assets move together as their correlations say. Every market runs the same SIP with the same tax rules.
We ran it three ways: with the brief's inputs, with inputs taken from history, and as a block bootstrap of history.
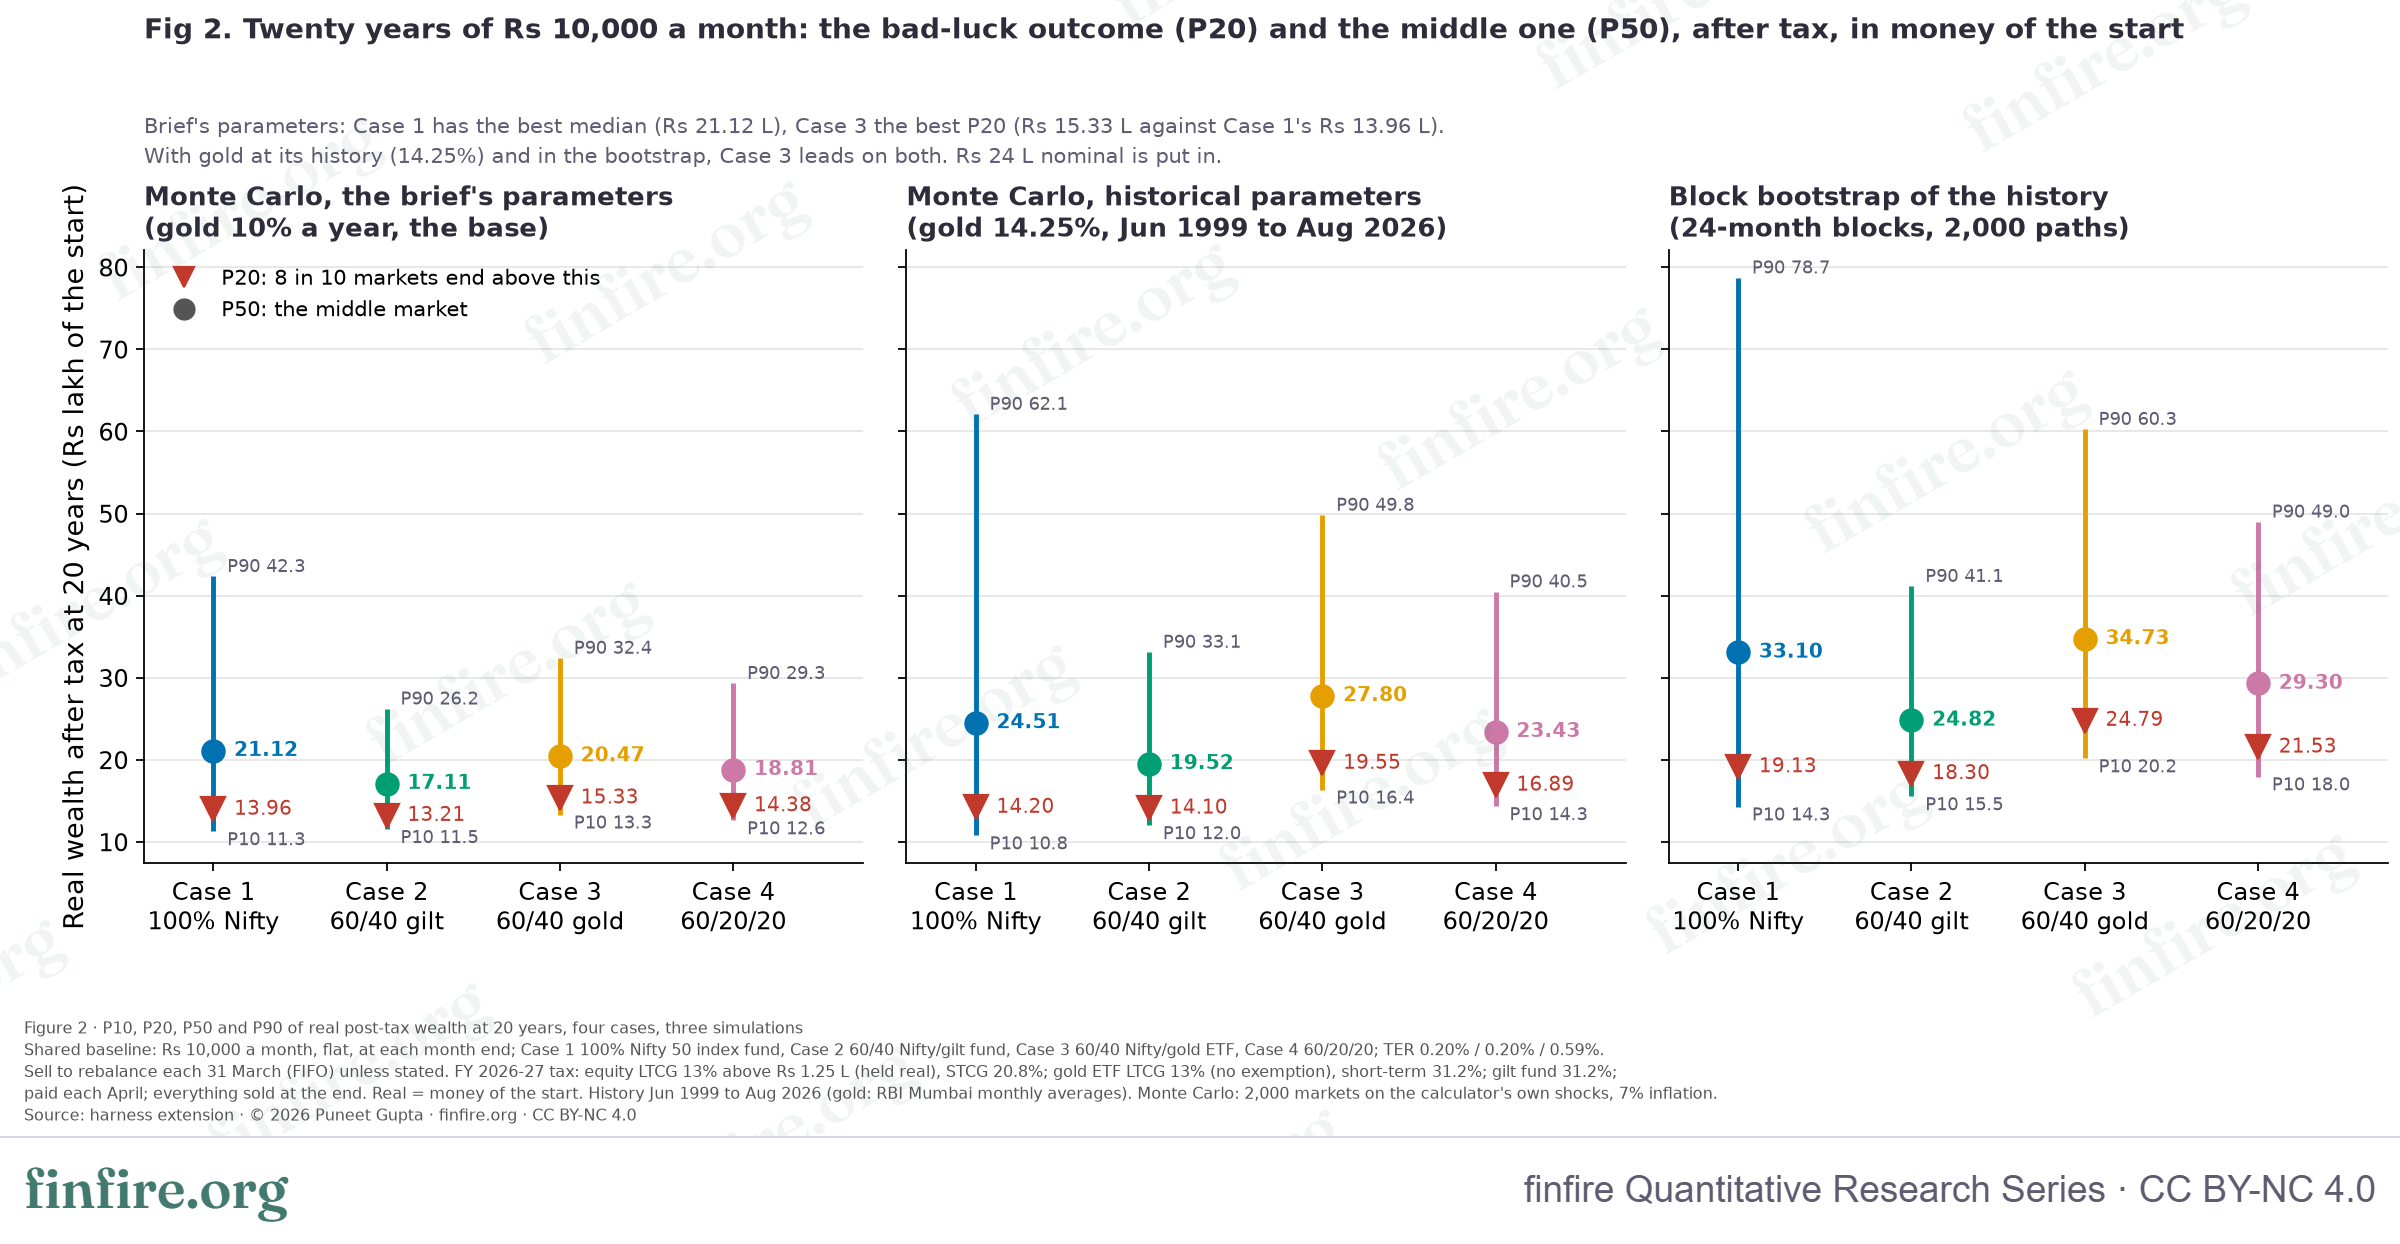
charts/fig2_mc_20y_percentiles_data.csv.Table 3 · Monte Carlo and bootstrap at 20 years
| Case | Brief's parameters: P10 | P20 | P50 | P90 | beats Case 1 in | Historical parameters: P20 | P50 | beats Case 1 in | Bootstrap: P20 | P50 | beats Case 1 in |
|---|---|---|---|---|---|---|---|---|---|---|---|
| 100% Nifty 50 | ₹11.29 L | ₹13.96 L | ₹21.12 L | ₹42.34 L | ₹14.20 L | ₹24.51 L | ₹19.13 L | ₹33.10 L | |||
| 60/40 Nifty/gilt | ₹11.55 L | ₹13.21 L | ₹17.11 L | ₹26.20 L | 13.7% | ₹14.10 L | ₹19.52 L | 20.6% | ₹18.30 L | ₹24.82 L | 18.1% |
| 60/40 Nifty/gold | ₹13.32 L | ₹15.33 L | ₹20.47 L | ₹32.39 L | 44.3% | ₹19.55 L | ₹27.80 L | 63.8% | ₹24.79 L | ₹34.73 L | 54.8% |
| 60/20/20 | ₹12.62 L | ₹14.38 L | ₹18.81 L | ₹29.31 L | 29.4% | ₹16.89 L | ₹23.43 L | 43.9% | ₹21.53 L | ₹29.30 L | 36.4% |
"Beats Case 1 in" is the share of markets in which that mix ended above 100% Nifty in the same market.
On the brief's inputs, the result is the trade the hypothesis expected. 100% Nifty has the best median. 60/40 Nifty/gold has the best bad-luck outcome, ₹15.33 L against ₹13.96 L, and gives up ₹0.65 L of median for it. 100% Nifty also has the widest range: 1 market in 10 ends above ₹42.34 L, and 1 in 10 below ₹11.29 L.
With the historical inputs, and in the bootstrap, 60/40 Nifty/gold leads at both P20 and P50.
What decides the answer: gold's return
Our inputs and history differ in several places (Table 4). History had a higher Nifty return with much more volatility, a choppier gilt, and gold four points a year higher. The correlations were also more negative than ours.
Table 4 · The parameters, brief against history
| Parameter | Brief (Step 1 fill-in) | History, Jun 1999 to Aug 2026 |
|---|---|---|
| Nifty 50: median return / volatility | 12.00% / 17.0% | 13.21% / 22.1% |
| Gilt: median return / volatility | 7.25% / 3.5% | 7.26% / 6.7% |
| Gold: median return / volatility | 10.00% / 14.5% | 14.25% / 14.6% (uncorrected 14.4%) |
| ρ equity–gilt / equity–gold / gilt–gold | 0.1 / −0.05 / 0.05 | −0.34 / −0.14 / −0.09 |
| Positive definite (determinant) | 0.9845 | 0.8432 |
To see which difference matters, we changed one input at a time (Table 5). Gold's return decides it. Put gold at its history, and leave everything else at the brief's: 60/40 Nifty/gold's median beats 100% Nifty's by 17.0%, and its P20 by 31.3%. Put equity at its history instead: 100% Nifty's median rises to ₹24.51 L, but its P20 barely moves (₹14.20 L). The correlations hardly matter. Setting every correlation to zero moves 60/40 Nifty/gold's P20 by −0.87%.
Table 5 · Which parameter drives the answer
| Parameters | 100% Nifty 50 P20 / P50 | 60/40 Nifty/gilt P20 / P50 | 60/40 Nifty/gold P20 / P50 | 60/20/20 P20 / P50 |
|---|---|---|---|---|
| Brief's parameters (gold 10%) | ₹13.96 L / ₹21.12 L | ₹13.21 L / ₹17.11 L | ₹15.33 L / ₹20.47 L | ₹14.38 L / ₹18.81 L |
| Brief's, gold at its history (14.25%) | ₹13.96 L / ₹21.12 L | ₹13.21 L / ₹17.11 L | ₹18.33 L / ₹24.71 L | ₹15.76 L / ₹20.67 L |
| Brief's, equity at its history (13.21%, vol 22.1%) | ₹14.20 L / ₹24.51 L | ₹13.67 L / ₹19.22 L | ₹16.02 L / ₹22.96 L | ₹14.96 L / ₹21.00 L |
| Historical, gold at 10% | ₹14.20 L / ₹24.51 L | ₹14.10 L / ₹19.52 L | ₹16.28 L / ₹22.96 L | ₹15.38 L / ₹21.30 L |
| Historical parameters | ₹14.20 L / ₹24.51 L | ₹14.10 L / ₹19.52 L | ₹19.55 L / ₹27.80 L | ₹16.89 L / ₹23.43 L |
What tax takes
Table 6 shows the brief's run before and after tax. Over 20 years the median SIP paid ₹1.75 L to ₹2.06 L of tax in real terms. 60/40 Nifty/gold paid the least.
The last column is the chance of ending below the money put in, after inflation. The ₹24,00,000 put in over 20 years is worth ₹13.19 L in money of the start. 100% Nifty ended below that in 16.9% of markets. 60/40 Nifty/gold did in 9.4%.
Table 6 · Before and after tax (brief's parameters)
| Case | P20 after tax | P20 held before the exit sale | P20 with no tax at all | P50 after tax | P50 held before the exit sale | P50 with no tax at all | Median tax paid, real | Chance of ending below the real money put in |
|---|---|---|---|---|---|---|---|---|
| 100% Nifty 50 | ₹13.96 L | ₹14.94 L | ₹14.94 L | ₹21.12 L | ₹23.18 L | ₹23.18 L | ₹2.06 L | 16.9% |
| 60/40 Nifty/gilt | ₹13.21 L | ₹14.21 L | ₹14.64 L | ₹17.11 L | ₹18.77 L | ₹19.22 L | ₹2.02 L | 19.9% |
| 60/40 Nifty/gold | ₹15.33 L | ₹16.13 L | ₹16.43 L | ₹20.47 L | ₹21.89 L | ₹22.34 L | ₹1.75 L | 9.4% |
| 60/20/20 | ₹14.38 L | ₹15.37 L | ₹15.70 L | ₹18.81 L | ₹20.36 L | ₹20.83 L | ₹1.92 L | 13.3% |
The gilt mix does not lift the bad-luck outcome at 20 years. 60/40 Nifty/gilt's P20 is ₹13.21 L, below 100% Nifty's ₹13.96 L. It lifts only P10 (₹11.55 L against ₹11.29 L). Every gilt gain is taxed at 31.2%, and the 10-year gilt index returned 7.26% a year.
60/20/20 does not keep most of both. Its P20 is 3.1% above 100% Nifty's, and its median is 11.0% below. 60/40 Nifty/gold gains 9.9% at P20 and gives up 3.1% of the median.
*
5. Drawdowns and time underwater
Here we look at each mix as a single fund. We start ₹1 at the target mix in Jun 1999, take off the fees and rebalance each 31 March, with no tax. Figure 3 shows how far each fell below its last real peak.
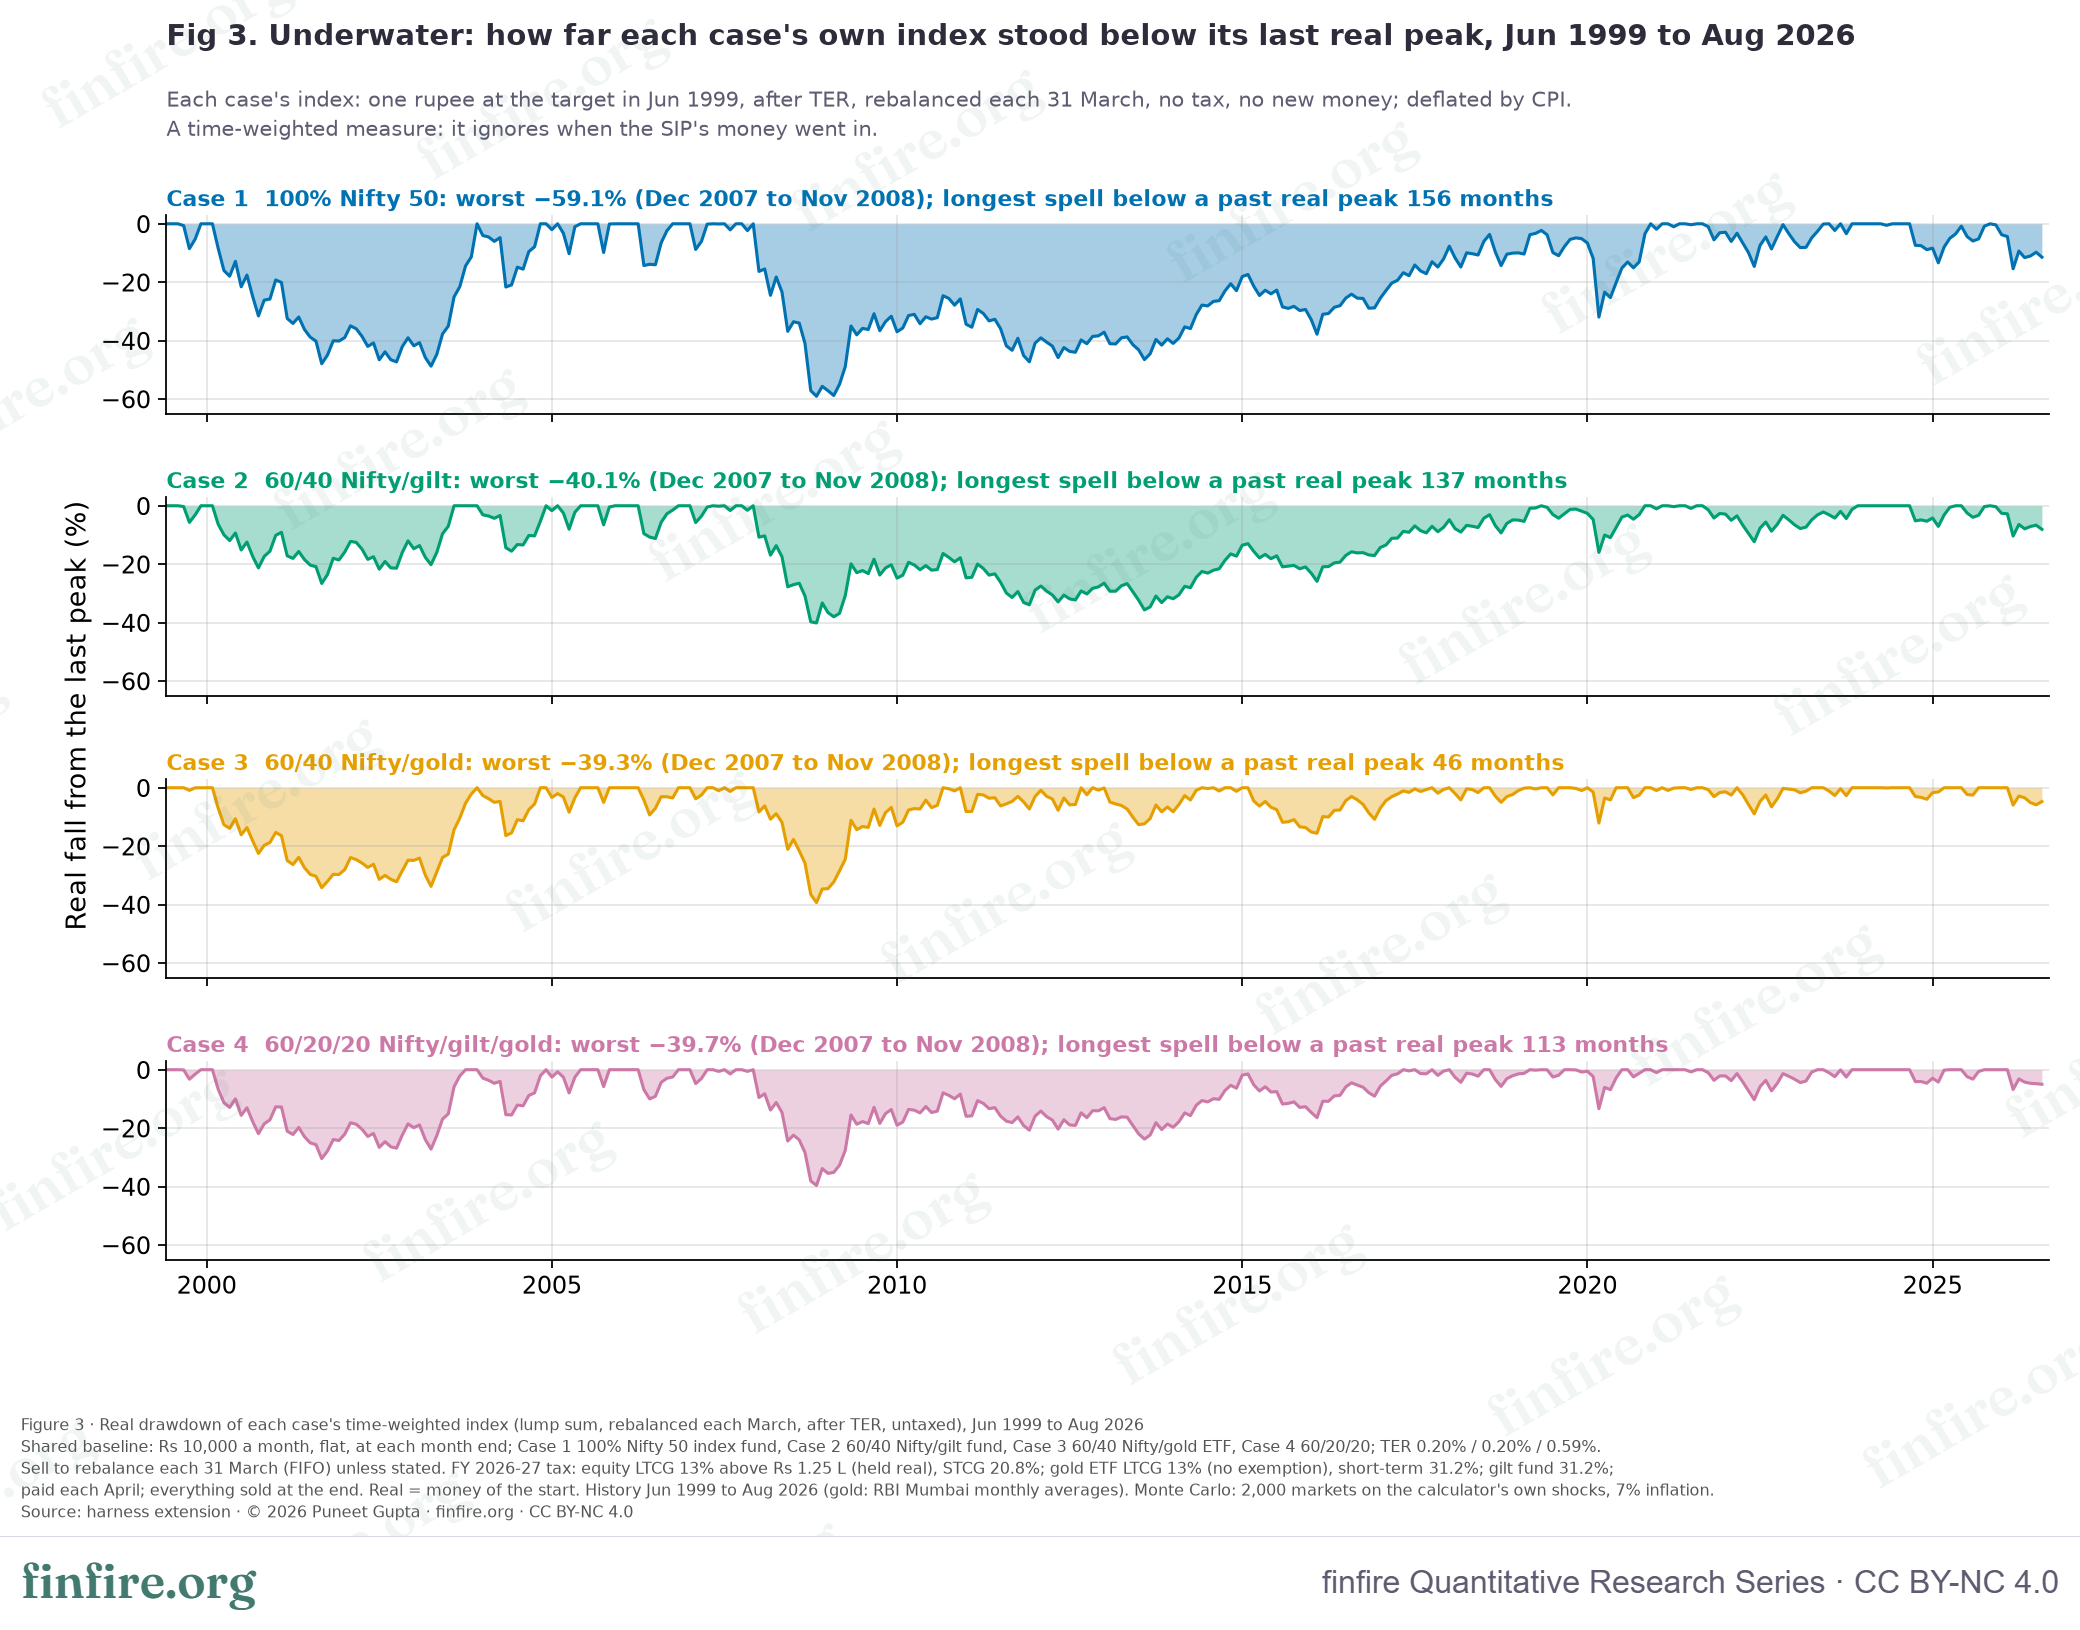
charts/fig3_underwater_data.csv.All four hit their worst point in the same place: from Dec 2007 to Nov 2008. The three mixes fell about as far as one another. The big difference was the climb back. 100% Nifty spent 156 months, 13 years, below an earlier real peak. 60/40 Nifty/gold spent at most 46 months. The gilt mix took 137 months and 60/20/20 took 113.
Table 7 · Each case's own index, Jun 1999 to Aug 2026
| Case | CAGR (nominal / real) | Volatility | Worst real fall | Peak to trough | Worst nominal fall | Longest real underwater | Months below a past real peak |
|---|---|---|---|---|---|---|---|
| 100% Nifty 50 | 12.99% / 6.68% | 21.6% | −59.1% | Dec 2007 to Nov 2008 | −54.8% | 156 months | 280 of 326 |
| 60/40 Nifty/gilt | 11.58% / 5.35% | 13.5% | −40.1% | Dec 2007 to Nov 2008 | −33.9% | 137 months | 275 of 326 |
| 60/40 Nifty/gold | 14.50% / 8.10% | 13.3% | −39.3% | Dec 2007 to Nov 2008 | −33.0% | 46 months | 243 of 326 |
| 60/20/20 | 13.11% / 6.79% | 13.0% | −39.7% | Dec 2007 to Nov 2008 | −33.4% | 113 months | 256 of 326 |
Over the whole window, 60/40 Nifty/gold grew faster than 100% Nifty (14.50% against 12.99% a year) with about 60% of its volatility (13.3% against 21.6%). That is history's verdict on gold's 14.25%. It is not a forecast.
*
6. Rebalancing and tax
There are three ways to keep a mix. You can never trade (buy-and-hold). You can steer each new SIP to whatever is below target (new money only). Or you can sell what is above target each March (sell to rebalance). Selling triggers tax, so you might expect it to cost the most.
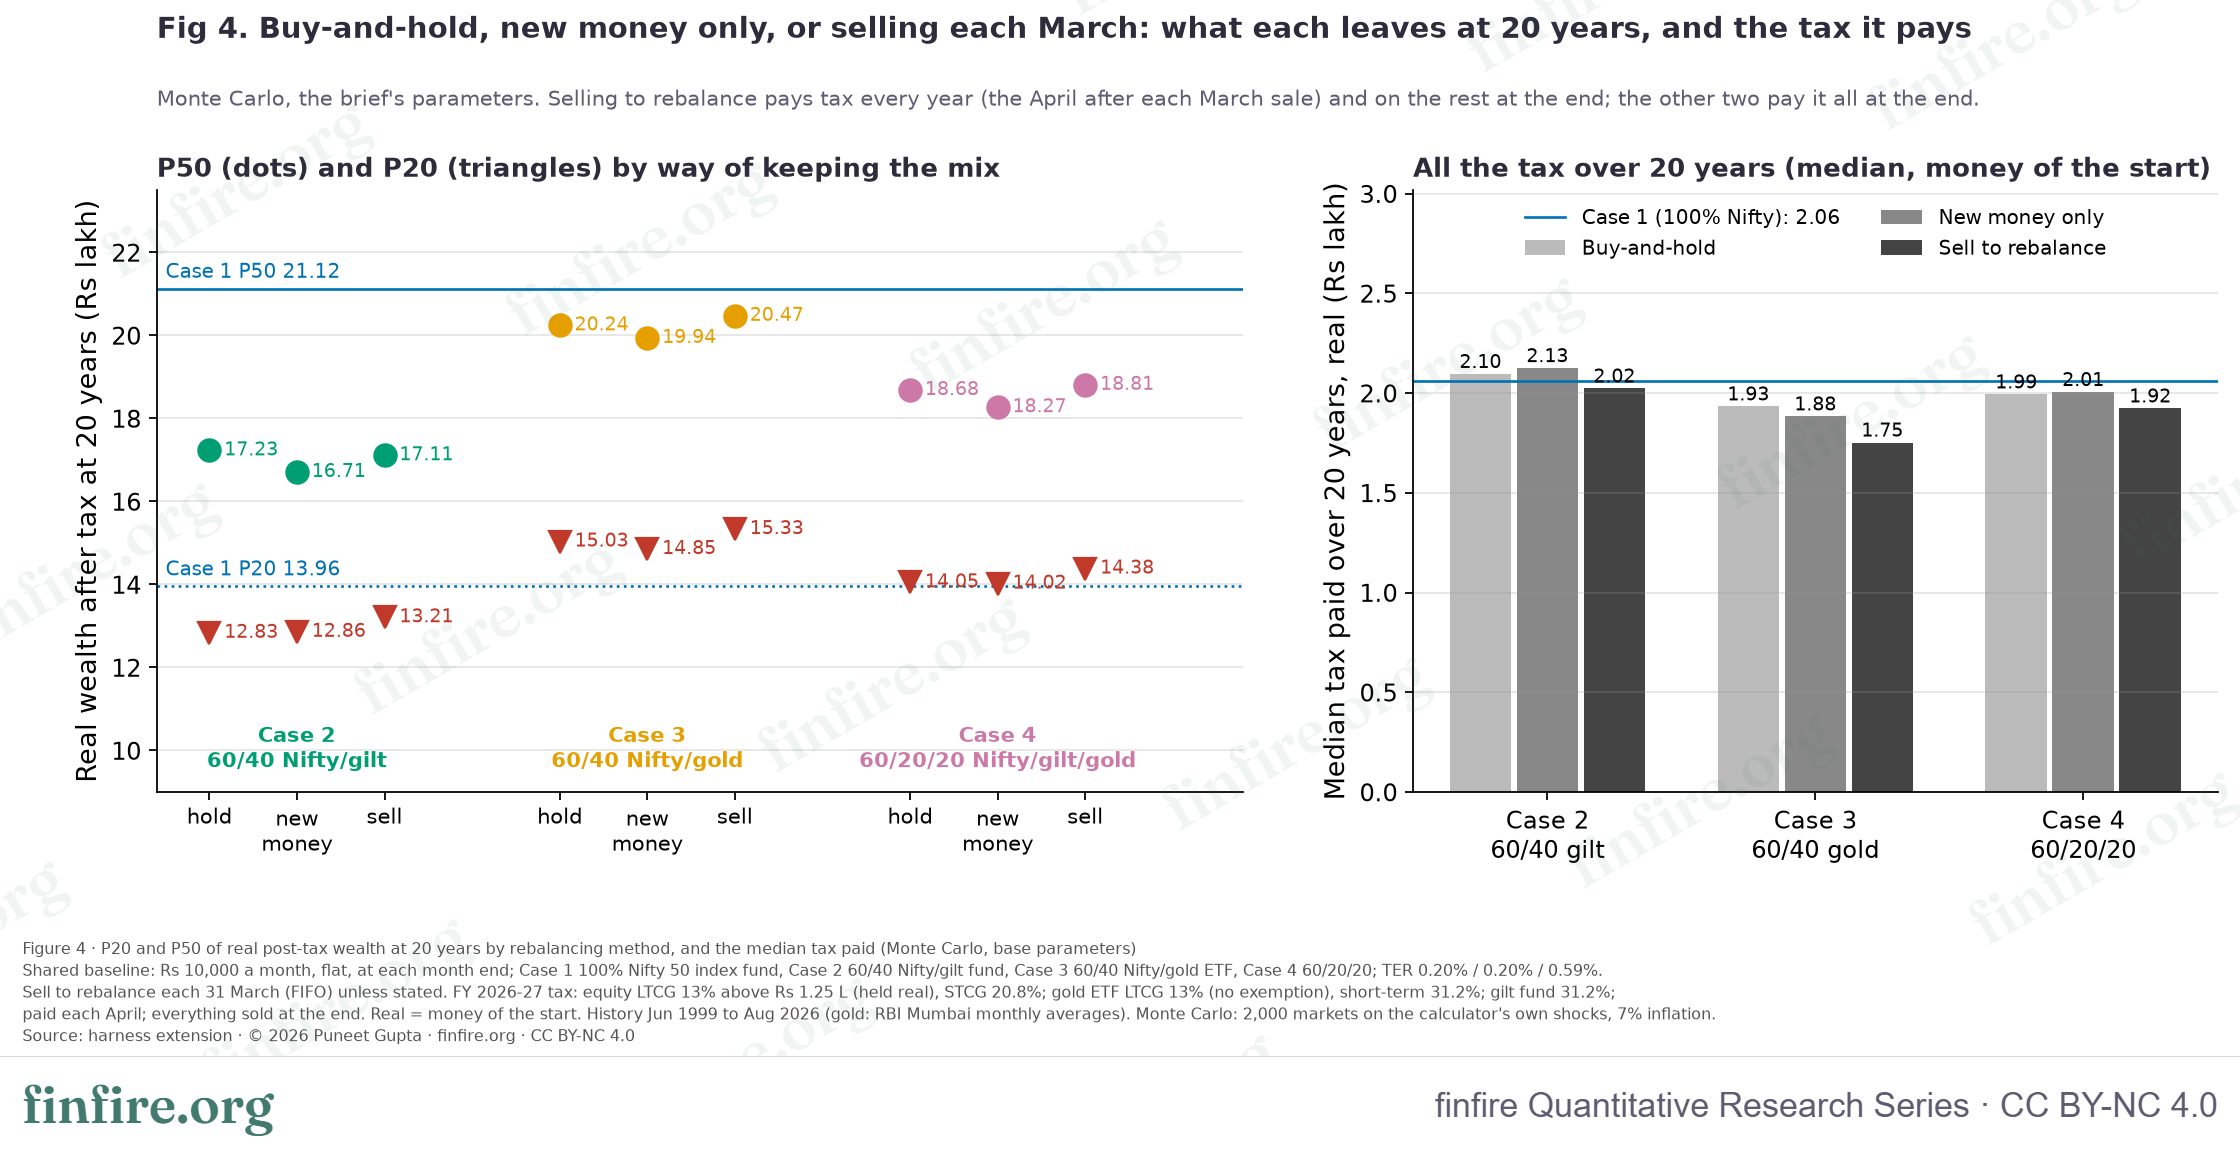
charts/fig4_methods_tax_data.csv.It did not. In the simulation, selling to rebalance paid less tax than the other two methods, in every mix. For 60/40 Nifty/gold, the median tax was ₹1.75 L when selling, ₹1.88 L with new money only and ₹1.93 L with buy-and-hold. Selling also left more at P20 and P50 for both gold mixes.
The reason is the yearly ₹1.25 L exemption. A sale each March can use that year's exemption on equity gains. If you hold to the end, the gains pile up and meet a single exemption in a single year. We checked this with a test run that had no exemption at all. The order flipped: selling to rebalance then paid ₹2.29 L against ₹2.08 L for buy-and-hold, and its median fell to ₹19.86 L against ₹20.09 L.
History was different. Gold surged, so most of what the March sales sold was gold, and gold has no exemption. The SIP running since Jun 1999 sold ₹97,88,851 of gold in 13 of its 27 Marches, and ₹49,31,417 of equity in 14. Selling to rebalance paid more tax than buy-and-hold: ₹2.89 L against ₹2.76 L (60/40 Nifty/gold, median, real). It still had the best median return: 6.19% when selling, 5.50% with new money only and 5.26% with buy-and-hold. Each March it sold the asset that had run ahead (mostly gold) and bought the one that had fallen behind.
The gilt mix is the exception. For 60/40 Nifty/gilt, buy-and-hold has a slightly higher median than selling (₹17.23 L against ₹17.11 L). Without rebalancing, equity drifts above 60%.
Table 8 · Rebalancing method and tax, 20 years
| Case | Method | MC P20 | MC P50 | MC median tax (real) | Bootstrap P20 | Bootstrap P50 | History 20y: median / min real XIRR | History median tax (real) |
|---|---|---|---|---|---|---|---|---|
| 100% Nifty 50 | all | ₹13.96 L | ₹21.12 L | ₹2.06 L | ₹19.13 L | ₹33.10 L | 5.84% / 3.66% | ₹3.01 L |
| 60/40 Nifty/gilt | buy-and-hold | ₹12.83 L | ₹17.23 L | ₹2.10 L | ₹17.31 L | ₹25.40 L | 3.78% / 2.13% | ₹2.48 L |
| 60/40 Nifty/gilt | new money only | ₹12.86 L | ₹16.71 L | ₹2.13 L | ₹17.41 L | ₹24.29 L | 3.26% / 1.92% | ₹2.47 L |
| 60/40 Nifty/gilt | sell to rebalance | ₹13.21 L | ₹17.11 L | ₹2.02 L | ₹18.30 L | ₹24.82 L | 3.69% / 2.46% | ₹2.31 L |
| 60/40 Nifty/gold | buy-and-hold | ₹15.03 L | ₹20.24 L | ₹1.93 L | ₹23.39 L | ₹33.24 L | 5.26% / 3.80% | ₹2.76 L |
| 60/40 Nifty/gold | new money only | ₹14.85 L | ₹19.94 L | ₹1.88 L | ₹23.86 L | ₹33.77 L | 5.50% / 4.24% | ₹2.90 L |
| 60/40 Nifty/gold | sell to rebalance | ₹15.33 L | ₹20.47 L | ₹1.75 L | ₹24.79 L | ₹34.73 L | 6.19% / 4.97% | ₹2.89 L |
| 60/20/20 | buy-and-hold | ₹14.05 L | ₹18.68 L | ₹1.99 L | ₹20.82 L | ₹29.31 L | 4.62% / 3.01% | ₹2.65 L |
| 60/20/20 | new money only | ₹14.02 L | ₹18.27 L | ₹2.01 L | ₹20.99 L | ₹28.82 L | 4.44% / 3.11% | ₹2.69 L |
| 60/20/20 | sell to rebalance | ₹14.38 L | ₹18.81 L | ₹1.92 L | ₹21.53 L | ₹29.30 L | 4.97% / 3.74% | ₹2.60 L |
A bigger SIP
The ₹1.25 L exemption is the same for everyone, so it covers a smaller share of a bigger SIP's gains. Table 9 runs ₹1,00,000 a month and divides the result by 10 to compare like with like. The effect is small: −0.65% of the median for 100% Nifty and −2.08% to −2.26% for the mixes. Freezing the exemption at ₹1.25 L in rupees of the day, so inflation erodes it, changes little more.
Table 9 · How the fixed exemption scales
| Case | ₹10,000 a month: P50 | ₹1,00,000 a month: P50 ÷ 10 | Difference | ₹1 L a month, exemption fixed nominal: P50 ÷ 10 |
|---|---|---|---|---|
| 100% Nifty 50 | ₹21.12 L | ₹20.99 L | −0.65% | ₹20.98 L |
| 60/40 Nifty/gilt | ₹17.11 L | ₹16.72 L | −2.26% | ₹16.65 L |
| 60/40 Nifty/gold | ₹20.47 L | ₹20.03 L | −2.17% | ₹19.95 L |
| 60/20/20 | ₹18.81 L | ₹18.42 L | −2.08% | ₹18.33 L |
*
7. The crisis windows
We picked four stretches when Indian equity struggled:
- the global financial crisis (Jan 2008 to Dec 2009);
- three years of flat equity with a falling rupee and a gold spike (Jan 2011 to Dec 2013);
- the COVID crash (Jan 2020 to Dec 2021);
- the last two years of flat equity with a gold surge (Sep 2024 to Aug 2026).
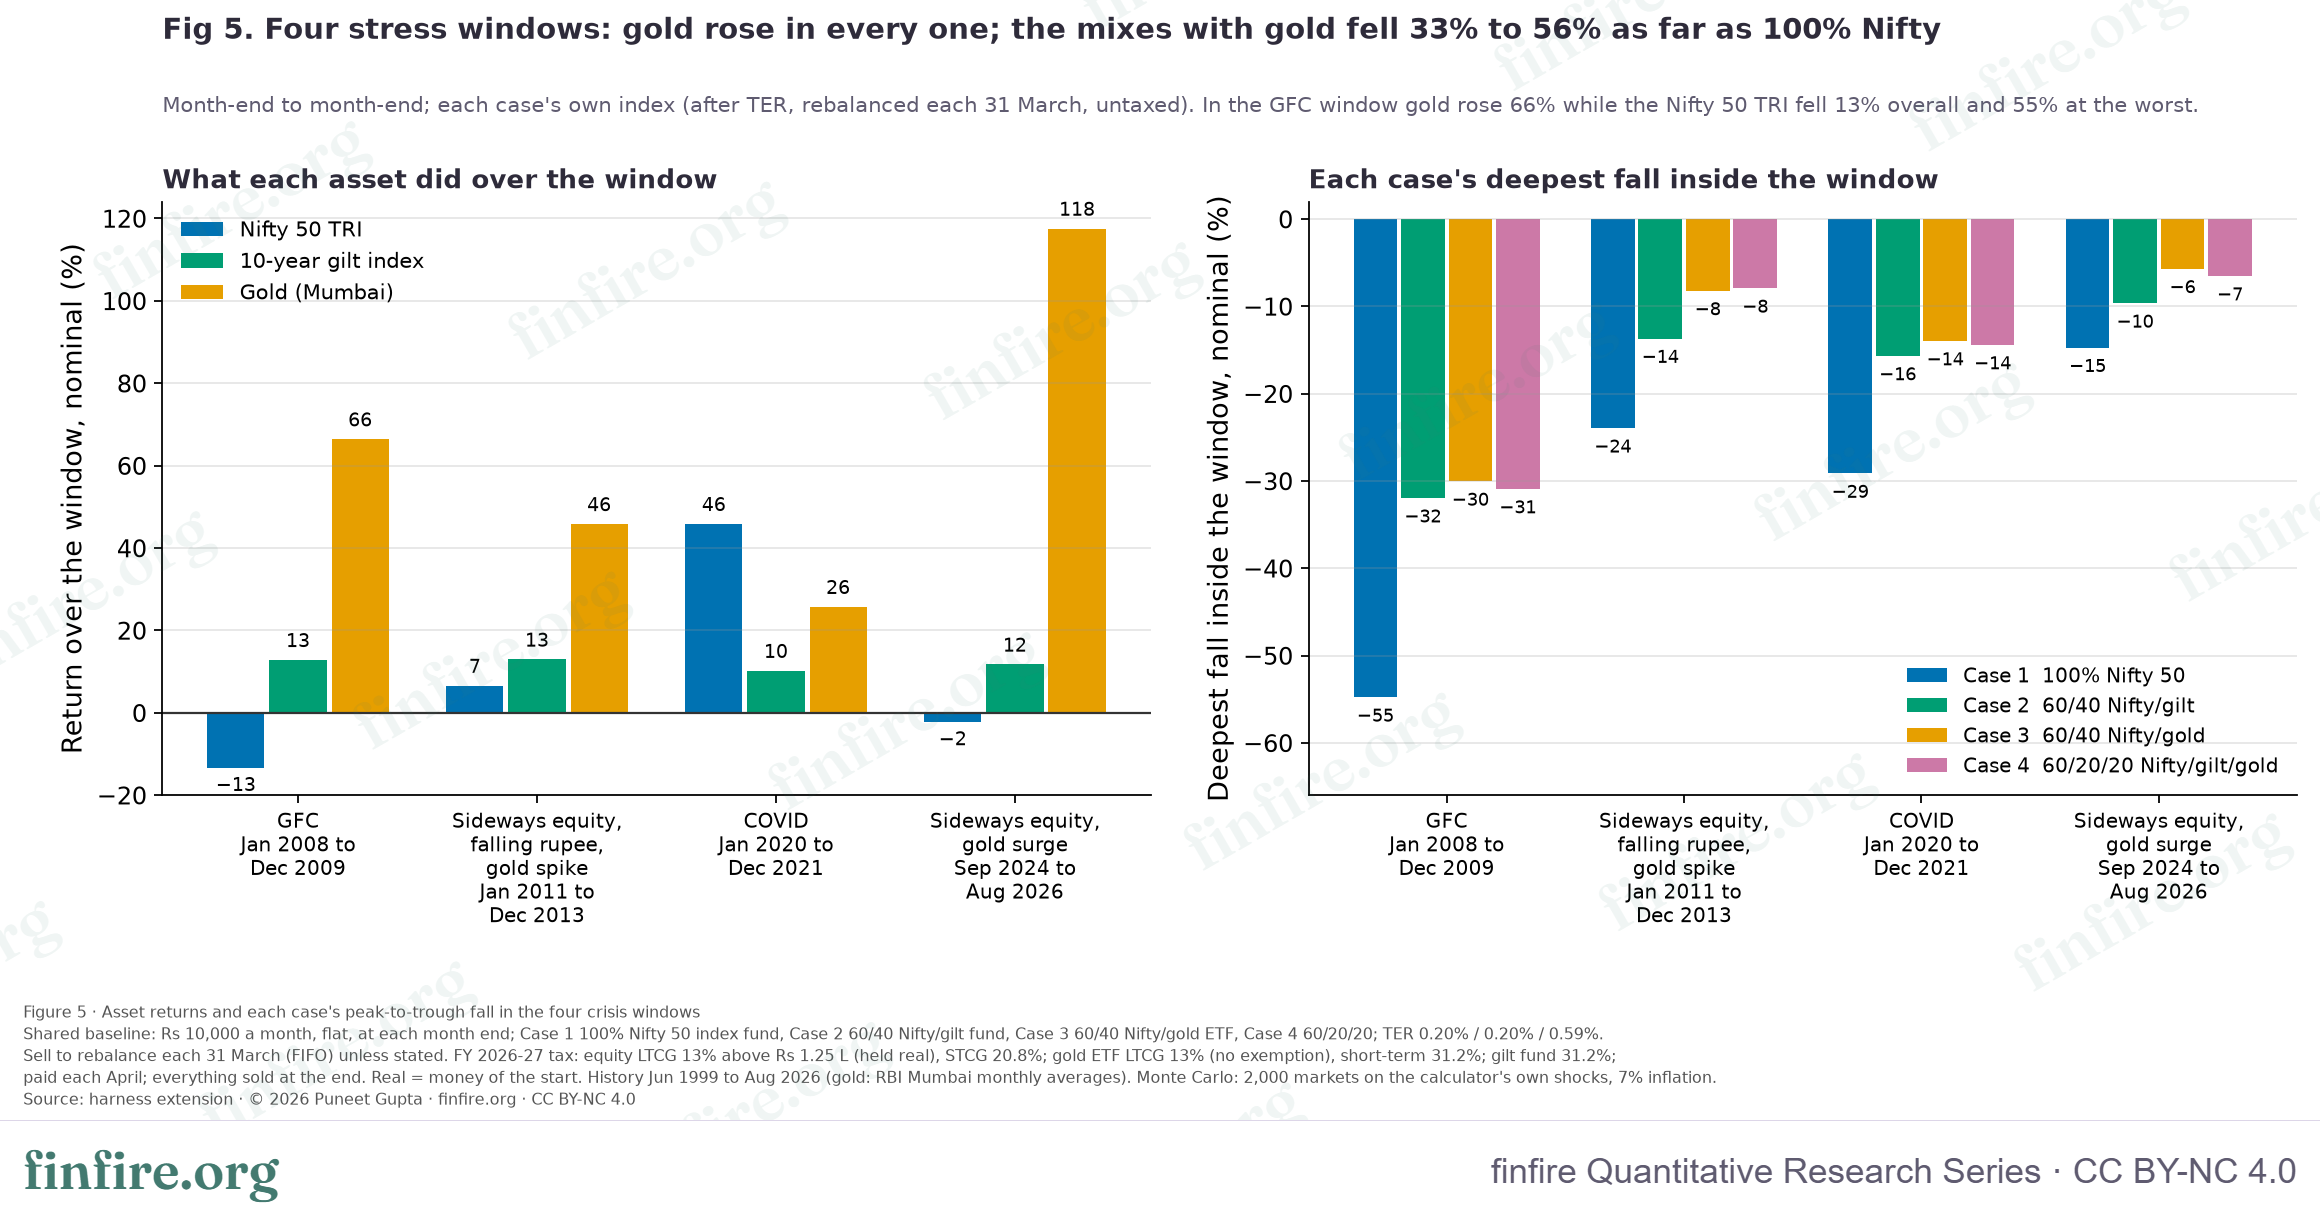
charts/fig5_crisis_windows_data.csv.Gold rose in all four windows: 66.4%, 45.8%, 25.7% and 117.5%. 100% Nifty had the deepest fall in every one. The gold mixes fell the least.
The last columns of Table 10 show a fresh 24-month SIP started at the start of each window. In COVID, equity bounced back so fast that 100% Nifty's SIP did best (32.5% a year). In the last two years, 60/40 Nifty/gold's SIP earned 15.6% a year and 100% Nifty's lost 0.3%.
Table 10 · The crisis windows
| Window | Nifty 50 TRI | Gilt | Gold | CPI | Rupee vs $ | 100% Nifty 50 deepest fall | 60/40 Nifty/gilt deepest fall | 60/40 Nifty/gold deepest fall | 60/20/20 deepest fall | 100% Nifty 50 24-month SIP XIRR | 60/40 Nifty/gilt 24-month SIP XIRR | 60/40 Nifty/gold 24-month SIP XIRR | 60/20/20 24-month SIP XIRR |
|---|---|---|---|---|---|---|---|---|---|---|---|---|---|
| GFC (Jan 2008 to Dec 2009) | −13.5% | 12.8% | 66.4% | 26.1% | 18.4% | −54.8% | −32.0% | −30.0% | −30.9% | 24.9% | 18.4% | 26.0% | 22.2% |
| Sideways equity, falling rupee, gold spike (Jan 2011 to Dec 2013) | 6.6% | 12.9% | 45.8% | 29.8% | 38.1% | −24.0% | −13.7% | −8.2% | −7.9% | 9.7% | 6.8% | 8.2% | 7.5% |
| COVID (Jan 2020 to Dec 2021) | 45.9% | 10.2% | 25.7% | 10.4% | 4.2% | −29.1% | −15.7% | −14.0% | −14.4% | 32.5% | 20.6% | 20.6% | 20.6% |
| Sideways equity, gold surge (Sep 2024 to Aug 2026) | −2.4% | 11.7% | 117.5% | 7.2% | 13.8% | −14.7% | −9.7% | −5.7% | −6.5% | −0.3% | 1.2% | 15.6% | 8.4% |
Inside and outside the crises. Across the 108 months of these windows, gold earned 23.4% a year (Nifty 3.1%, gilt 5.1%). Across the other 218 months it earned 10.0% a year (Nifty 18.6%, gilt 8.3%). So gold did its best work in the crises. It was not dead weight outside them: it still beat the gilt index and inflation (5.9%). Be careful with the crisis figure. We picked two of the four windows because gold surged in them, which flatters it.
What the March rebalances did
Table 11 follows the SIP that has been running since Jun 1999, through each crisis. Rebalancing does its job here. In March 2009, near the bottom, 60/20/20 sold ₹1,31,832 of gilt and ₹1,94,714 of gold and bought ₹3,26,546 of Nifty. The tax on that whole year, paid in April 2009, was ₹32,081. After the COVID bounce, in March 2021, the same mix did the opposite: it sold ₹14,55,632 of Nifty and bought gilt and gold.
Table 11 · What the March rebalances did (the SIP running since Jun 1999)
| Window | Case | Month end | Sold | Bought | Gains realised | Tax paid the next April (the whole year's) |
|---|---|---|---|---|---|---|
| GFC | 60/20/20 | Mar 2008 | Nifty ₹11,894, gold ₹49,094 | gilt ₹60,988 | equity long ₹9,265, gold long ₹30,691 | ₹3,990 |
| GFC | 60/20/20 | Mar 2009 | gilt ₹1,31,832, gold ₹1,94,714 | Nifty ₹3,26,546 | gold long ₹1,29,456, gilt ₹48,882 | ₹32,081 |
| GFC | 60/40 Nifty/gold | Mar 2008 | gold ₹56,349 | Nifty ₹56,349 | gold long ₹35,128 | ₹4,567 |
| GFC | 60/40 Nifty/gold | Mar 2009 | gold ₹3,95,840 | Nifty ₹3,95,840 | gold long ₹2,66,274 | ₹34,616 |
| Sideways equity, falling rupee, gold spike | 60/20/20 | Mar 2011 | gold ₹86,913 | Nifty ₹9,885, gilt ₹77,028 | gold long ₹60,976 | ₹8,097 |
| Sideways equity, falling rupee, gold spike | 60/20/20 | Mar 2012 | gilt ₹8,381, gold ₹2,55,173 | Nifty ₹2,63,554 | gold long ₹1,97,133, gilt ₹1,737 | ₹26,169 |
| Sideways equity, falling rupee, gold spike | 60/20/20 | Mar 2013 | Nifty ₹2,918, gilt ₹24,795 | gold ₹27,714 | equity long ₹2,436, gilt ₹6,996 | ₹2,720 |
| Sideways equity, falling rupee, gold spike | 60/40 Nifty/gold | Mar 2011 | gold ₹1,20,619 | Nifty ₹1,20,619 | gold long ₹86,651 | ₹11,625 |
| Sideways equity, falling rupee, gold spike | 60/40 Nifty/gold | Mar 2012 | gold ₹4,75,267 | Nifty ₹4,75,267 | gold long ₹3,68,192 | ₹47,926 |
| Sideways equity, falling rupee, gold spike | 60/40 Nifty/gold | Mar 2013 | Nifty ₹41,423 | gold ₹41,423 | equity long ₹34,309 | ₹1,583 |
| COVID | 60/20/20 | Mar 2020 | gilt ₹3,83,494, gold ₹7,08,918 | Nifty ₹10,92,412 | gold long ₹4,96,827, gilt ₹2,26,075 | ₹1,35,123 |
| COVID | 60/20/20 | Mar 2021 | Nifty ₹14,55,632 | gilt ₹7,43,103, gold ₹7,12,529 | equity long ₹12,89,633 | ₹1,26,931 |
| COVID | 60/40 Nifty/gold | Mar 2020 | gold ₹14,28,568 | Nifty ₹14,28,568 | gold long ₹10,81,396 | ₹1,40,581 |
| COVID | 60/40 Nifty/gold | Mar 2021 | Nifty ₹16,52,810 | gold ₹16,52,810 | equity long ₹13,13,321 | ₹1,27,772 |
| Sideways equity, gold surge | 60/20/20 | Mar 2025 | gold ₹7,68,066 | Nifty ₹6,68,144, gilt ₹99,922 | gold long ₹5,13,957 | ₹66,927 |
| Sideways equity, gold surge | 60/20/20 | Mar 2026 | gold ₹26,74,100 | Nifty ₹22,17,774, gilt ₹4,56,326 | gold long ₹21,74,852 | ₹2,86,149 |
| Sideways equity, gold surge | 60/40 Nifty/gold | Mar 2025 | gold ₹14,28,505 | Nifty ₹14,28,505 | gold long ₹11,08,095 | ₹1,44,609 |
| Sideways equity, gold surge | 60/40 Nifty/gold | Mar 2026 | gold ₹51,04,942 | Nifty ₹51,04,942 | gold long ₹41,25,151 | ₹5,40,934 |
The tax column is the whole year's tax, not just the tax on that March's sale.
*
8. How much gold has to earn
Since gold's return decides the answer, we asked: at what return does each mix draw level with 100% Nifty? We held every other input at the brief's value and moved gold's median return from 2% to 20% a year.
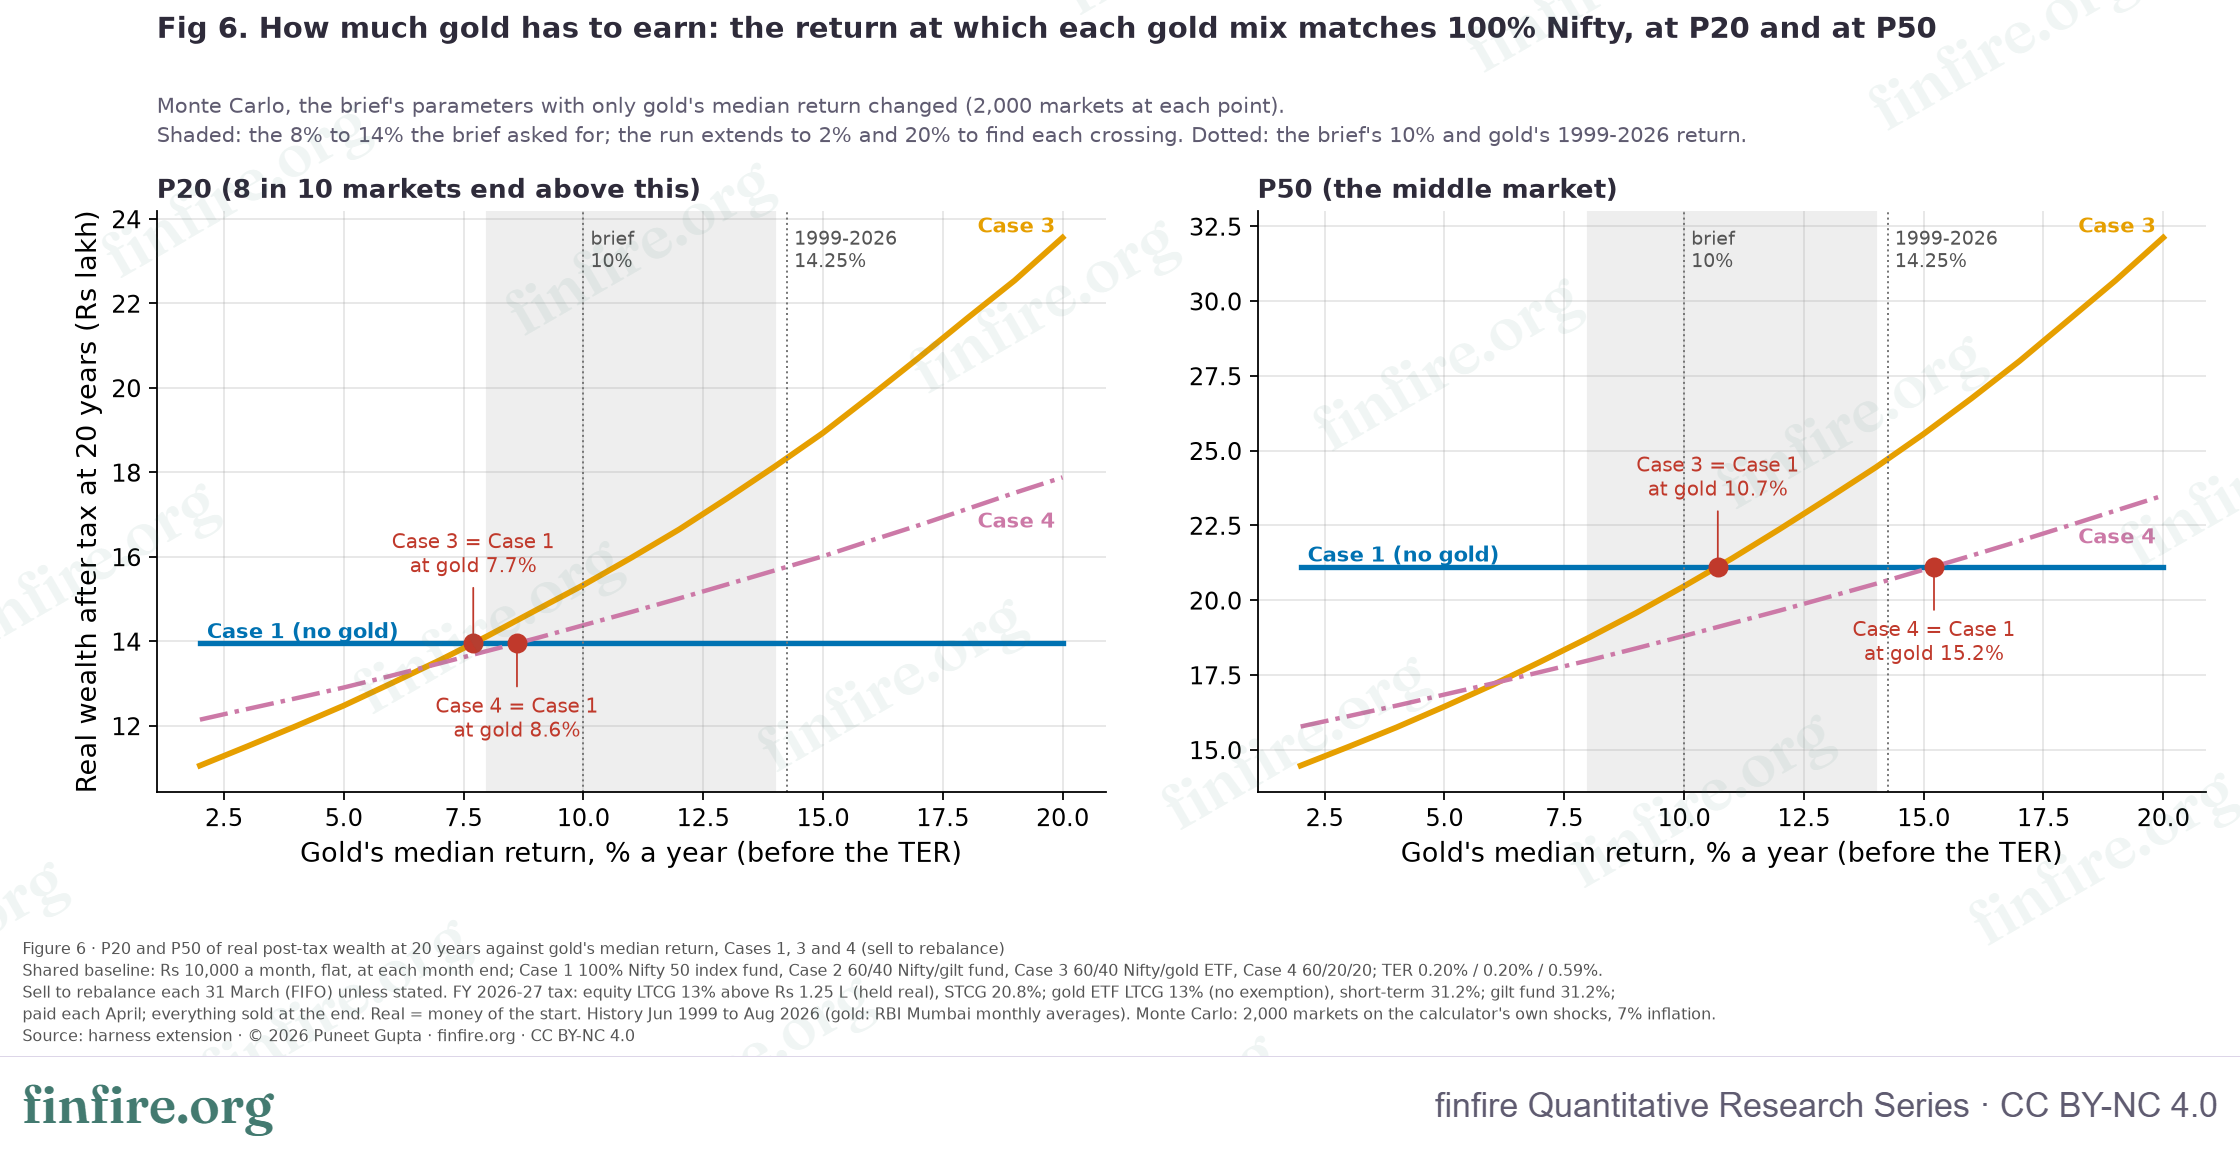
charts/fig6_gold_sweep_data.csv.- For the bad-luck outcome, the bar is low. 60/40 Nifty/gold's P20 draws level with 100% Nifty's when gold earns 7.7% a year. Its P10 needs only 5.9%.
- For the median, the bar is higher. 60/40 Nifty/gold's median draws level at 10.7%.
- 60/20/20 needs more. Its P20 needs 8.6% and its median 15.2%. With the historical inputs its median needs 16.3%.
- The gilt mix never draws level with 100% Nifty at P20 or P50, at any gold return. It holds no gold.
Table 12 · How much gold must earn
| Mix and percentile | Brief's parameters: gold return where it equals Case 1 (8–14% / 2–20%) | Historical parameters (8–14% / 2–20%) |
|---|---|---|
| Case 3 P20 | above at every point / 7.7% | above at every point / 6.7% |
| Case 3 P50 | 10.7% / 10.7% | 11.5% / 11.5% |
| Case 4 P20 | 8.6% / 8.6% | above at every point / 6.3% |
| Case 4 P50 | below at every point / 15.2% | below at every point / 16.3% |
| Case 3 P10 | above at every point / 5.9% | above at every point / 4.1% |
| Case 4 P10 | above at every point / 4.5% | above at every point / above at every point |
| Case 2 P20 | below at every point / below at every point | below at every point / below at every point |
| Case 2 P50 | below at every point / below at every point | below at every point / below at every point |
Each cell gives two answers: one from the narrow search (gold at 8% to 14%) and one from the wide search (2% to 20%). "Above at every point" means the mix beat 100% Nifty everywhere in that range; "below at every point" means it never did. Case 3 is 60/40 Nifty/gold and Case 4 is 60/20/20.
Part of gold's 14.25% is the rupee. Gold is priced in dollars, so a falling rupee lifts it in India. The rupee went from ₹43.36 to ₹95.45 a dollar over our window. Gold's monthly changes moved with the rupee's at a correlation of 0.16 (0.21 over 12 months). Mumbai gold also sat a median 7.1% above world gold in rupees, mostly import duty, with a peak of 23.0% in Dec 2013. If the rupee falls more slowly, or duty falls, Indian gold can earn less than world gold.
*
9. Correlations
Gold helps a mix most when it moves against equity. Figure 7 shows how the two moved together, 36 months at a time.
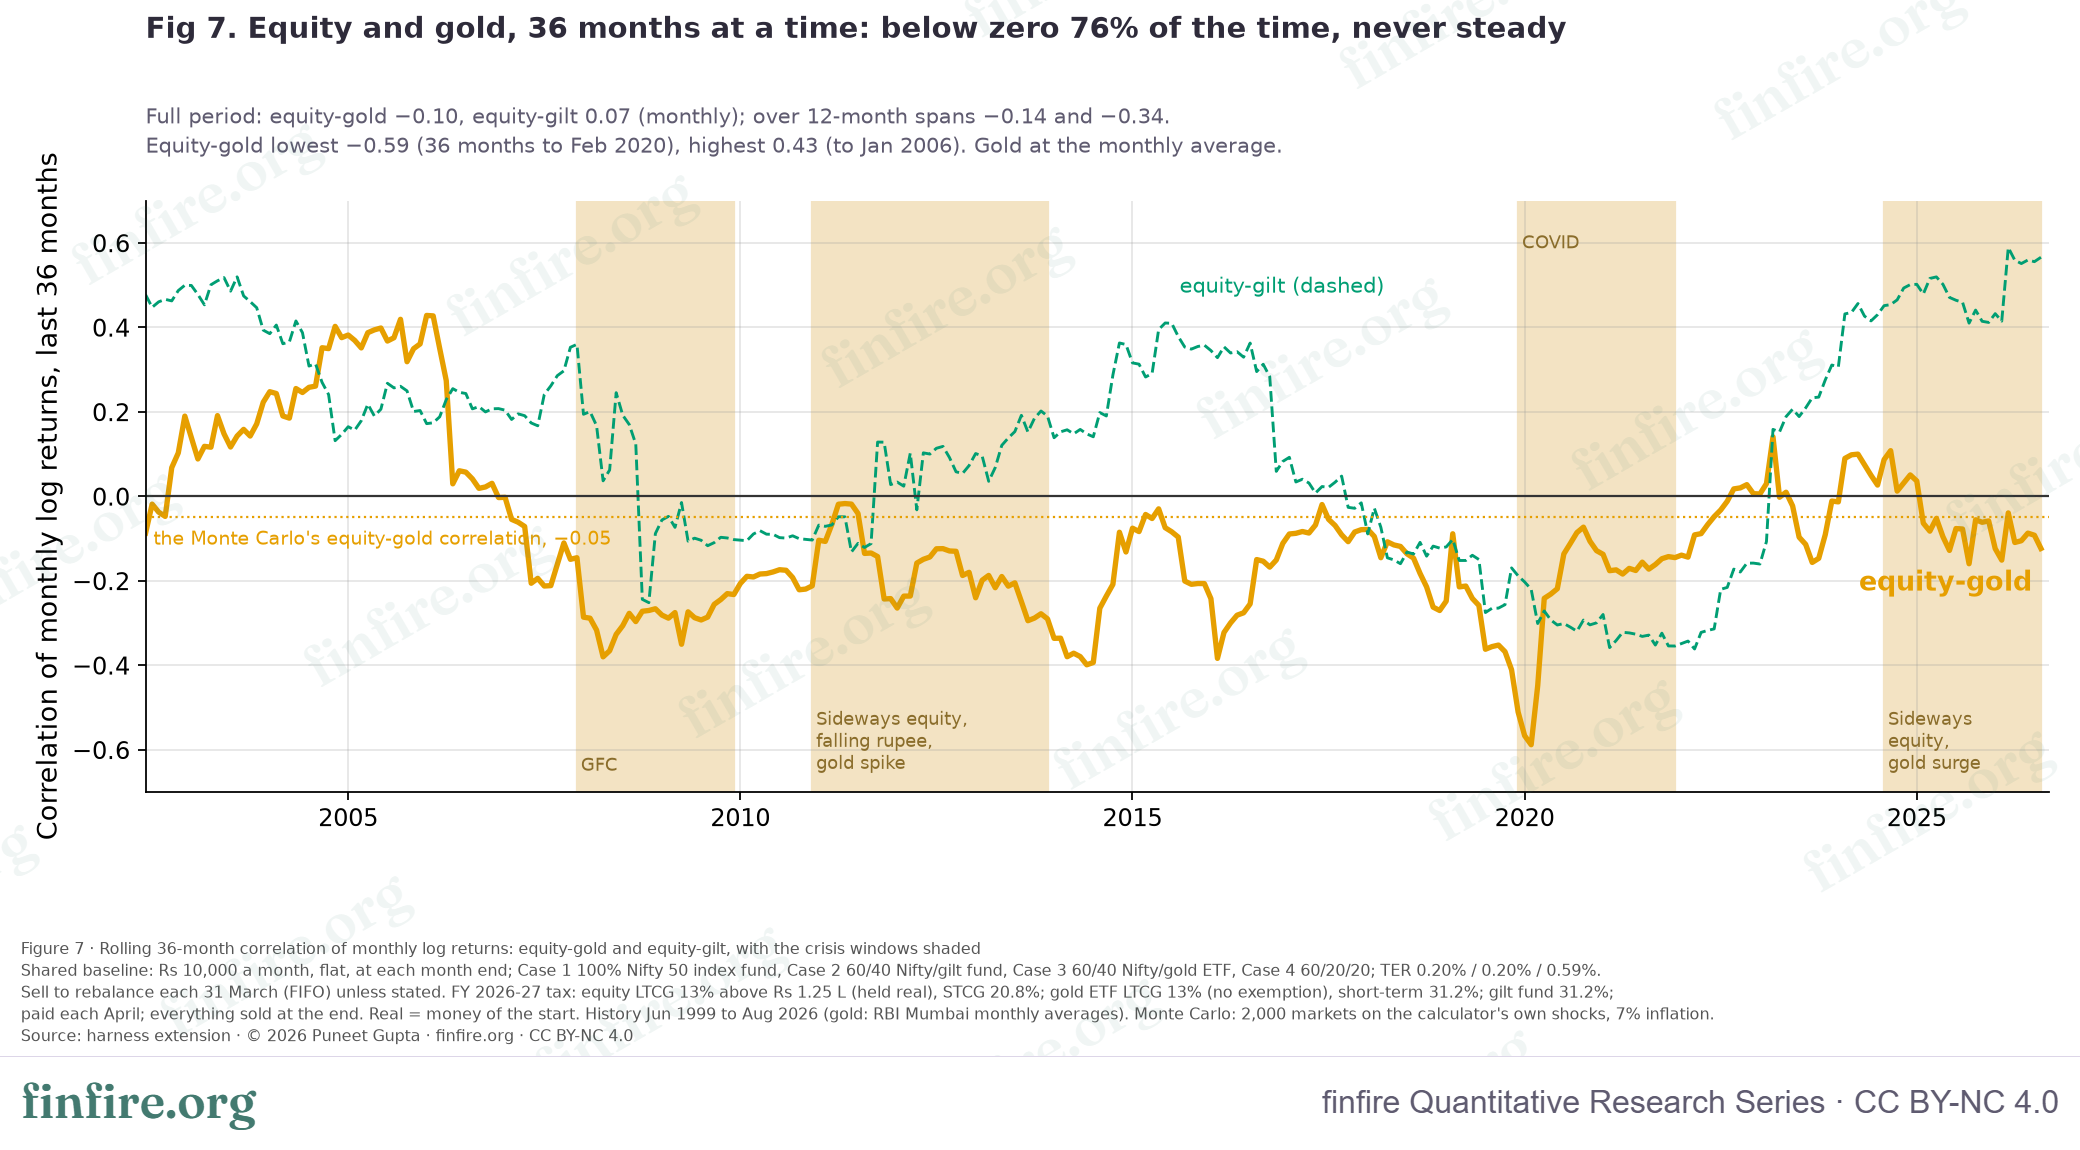
charts/fig7_rolling_correlation_data.csv.Over the whole period, equity and gold moved slightly against each other (−0.10 on monthly returns). The link was not steady. It swung from −0.59 to 0.43, and was below zero in 76% of the 36-month windows.
In equity's worst 10% of months, gold rose in 70% of them. Its average gain in those months was 2.45%, against 1.11% in an average month. Gold beat the Nifty 50 in 50% of 12-month spans, 45% of 36-month spans and 37% of 60-month spans.
Table 13 · Correlations
| Measure | Equity–gold | Equity–gilt | Gold–gilt |
|---|---|---|---|
| Brief's Monte Carlo (Step 1 fill-ins) | −0.05 | 0.1 | 0.05 |
| Monthly log returns, 326 months | −0.104 | 0.071 | −0.022 |
| Monthly, gold at the estimated month end | −0.071 | −0.047 | |
| Overlapping 12-month returns (used in the historical Monte Carlo) | −0.143 | −0.345 | −0.092 |
| Within equity's worst 10% of months (33) | −0.050 | −0.251 | 0.167 |
| 36-month rolling: min / median / max | −0.59 / −0.12 / 0.43 | −0.36 / 0.15 / 0.59 | −0.32 / −0.00 / 0.49 |
| 36-month rolling: share below zero | 76% | 35% | 51% |
As Section 4 showed, the correlations matter much less than gold's return. Setting every correlation to zero moves 60/40 Nifty/gold's P20 by −0.87%.
*
10. By horizon
Does the picture change with time? Figure 8 shows P20 and P50 at 10, 15, 20 and 25 years, on the brief's inputs.
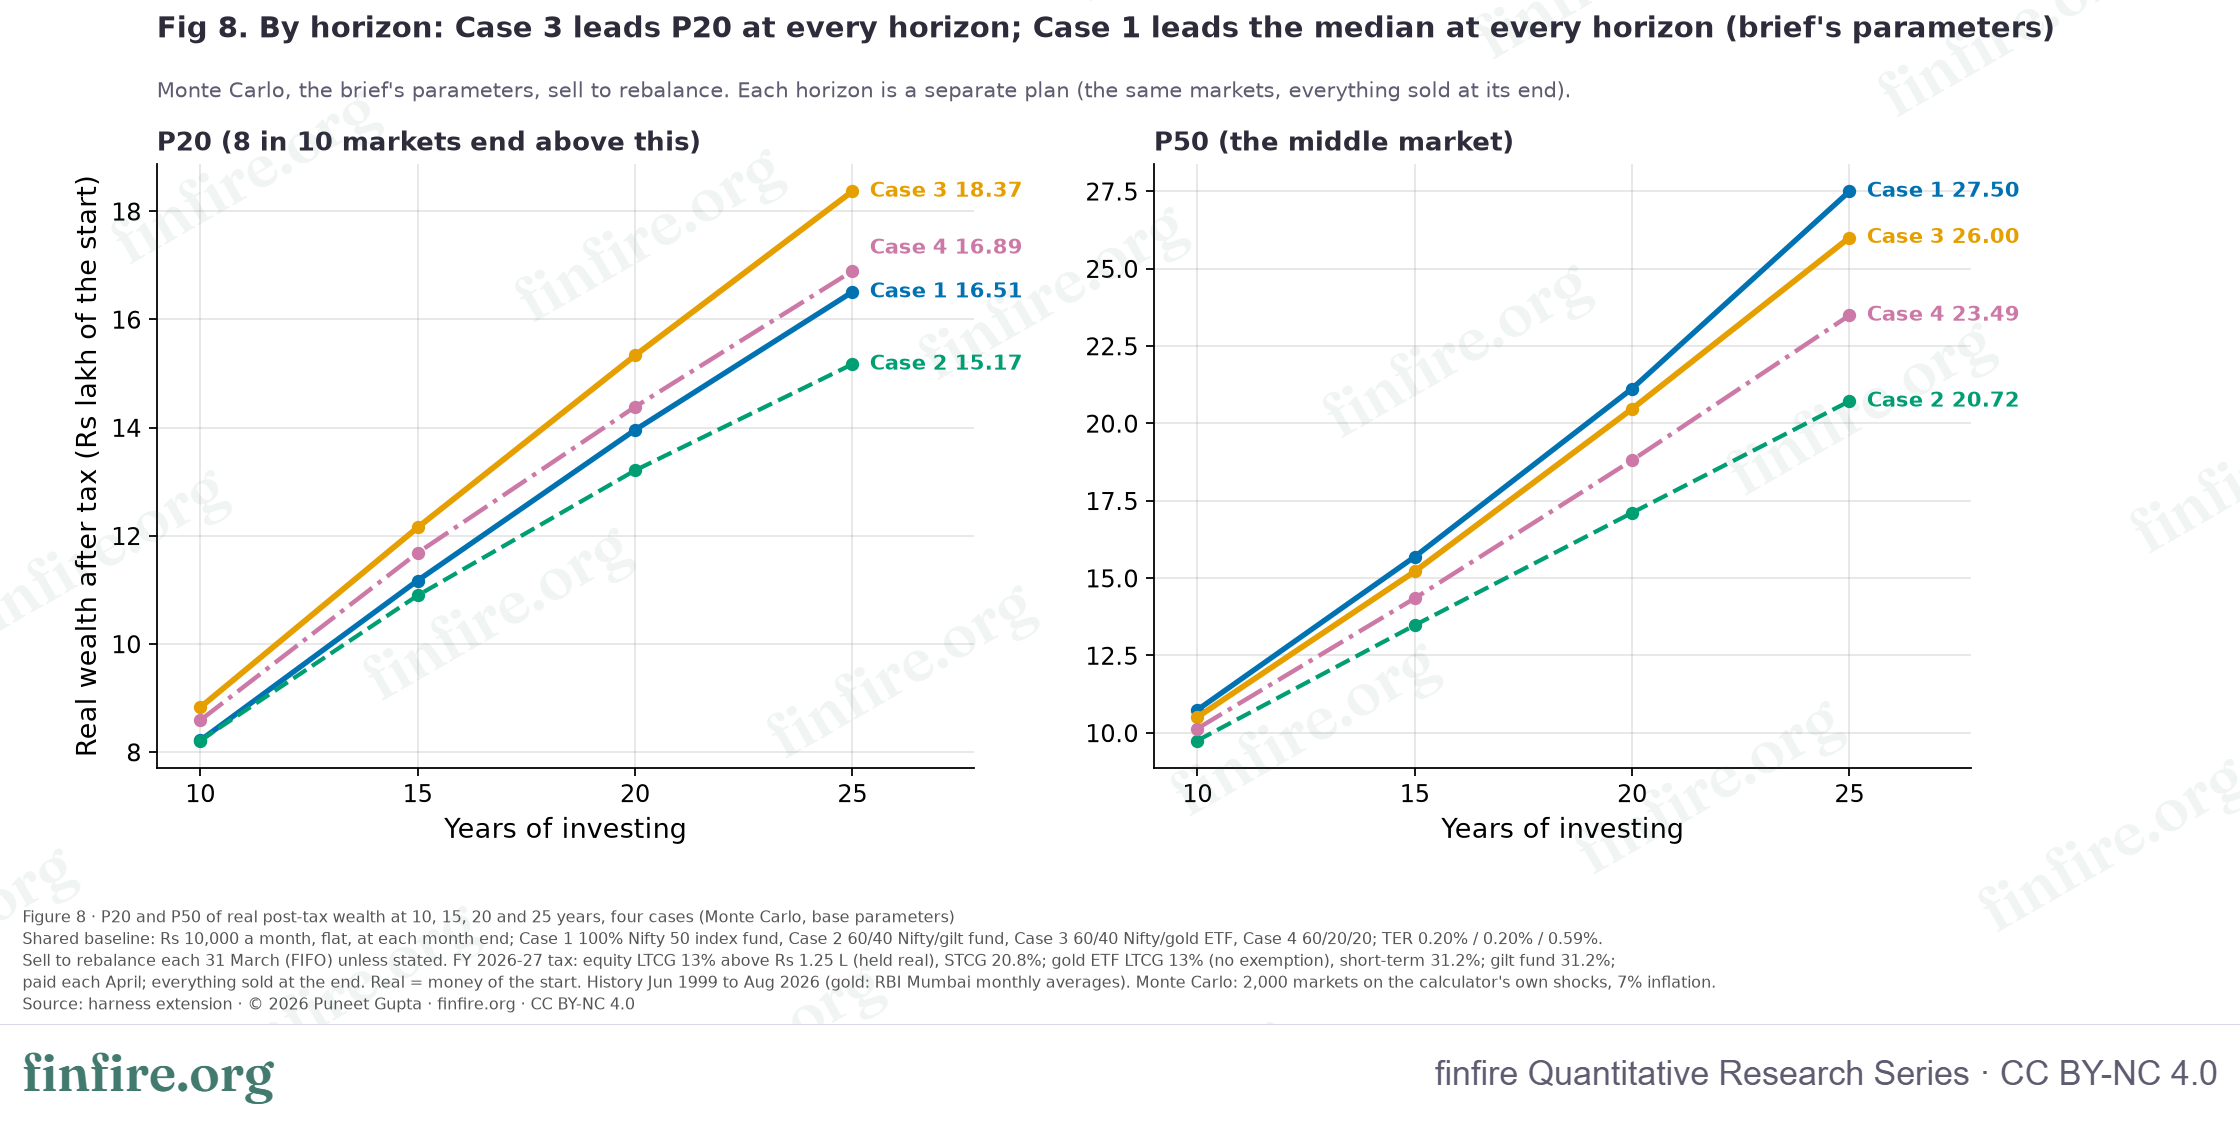
charts/fig8_horizons_data.csv.The pattern holds at every horizon. 60/40 Nifty/gold has the best bad-luck outcome, and 100% Nifty has the best median. The longer the horizon, the more median 100% Nifty gains.
Table 14 · By horizon (Monte Carlo, brief's parameters)
| Years | 100% Nifty 50 P20 / P50 | 60/40 Nifty/gilt P20 / P50 | 60/40 Nifty/gold P20 / P50 | 60/20/20 P20 / P50 | Leader at P20 | Leader at P50 |
|---|---|---|---|---|---|---|
| 10 | ₹8.22 L / ₹10.74 L | ₹8.21 L / ₹9.75 L | ₹8.83 L / ₹10.51 L | ₹8.59 L / ₹10.14 L | Case 3 | Case 1 |
| 15 | ₹11.17 L / ₹15.69 L | ₹10.90 L / ₹13.48 L | ₹12.15 L / ₹15.21 L | ₹11.68 L / ₹14.35 L | Case 3 | Case 1 |
| 20 | ₹13.96 L / ₹21.12 L | ₹13.21 L / ₹17.11 L | ₹15.33 L / ₹20.47 L | ₹14.38 L / ₹18.81 L | Case 3 | Case 1 |
| 25 | ₹16.51 L / ₹27.50 L | ₹15.17 L / ₹20.72 L | ₹18.37 L / ₹26.00 L | ₹16.89 L / ₹23.49 L | Case 3 | Case 1 |
*
11. What this means for you
This paper describes a model of Indian markets from 1999 to 2026 and 2,000 simulated ones. It does not say what you should hold. A few plain readings of the numbers:
- Gold's future return is the key unknown. If gold earns about 10% a year, 100% Nifty keeps the higher median and gold buys a better bad-luck outcome for a small cost. If it earns more than about 10.7%, 60/40 Nifty/gold wins on both. History gave 14.25%, partly from a falling rupee and import duty.
- The bad-luck case for gold is broad. 60/40 Nifty/gold's P20 beat 100% Nifty's whenever gold earned 7.7% or more in our model. In history it also cut the longest spell below an earlier peak from 156 months to 46.
- The gilt fund did not do this job. A 40% gilt fund lowered the median and did not lift P20 at 20 years. Its gains are taxed at the slab. At a 0% slab its P20 (₹14.21 L) edges above 100% Nifty's (₹13.96 L), but its median stays far lower (₹18.39 L against ₹21.12 L; Table A1).
- 60/20/20 is not a halfway house. It kept less of gold's benefit than 60/40 Nifty/gold and gave up more median.
- Rebalancing each March did not cost what we expected. In the simulation it paid less tax than the other methods, because each year's sale used that year's ₹1.25 L exemption. In history it paid a little more tax, because gold has no exemption, and still had the best median return.
- Your numbers will differ. A different SIP, horizon, tax slab or gold return changes the answer. The links in Section 13 let you test your own.
*
12. Limitations
- There is little independent history. The data hold about 1.36 independent 20-year stretches (2.72 at 10 years, 1.81 at 15 years, 1.36 at 20 years and 1.09 at 25 years). The bootstrap rebuilds the same history. The Monte Carlo is a model.
- Our gold price is a monthly average. It is RBI's Mumbai price, not a month-end price and not an ETF's NAV. Averaging smooths it: its yearly volatility from monthly changes is 12.2%, against about 14.9% once corrected. Using an estimated month-end price moves the results little (Table A1).
- Gold ETFs started in India in 2007. Before that, the gold leg is the domestic price less an ETF's fee, as if an ETF had existed.
- Today's tax rules are applied to every past year. In fact, equity LTCG was nil from 2004 to 2018, and gold ETFs were long-term only after 36 months, with indexation, until 2024. No surcharge, STT or trading costs.
- The gilt leg is a 10-year government bond index. It is not the short-duration debt fund many investors hold.
- The crisis windows include two picked for a gold surge.
- The calculator links are stand-ins. The calculator has no gold, no third sleeve, no tax at sale and no correlation between assets (Section 13).
- Not advice. Nothing here says what to hold.
*
13. Try this scenario yourself
The calculator (accumulate.finfire.org) holds up to two assets, equity and debt, and rebalances them each year without tax. It has no gold and no third sleeve. So to show 60/40 Nifty/gold, we type gold's return into the debt field. The page calls it debt; here it carries gold. Its simulated markets treat the two as unconnected. The page's figures are before tax, so they sit above the paper's after-tax ones. Returns typed below are after the fund's fee. Inflation is the page's default, 7%. Sign in before you open the links. Steps marked (Pro) need a Pro account.
Step 1 · 100% Nifty, ₹10,000 a month for 20 years. One return of 11.78% (12% less the 0.20% fee). The page should show: After 20 years you will have ₹89.58 L — ₹23.15 L in today’s money. → Open 100% Nifty
Step 2 · The same with Simulated markets (Pro). Volatility 17%. The page should show: After 20 years you will have ₹89.58 L — ₹23.15 L in today’s money. In 2,000 simulated markets, 9 in 10 end with at least ₹11.88 L, half with at least ₹23.19 L, and 1 in 10 with ₹47.59 L or more (in today’s money). Half with at least ₹23.19 L is close to the paper's median before any tax (₹23.18 L, Table 6). → Open 100% Nifty with Simulated markets
Step 3 · 60/40 Nifty/gilt (Pro). Equity and debt at 60% equity, equity 11.78%, debt 7.04% (the gilt fund: 7.25% less 0.20%), volatilities 17% and 3.5%. The page should show: After 20 years you will have ₹71.41 L — ₹18.45 L in today’s money. In 2,000 simulated markets, 9 in 10 end with at least ₹12.83 L, half with at least ₹19.26 L, and 1 in 10 with ₹29.72 L or more (in today’s money). → Open 60/40 Nifty/gilt
Step 4 · 60/40 Nifty/gold, with gold at 10% (Pro). Gold's return less its fee (9.35% = 10% less 0.59%) in the Debt return field, and gold's volatility (14.5%) in Market volatility of debt. The page should show: After 20 years you will have ₹79.71 L — ₹20.60 L in today’s money. In 2,000 simulated markets, 9 in 10 end with at least ₹14.07 L, half with at least ₹22.25 L, and 1 in 10 with ₹36.34 L or more (in today’s money). → Open 60/40 Nifty/gold at 10%
Step 5 · 60/40 Nifty/gold, with gold at its history (Pro). 13.57% in the debt field (14.25% from Jun 1999 to Aug 2026, less the 0.59% fee) and volatility 14.6%. The page should show: After 20 years you will have ₹97.68 L — ₹25.24 L in today’s money. In 2,000 simulated markets, 9 in 10 end with at least ₹17.10 L, half with at least ₹27.31 L, and 1 in 10 with ₹45.28 L or more (in today’s money). → Open 60/40 Nifty/gold at gold's history
Step 6 · 100% Nifty with an 8% yearly raise (Pro). The SIP rises 8% a year from year 2, with Simulated markets on. The page should show: After 20 years you will have ₹1.56 Cr — ₹40.22 L in today’s money. In 2,000 simulated markets, 9 in 10 end with at least ₹22.76 L, half with at least ₹40.78 L, and 1 in 10 with ₹76.77 L or more (in today’s money). → Open 100% Nifty with a yearly raise
Step 7 · Compare all equity with 60/40 Nifty/gold (Pro). Open the plan from Step 2. Under Compare (Pro) press Pin this plan. Tick Split between equity and debt. Type Equity return 11.78, Debt return 9.35 (gold's return), Equity share 60 and Market volatility of debt 14.5 (gold's volatility). The page should show After 20 years you will have ₹79.71 L — ₹20.60 L in today’s money. The Compare card should say that both plans stop working in the same year, with ₹2.55 L less in today’s money. → Open 100% Nifty with Simulated markets
Step 8 · Swap the gilt for gold (Pro). Open the plan from Step 3 and press Pin this plan. Change Debt return to 9.35 and Market volatility of debt to 14.5. The page should show After 20 years you will have ₹79.71 L — ₹20.60 L in today’s money. The Compare card should say that both plans stop working in the same year, with ₹2.14 L more in today’s money. → Open 60/40 Nifty/gilt
Step 9 · Gold at 10% against gold at its history (Pro). Open the plan from Step 4 and press Pin this plan. Change Debt return to 13.57 and Market volatility of debt to 14.6. The page should show After 20 years you will have ₹97.68 L — ₹25.24 L in today’s money. The Compare card should say that both plans stop working in the same year, with ₹4.64 L more in today’s money. → Open 60/40 Nifty/gold at 10%
Step 10 · Put in your own numbers. In any of these plans, change the monthly amount, the years, the inflation and the returns to yours. For gold, a fair Debt return is the gold return you expect, less your ETF's fee. Press Pin this plan on one version, then change the other. Remember that the page leaves out tax, the link between the assets and a third sleeve.
*
14. Reproducibility
Every number in this paper can be checked.
- Calculator links. The calculator links are listed in urls.csv, below this section, with the plan each opens and the answer it gives. Every link was re-opened in a fresh copy of the real page: 27 values, 0 failures.
- Harness against the calculator. Our simulation code was run against the real accumulate page on 22 steady plans, at every plan year. It was also run against the page's own simulated markets, every market and every year end, for 100% Nifty, 60/40 Nifty/gilt and the 60/40 Nifty/gold stand-in. The largest gap was ₹0.00000019.
- Independent check. A separate plain-Python program, sharing no code with the harness, recomputed 20 headline numbers. 0 failures.
- Compare and study. The Compare setups and the study were checked on the real page.
- Rerun. We ran
run_all.shtwice and compared the file hashes. The result is indata/rerun_check.txt. - Figures and tables. The numbers drawn in each figure are in the CSV named in its caption.
*
Appendix
Table A1 · Every variant at 20 years
Each cell shows three lines: the Monte Carlo P20 / P50, the bootstrap P20 / P50, and the history median / worst real XIRR after tax. A dash means that engine does not apply.
| Variant (20 years, sell to rebalance) | 100% Nifty 50: MC P20 / P50<br>bootstrap P20 / P50<br>history median / min real XIRR | 60/40 Nifty/gilt: MC P20 / P50<br>bootstrap P20 / P50<br>history median / min real XIRR | 60/40 Nifty/gold: MC P20 / P50<br>bootstrap P20 / P50<br>history median / min real XIRR | 60/20/20: MC P20 / P50<br>bootstrap P20 / P50<br>history median / min real XIRR |
|---|---|---|---|---|
| Base | ₹13.96 L / ₹21.12 L<br>₹19.13 L / ₹33.10 L<br>5.84% / 3.66% | ₹13.21 L / ₹17.11 L<br>₹18.30 L / ₹24.82 L<br>3.69% / 2.46% | ₹15.33 L / ₹20.47 L<br>₹24.79 L / ₹34.73 L<br>6.19% / 4.97% | ₹14.38 L / ₹18.81 L<br>₹21.53 L / ₹29.30 L<br>4.97% / 3.74% |
| Method: buy-and-hold | ₹13.96 L / ₹21.12 L<br>₹19.13 L / ₹33.10 L<br>5.84% / 3.66% | ₹12.83 L / ₹17.23 L<br>₹17.31 L / ₹25.40 L<br>3.78% / 2.13% | ₹15.03 L / ₹20.24 L<br>₹23.39 L / ₹33.24 L<br>5.26% / 3.80% | ₹14.05 L / ₹18.68 L<br>₹20.82 L / ₹29.31 L<br>4.62% / 3.01% |
| Method: new money only | ₹13.96 L / ₹21.12 L<br>₹19.13 L / ₹33.10 L<br>5.84% / 3.66% | ₹12.86 L / ₹16.71 L<br>₹17.41 L / ₹24.29 L<br>3.26% / 1.92% | ₹14.85 L / ₹19.94 L<br>₹23.86 L / ₹33.77 L<br>5.50% / 4.24% | ₹14.02 L / ₹18.27 L<br>₹20.99 L / ₹28.82 L<br>4.44% / 3.11% |
| No tax anywhere (pre-tax) | ₹14.94 L / ₹23.18 L<br>₹20.85 L / ₹36.73 L<br>6.61% / 4.36% | ₹14.64 L / ₹19.22 L<br>₹20.68 L / ₹28.14 L<br>4.57% / 3.38% | ₹16.43 L / ₹22.34 L<br>₹27.21 L / ₹38.65 L<br>6.98% / 5.68% | ₹15.70 L / ₹20.83 L<br>₹24.16 L / ₹32.97 L<br>5.81% / 4.56% |
| Gilt fund gains at a 0% slab (gold's short-term gains still at 31.2%) | ₹13.96 L / ₹21.12 L<br>₹19.13 L / ₹33.10 L<br>5.84% / 3.66% | ₹14.21 L / ₹18.39 L<br>₹19.88 L / ₹26.71 L<br>4.18% / 3.15% | ₹15.33 L / ₹20.47 L<br>₹24.79 L / ₹34.73 L<br>6.19% / 4.97% | ₹14.94 L / ₹19.50 L<br>₹22.46 L / ₹30.40 L<br>5.20% / 4.08% |
| Exemption fixed at ₹1.25 L nominal | ₹13.85 L / ₹21.01 L<br>₹19.02 L / ₹32.99 L<br>5.81% / 3.62% | ₹13.06 L / ₹16.91 L<br>₹18.12 L / ₹24.52 L<br>3.59% / 2.38% | ₹15.18 L / ₹20.28 L<br>₹24.49 L / ₹34.39 L<br>6.07% / 4.86% | ₹14.23 L / ₹18.60 L<br>₹21.28 L / ₹29.05 L<br>4.86% / 3.63% |
| Gold shares the ₹1.25 L exemption (the brief's reading) | ₹13.96 L / ₹21.12 L<br>₹19.13 L / ₹33.10 L<br>5.84% / 3.66% | ₹13.21 L / ₹17.11 L<br>₹18.30 L / ₹24.82 L<br>3.69% / 2.46% | ₹15.60 L / ₹20.82 L<br>₹25.26 L / ₹35.43 L<br>6.40% / 5.14% | ₹14.57 L / ₹19.03 L<br>₹21.87 L / ₹29.71 L<br>5.11% / 3.86% |
| Yearly raise of 8% from year 2 | ₹25.91 L / ₹37.44 L<br>₹34.64 L / ₹55.92 L<br>5.89% / 2.78% | ₹24.96 L / ₹31.26 L<br>₹33.28 L / ₹43.48 L<br>3.75% / 1.90% | ₹28.23 L / ₹36.12 L<br>₹42.75 L / ₹57.77 L<br>6.09% / 4.33% | ₹26.86 L / ₹33.55 L<br>₹38.34 L / ₹50.11 L<br>4.97% / 3.14% |
| ₹1,00,000 a month | ₹1.38 Cr / ₹2.10 Cr<br>₹1.90 Cr / ₹3.30 Cr<br>5.80% / 3.61% | ₹1.29 Cr / ₹1.67 Cr<br>₹1.79 Cr / ₹2.41 Cr<br>3.45% / 2.18% | ₹1.50 Cr / ₹2.00 Cr<br>₹2.42 Cr / ₹3.39 Cr<br>5.95% / 4.73% | ₹1.41 Cr / ₹1.84 Cr<br>₹2.11 Cr / ₹2.86 Cr<br>4.72% / 3.49% |
| ₹1,00,000 a month, exemption fixed nominal | ₹1.38 Cr / ₹2.10 Cr<br>₹1.90 Cr / ₹3.29 Cr<br>5.80% / 3.61% | ₹1.29 Cr / ₹1.66 Cr<br>₹1.78 Cr / ₹2.40 Cr<br>3.41% / 2.15% | ₹1.49 Cr / ₹1.99 Cr<br>₹2.41 Cr / ₹3.38 Cr<br>5.91% / 4.71% | ₹1.41 Cr / ₹1.83 Cr<br>₹2.10 Cr / ₹2.85 Cr<br>4.69% / 3.46% |
| Gold ETF TER 0.81% (Nippon India ETF Gold BeES) | ₹13.96 L / ₹21.12 L<br>₹19.13 L / ₹33.10 L<br>5.84% / 3.66% | ₹13.21 L / ₹17.11 L<br>₹18.30 L / ₹24.82 L<br>3.69% / 2.46% | ₹15.18 L / ₹20.25 L<br>₹24.51 L / ₹34.30 L<br>6.10% / 4.88% | ₹14.30 L / ₹18.71 L<br>₹21.41 L / ₹29.13 L<br>4.92% / 3.70% |
| Gold at the estimated month-end price (history to Jul 2026) | —<br>₹19.10 L / ₹33.24 L<br>5.84% / 3.66% | —<br>₹18.13 L / ₹24.91 L<br>3.69% / 2.46% | —<br>₹24.20 L / ₹34.75 L<br>6.20% / 5.06% | —<br>₹21.22 L / ₹29.59 L<br>5.00% / 3.79% |
| MC: Every correlation 0 (the page's own simulated markets, with gold on its own stream) | ₹13.96 L / ₹21.12 L<br>—<br>— | ₹13.26 L / ₹17.14 L<br>—<br>— | ₹15.20 L / ₹20.32 L<br>—<br>— | ₹14.37 L / ₹18.79 L<br>—<br>— |
| MC: Historical parameters, Jun 1999 to Aug 2026 (median = CAGR; vol and correlations from 12-month returns) | ₹14.20 L / ₹24.51 L<br>—<br>— | ₹14.10 L / ₹19.52 L<br>—<br>— | ₹19.55 L / ₹27.80 L<br>—<br>— | ₹16.89 L / ₹23.43 L<br>—<br>— |
| MC: Base, but gold at its historical return | ₹13.96 L / ₹21.12 L<br>—<br>— | ₹13.21 L / ₹17.11 L<br>—<br>— | ₹18.33 L / ₹24.71 L<br>—<br>— | ₹15.76 L / ₹20.67 L<br>—<br>— |
| MC: Historical, but gold at the brief's 10% | ₹14.20 L / ₹24.51 L<br>—<br>— | ₹14.10 L / ₹19.52 L<br>—<br>— | ₹16.28 L / ₹22.96 L<br>—<br>— | ₹15.38 L / ₹21.30 L<br>—<br>— |
| MC: Base, but equity at its historical median and volatility | ₹14.20 L / ₹24.51 L<br>—<br>— | ₹13.67 L / ₹19.22 L<br>—<br>— | ₹16.02 L / ₹22.96 L<br>—<br>— | ₹14.96 L / ₹21.00 L<br>—<br>— |
| MC: Inflation 6.5% (exemption and real values at 6.5%) | ₹15.31 L / ₹23.18 L<br>—<br>— | ₹14.49 L / ₹18.77 L<br>—<br>— | ₹16.82 L / ₹22.47 L<br>—<br>— | ₹15.78 L / ₹20.64 L<br>—<br>— |
| MC: Second seed (20260928 for equity and debt, 20261113 for gold) | ₹14.05 L / ₹21.17 L<br>—<br>— | ₹13.26 L / ₹17.13 L<br>—<br>— | ₹15.48 L / ₹20.46 L<br>—<br>— | ₹14.53 L / ₹18.75 L<br>—<br>— |
| Bootstrap: Second seed (20261113) | —<br>₹18.43 L / ₹33.03 L<br>— | —<br>₹17.83 L / ₹24.75 L<br>— | —<br>₹23.95 L / ₹34.54 L<br>— | —<br>₹20.88 L / ₹29.43 L<br>— |
| Bootstrap: 12-month blocks | —<br>₹17.54 L / ₹31.77 L<br>— | —<br>₹17.37 L / ₹24.37 L<br>— | —<br>₹24.57 L / ₹34.86 L<br>— | —<br>₹20.90 L / ₹29.39 L<br>— |
| Bootstrap: 36-month blocks | —<br>₹20.16 L / ₹34.55 L<br>— | —<br>₹18.10 L / ₹25.24 L<br>— | —<br>₹24.01 L / ₹34.93 L<br>— | —<br>₹21.07 L / ₹29.68 L<br>— |
Table A2 · Seed stability
| Run | Case | P20: base seed / second seed | change | P50: base seed / second seed | change |
|---|---|---|---|---|---|
| Monte Carlo | 100% Nifty 50 | ₹13.96 L / ₹14.05 L | +0.69% | ₹21.12 L / ₹21.17 L | +0.22% |
| Monte Carlo | 60/40 Nifty/gilt | ₹13.21 L / ₹13.26 L | +0.42% | ₹17.11 L / ₹17.13 L | +0.14% |
| Monte Carlo | 60/40 Nifty/gold | ₹15.33 L / ₹15.48 L | +0.99% | ₹20.47 L / ₹20.46 L | −0.03% |
| Monte Carlo | 60/20/20 | ₹14.38 L / ₹14.53 L | +1.02% | ₹18.81 L / ₹18.75 L | −0.29% |
| Bootstrap | 100% Nifty 50 | ₹19.13 L / ₹18.43 L | −3.65% | ₹33.10 L / ₹33.03 L | −0.19% |
| Bootstrap | 60/40 Nifty/gilt | ₹18.30 L / ₹17.83 L | −2.59% | ₹24.82 L / ₹24.75 L | −0.29% |
| Bootstrap | 60/40 Nifty/gold | ₹24.79 L / ₹23.95 L | −3.38% | ₹34.73 L / ₹34.54 L | −0.55% |
| Bootstrap | 60/20/20 | ₹21.53 L / ₹20.88 L | −2.98% | ₹29.30 L / ₹29.43 L | +0.45% |
Table A3 · Sample size
| Years | Overlapping windows | Independent windows (326 monthly returns ÷ months per window) |
|---|---|---|
| 10 | 207 | 2.72 |
| 15 | 147 | 1.81 |
| 20 | 87 | 1.36 |
| 25 | 27 | 1.09 |
Table A4 · The calculator links (stand-ins; no tax, no third sleeve)
| Link | What it is | Access | The page shows |
|---|---|---|---|
| c1 | Case 1: ₹10,000 a month into a Nifty 50 index fund for 20 years, one return 11.78% (12% less the 0.20% TER), inflation 7% | free | After 20 years you will have ₹89.58 L — ₹23.15 L in today’s money. |
| c1-mc | Case 1 with Simulated markets: volatility of the one return 17% | Pro (Simulated markets), sign in | After 20 years you will have ₹89.58 L — ₹23.15 L in today’s money. In 2,000 simulated markets, 9 in 10 end with at least ₹11.88 L, half with at least ₹23.19 L, and 1 in 10 with ₹47.59 L or more (in today’s money). |
| c2-mc | Case 2: Equity and debt at 60% equity, equity 11.78%, debt 7.04% (the gilt fund: 7.25% less 0.20%), volatilities 17% and 3.5% | Pro (Equity and debt, Simulated markets), sign in | After 20 years you will have ₹71.41 L — ₹18.45 L in today’s money. In 2,000 simulated markets, 9 in 10 end with at least ₹12.83 L, half with at least ₹19.26 L, and 1 in 10 with ₹29.72 L or more (in today’s money). |
| c3-mc | Case 3 stand-in: Equity and debt at 60% equity with gold's return in the debt field (9.35% = 10% less the 0.59% TER) and gold's volatility (14.5%) in the debt volatility field. The page calls it debt; here it carries gold's return. Its simulated markets treat the two as uncorrelated. | Pro (Equity and debt, Simulated markets), sign in | After 20 years you will have ₹79.71 L — ₹20.60 L in today’s money. In 2,000 simulated markets, 9 in 10 end with at least ₹14.07 L, half with at least ₹22.25 L, and 1 in 10 with ₹36.34 L or more (in today’s money). |
| c3-hist | Case 3 stand-in at gold's historical return: 13.57% in the debt field (14.25%, Jun 1999 to Aug 2026, less the 0.59% TER), volatility 14.6% | Pro (Equity and debt, Simulated markets), sign in | After 20 years you will have ₹97.68 L — ₹25.24 L in today’s money. In 2,000 simulated markets, 9 in 10 end with at least ₹17.10 L, half with at least ₹27.31 L, and 1 in 10 with ₹45.28 L or more (in today’s money). |
| c1-raise | Case 1 with a Yearly raise of 8% from year 2, Simulated markets on | Pro (Yearly raise, Simulated markets), sign in | After 20 years you will have ₹1.56 Cr — ₹40.22 L in today’s money. In 2,000 simulated markets, 9 in 10 end with at least ₹22.76 L, half with at least ₹40.78 L, and 1 in 10 with ₹76.77 L or more (in today’s money). |
*
Every number in this paper rests on assumptions, not forecasts. Tax rules are FY2026-27 under the new regime and may change. None of this constitutes financial, tax, or investment advice. finfire.org operates the calculator and offers paid tiers.
Reproducibility. urls.csv lists every calculator link, the plan it opens and the answer it gives. Each link was re-opened in a fresh copy of the real page: 27 values, 0 failures. urls.csv