Tax regime and Asset Allocation dynamics: The inflection point and the expensive part
Every investor tries to optimise the tax outgo and maximise the investment return. In this paper we demystify this tussle between new/old tax regimes and the influenced investment habits. We learn that choosing a specific tax routine is not that big a deal. Rather, maintaining the optimal asset allocation habit is what makes you a winner.
In short
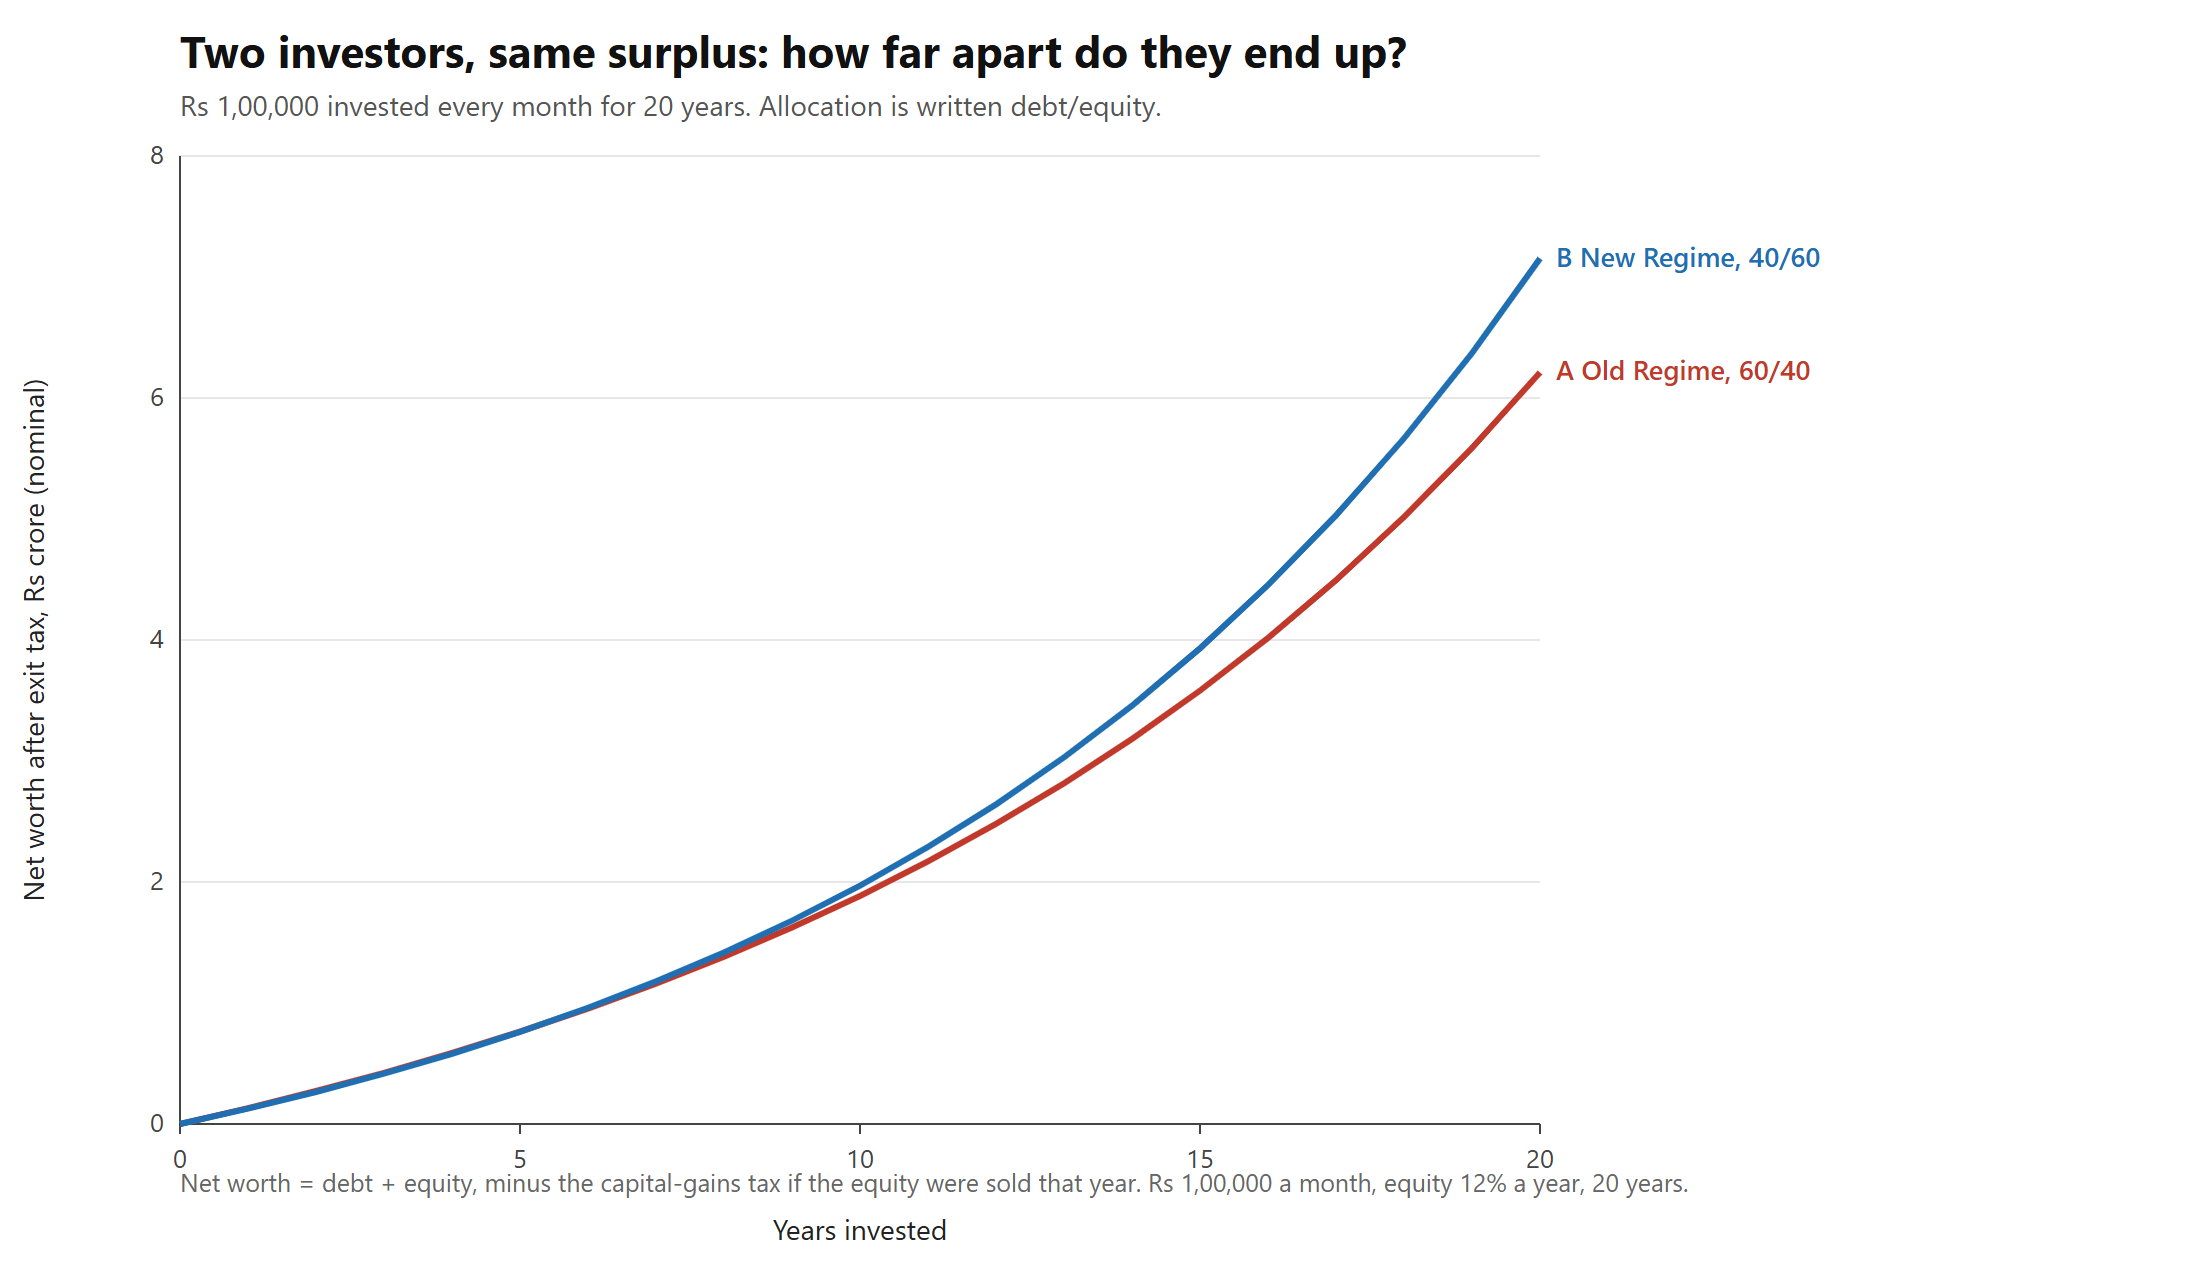
Two investors put away the same Rs 1,00,000 every month for 20 years. One follows the Old Regime playbook. The other follows the New Regime playbook. After 20 years, the New Regime investor is ahead by Rs 94 lakh (Rs 7.15 crore against Rs 6.21 crore).
Intuitively, most people would say that tax regime caused that gap. Turns out, it did not. In this paper, we performed experiments and dig deeper into the gap and it's causes. Here is what we found:
- Tax on debt assets costs a lot. Paying 30% tax every year on interest is worth Rs 54 lakh of the gap.
- Holding more equity assets helped even more. The shift from 40% equity to 60% equity is worth Rs 70 lakh. This is the stock market effect, not a taxation effect.
- The Old Regime's deductions also help. Giving them boot of Rs 30 lakh, as compared to New Regime investor.
- There is NO best path The Old Regime investor can also win, by following the New Regime investor's habits: Rs 7.48 crore.
So choosing the regime is not the expensive or critical part. The investment asset allocation habit it nudges you into makes a real difference. The story is not clean. let us see where it breaks.
1. The question
Most people compare tax regimes by one number: the tax bill this year. That is a myopic view point. May be a partial one too.
Choosing a tax regime influences your investment behaviour. It nudges you. The Old Regime rewards you for locking money into things like PPF, EPF and five-year FDs. Some of those pay tax-free interest. This nudge pulls you towards debt allocation. Though, some investments like Fixed deposits pay non tax-free interest.
With this, someone choosing the Old tax regime will tend to allocate more towards debt investments.
So the real cost of choosing a regime has two parts to it:
- The tax you pay each year.
- What your money does because of where the regime tells you to put it.
In this paper, we dig deeper into the second part.
2. The two investors
Both invest Rs 1,00,000 a month for 20 years. Both start from zero. Taxable debt earns 8% a year. Equity earns 12% a year. The split is written as debt/equity.
| Path A: Old Regime Maximizer | Path B: New Regime Optimizer | |
|---|---|---|
| Split | 60/40 | 40/60 |
| Debt | Taxed every year at 30% (so 5.6% net) | Tax-free, 7.5% |
| Deductions | Claims 80C and 80D, reinvests the tax saved | None |
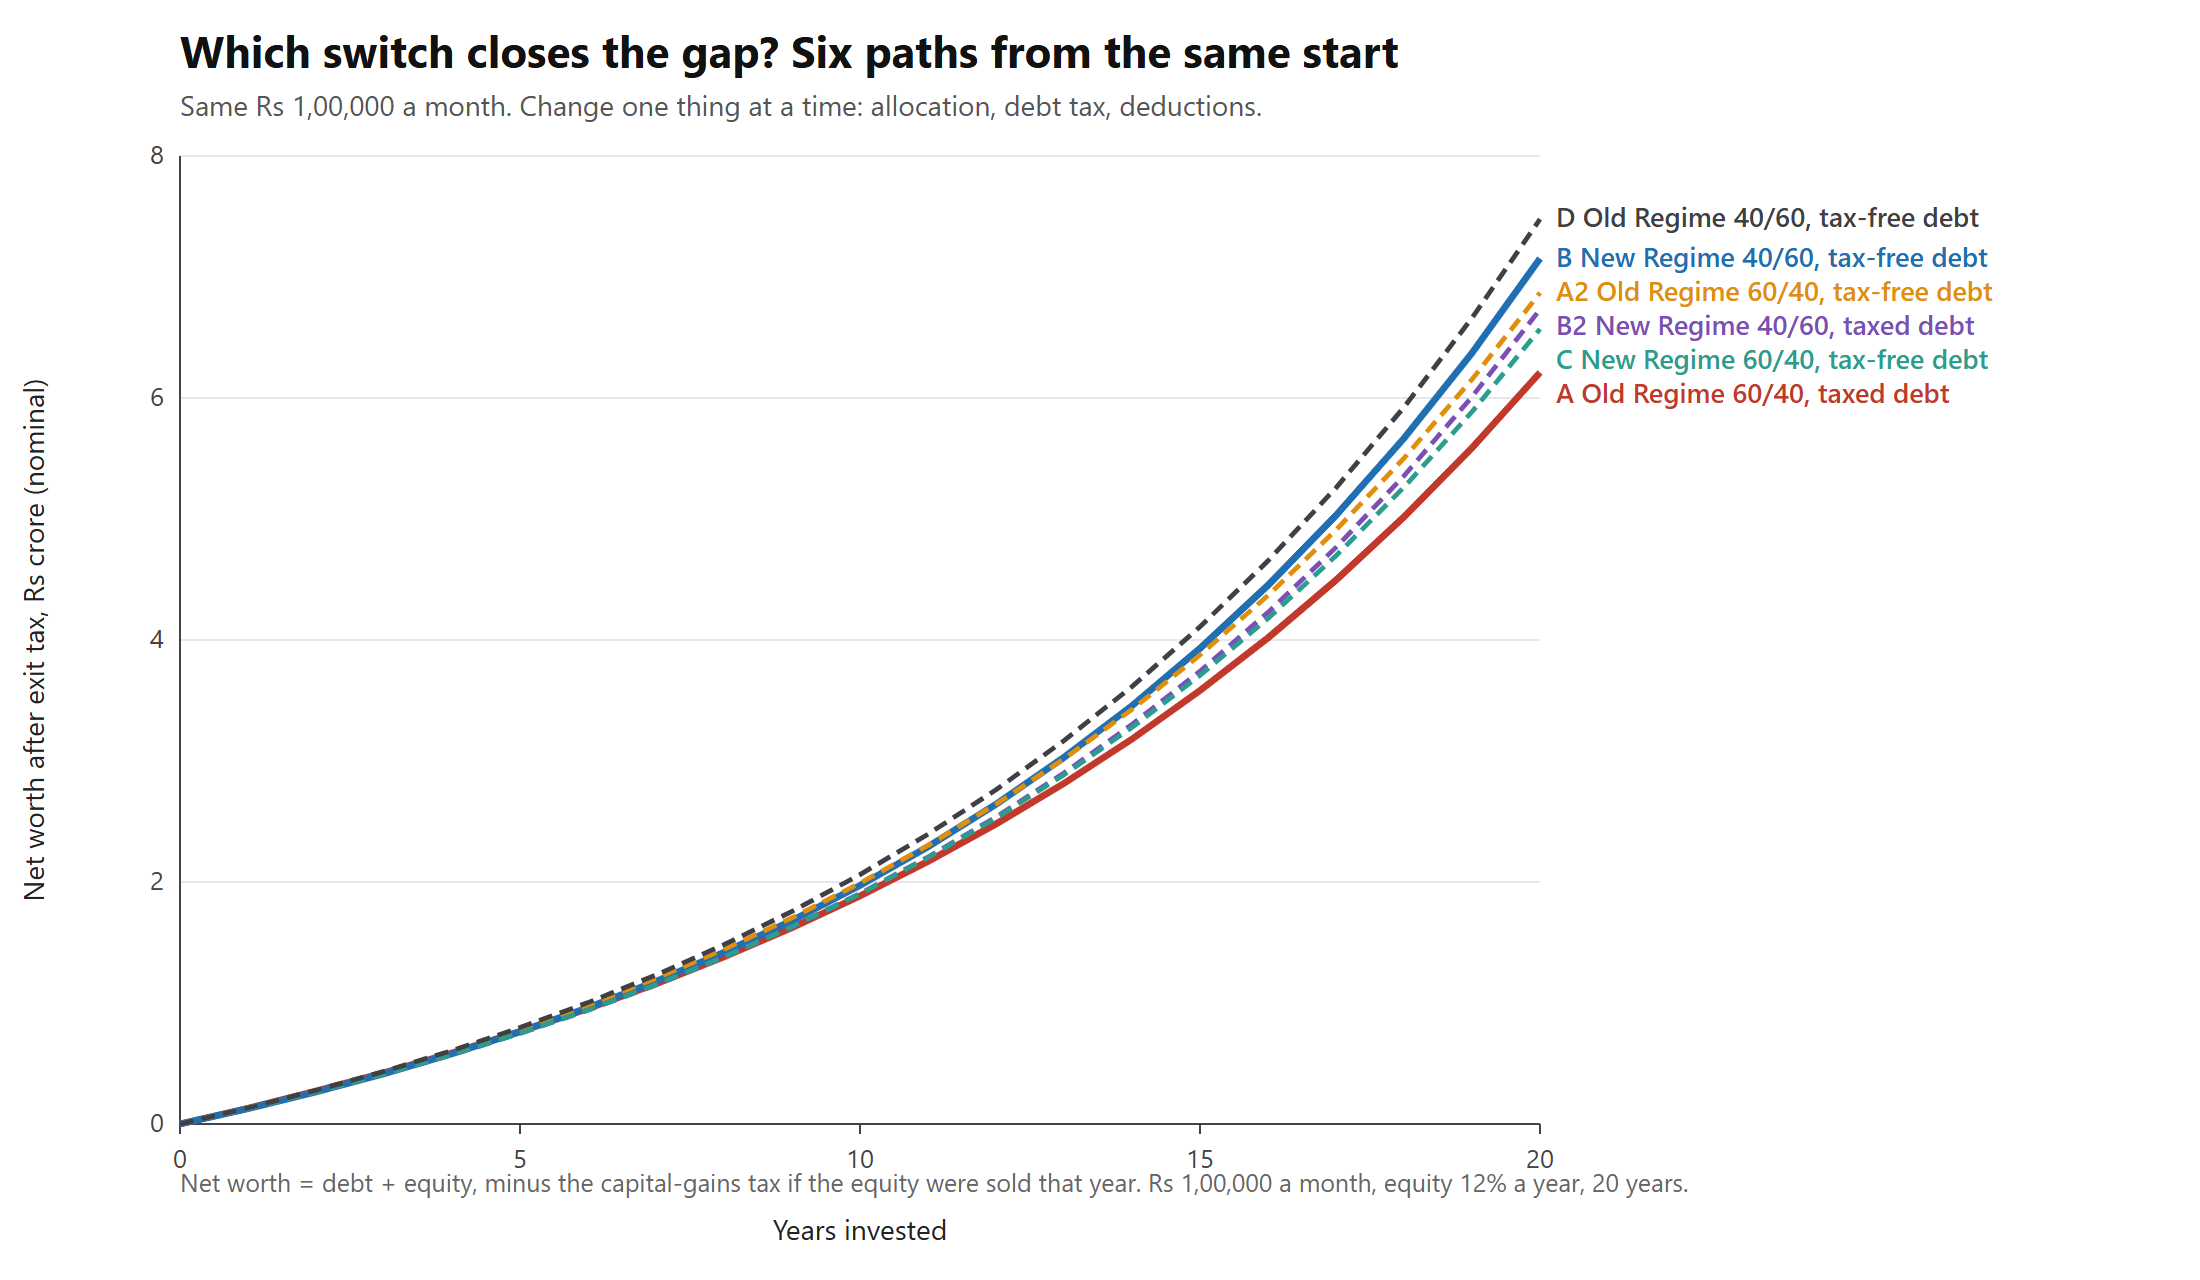
To find out which habit matters, we ran four paths. With "one change at a time":
| Path | Regime | Split | Debt | Deductions |
|---|---|---|---|---|
| A2: Smart Old Regime | Old | 60/40 | Tax-free | Claimed |
| B2: New Regime, taxed debt | New | 40/60 | Taxed | None |
| C: New Regime, Path A's habits | New | 60/40 | Tax-free | None |
| D: Old Regime, Path B's habits | Old | 40/60 | Tax-free | Claimed |
A2 is the fair comparison. It is an Old Regime investor who is smart enough to use tax-free debt.
3. Assumptions and method
Rs 1,00,000 is invested every month for 20 years, starting from zero. Equity earns 12% a year and is taxed only when sold: 12.5% plus 4% cess on gains above Rs 1.25 lakh, once, at year 20. Taxable debt earns 8%, taxed each year at 30%, so 5.6% net; tax-free debt earns 7.5%. Old Regime deductions (80C Rs 1.5 lakh, 80D Rs 25,000) save Rs 54,600 a year, reinvested monthly in the same mix. Allocation is written debt/equity and is the split of new money; nothing is rebalanced. Inflation is 6%.
Not modelled: non-linear returns (market ups and downs), other deductions, standard deduction, lock-ins, exit loads, surcharge, income changes, and your own tax slab.
Net worth in this paper means what you would keep if you sold everything at year 20 and paid the capital gains tax. "Real" means in today's money, after 6% a year inflation.
4. Where each investor ends up
| Path | Net worth at year 20 | Real (today's money) |
|---|---|---|
| D: Old Regime, 40/60, tax-free debt | Rs 7.48 crore | Rs 2.33 crore |
| B: New Regime Optimizer | Rs 7.15 crore | Rs 2.23 crore |
| A2: Smart Old Regime | Rs 6.87 crore | Rs 2.14 crore |
| B2: New Regime, taxed debt | Rs 6.73 crore | Rs 2.10 crore |
| C: New Regime, 60/40 | Rs 6.57 crore | Rs 2.05 crore |
| A: Old Regime Maximizer | Rs 6.21 crore | Rs 1.94 crore |
Each investor put in Rs 2.4 crore of their own money. Path A earned about 8.70% a year on it. Path B earned about 9.90%.
5. Where the Rs 94 lakh gap comes from
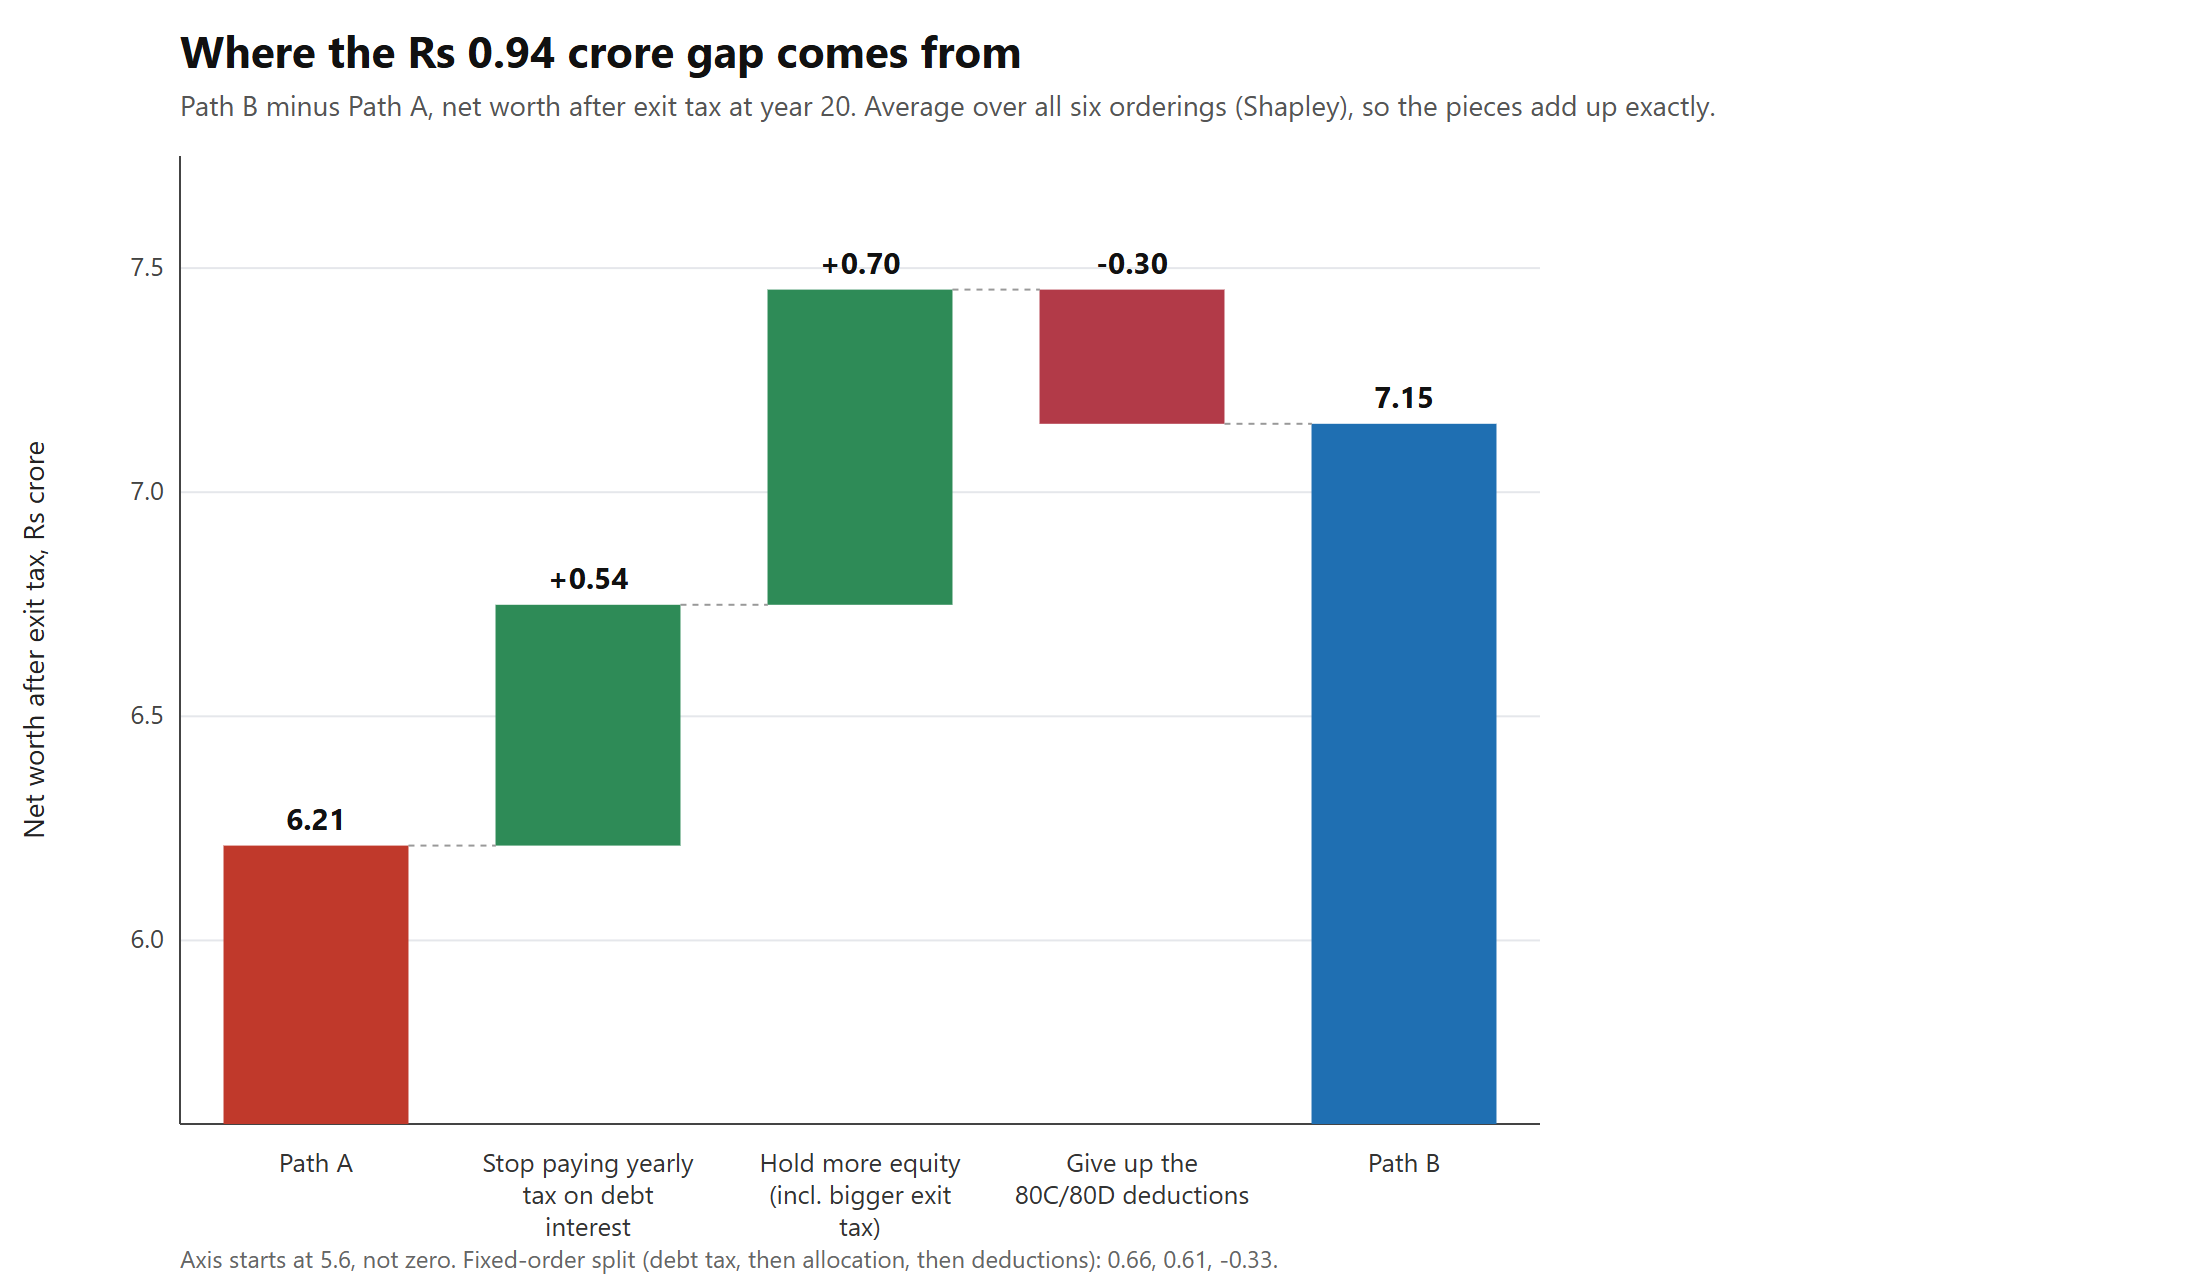
The three causes overlap. So the split depends on the order you count them. We counted in every possible order and took the average. This is called a Shapley split. It makes the three pieces add up exactly to the gap.
| Piece | Average over all orders | One fixed order* |
|---|---|---|
| Stop paying yearly tax on debt interest | +Rs 53.7 lakh | +Rs 65.8 lakh |
| Hold more equity (after the bigger exit tax it creates) | +Rs 70.3 lakh | +Rs 60.8 lakh |
| Give up the 80C/80D deductions | −Rs 29.9 lakh | −Rs 32.5 lakh |
| Total gap (B minus A) | Rs 94.1 lakh | Rs 94.1 lakh |
*Debt tax first, then allocation, then deductions.
6. The yearly drip against one bill at the end
Path A pays tax on its debt interest every year. Path B pays tax on its equity once, at the end.
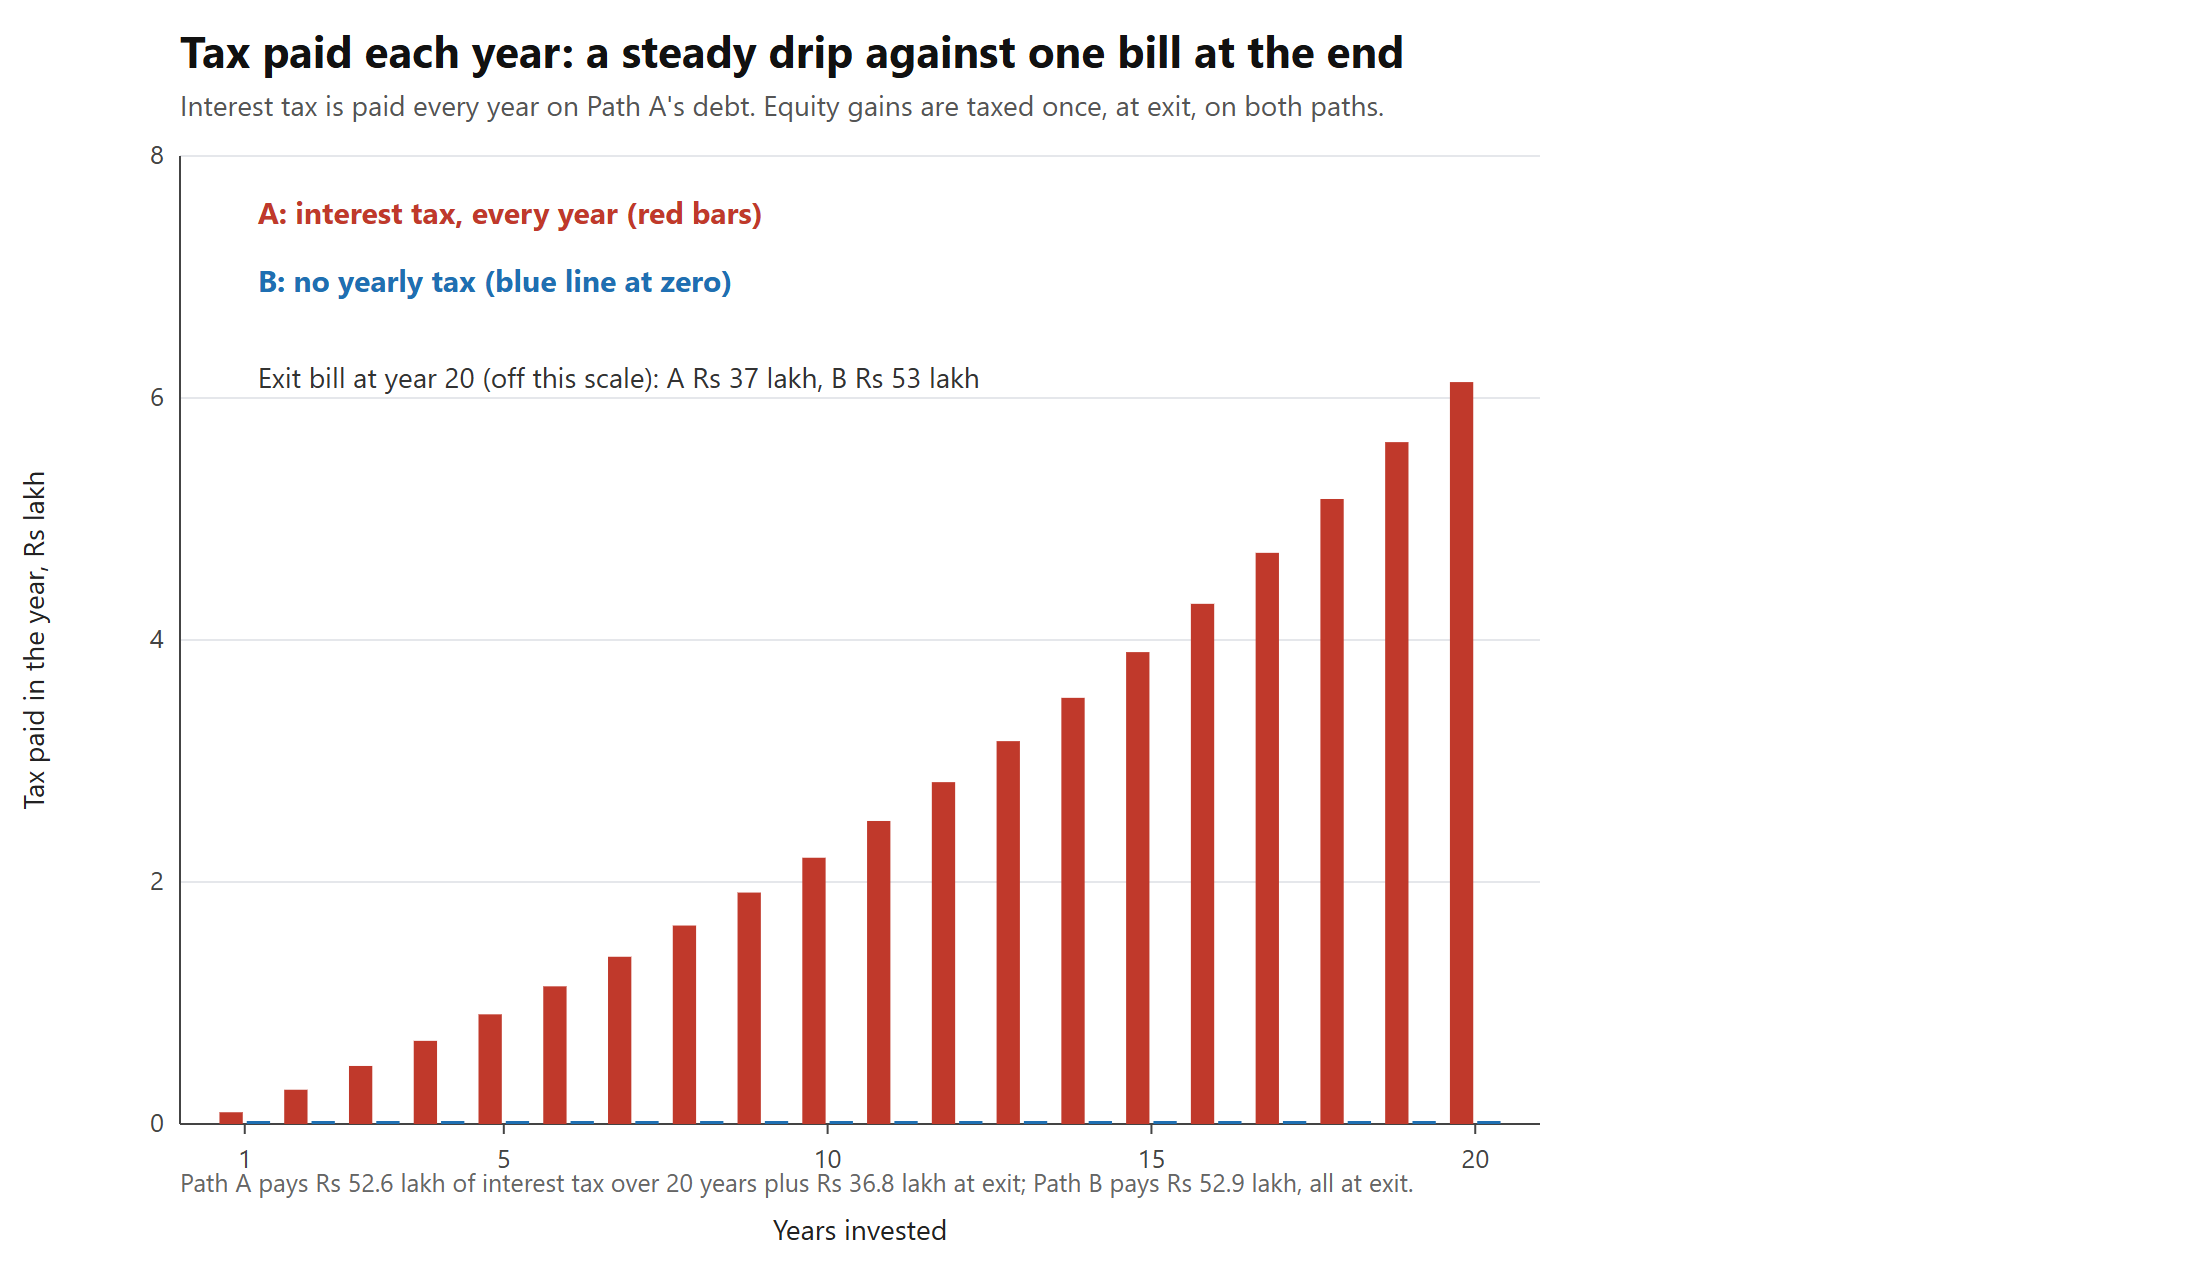
- Path A pays Rs 52.6 lakh of interest tax over 20 years, plus Rs 36.8 lakh at exit. Total: Rs 89.4 lakh.
- Path B pays Rs 52.9 lakh, all at exit.
Money you pay early cannot compound. Money you pay late can. That is the whole advantage of deferring tax.
7. Does the hypothesis hold?
We started with this claim: the gap comes mainly from tax-inefficient debt and a lower equity share, not from the regime label.
Verdict: supported, but not cleanly.
Support
- Taxed debt costs real money. Keep everything else the same and make Path A's debt tax-free: net worth rises by Rs 65.8 lakh (A to A2). Make Path B's debt taxed: it falls by Rs 42.0 lakh (B to B2).
- The Old Regime is not the expensive part. Its deductions are worth about Rs 30 lakh. The best path, D, is an Old Regime path.
What weakens it
- Allocation is the biggest piece, and it is not a tax effect. With tax-free debt on both sides, 40/60 still beats 60/40 by Rs 58 lakh at 12% equity (B against C). That is a bet that equity returns 12%.
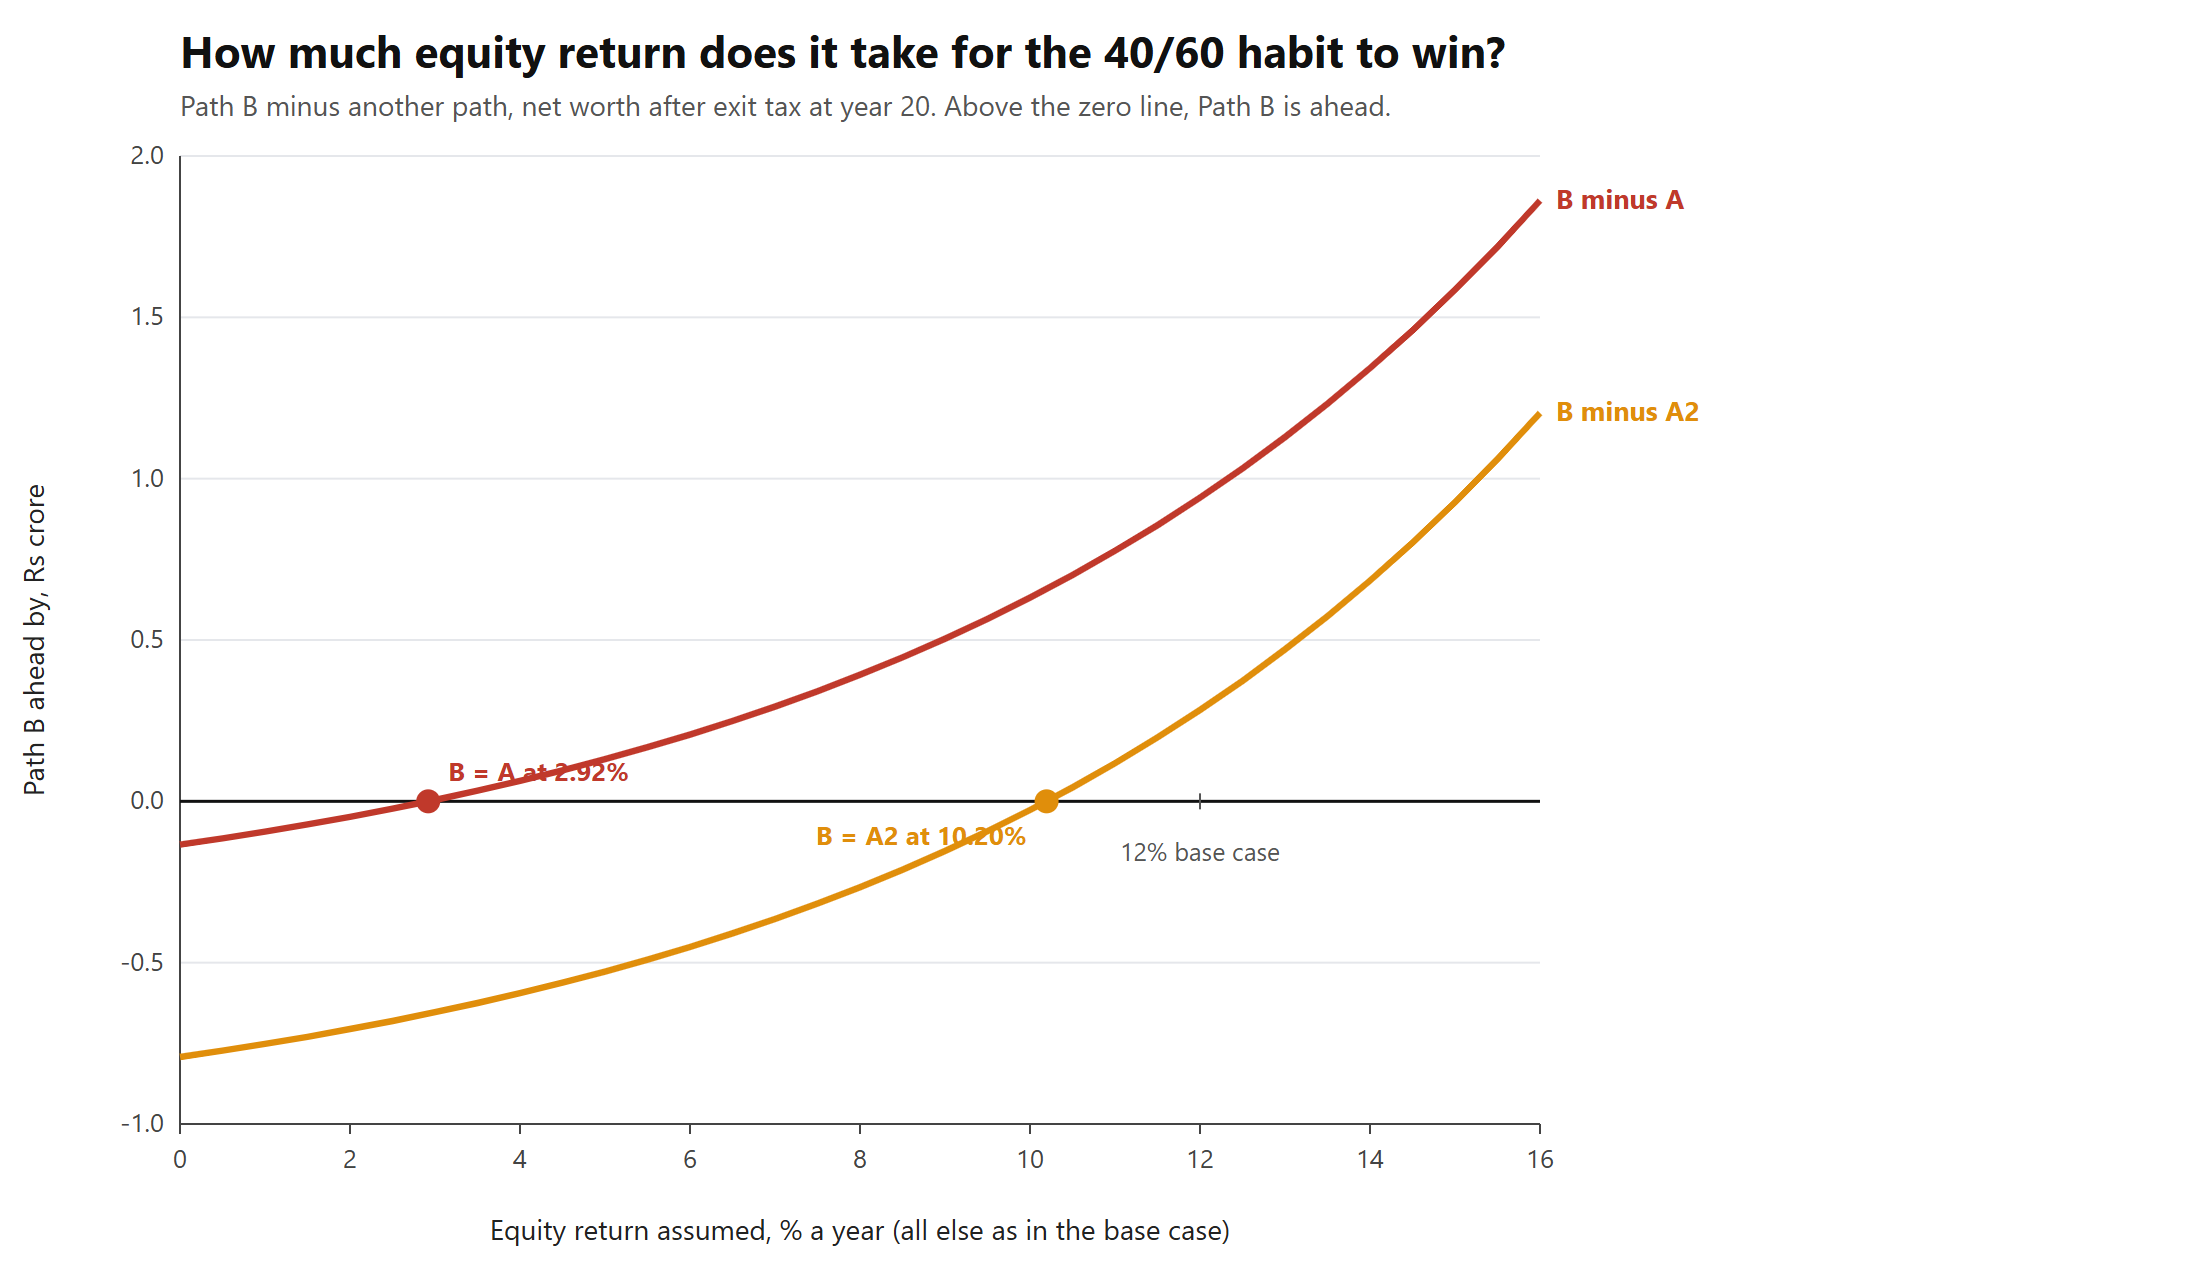
- The fair comparison is closer. B leads the smart Old Regime (A2) by only Rs 28 lakh, or 4.1%. At 10% equity or lower, A2 wins.
- Risk is not in these numbers. Path B holds more equity. It ends with about 72% of its money in equity, against 58% for Path A. It is the riskier path.
8. The inflection points
An inflection point is where the winner changes. We searched for each one.
| Question | Answer |
|---|---|
| Equity return at which B equals A | 2.92% a year |
| Equity return at which B equals A2 (smart Old Regime) | 10.20% a year |
| How long must you invest for B to stay ahead of A? | B is ahead from year 6. A leads in years 1 to 5 |
| Does a lower tax rate change the winner? | No. B leads A at 20% (Rs 77.7 lakh), 25% (Rs 86.1 lakh) and 30% (Rs 94.1 lakh) |
| Yield taxed debt would need for A to equal B | 11.70% before tax (8.19% after tax) |
| Yearly tax saving A would need to equal B | Rs 2.45 lakh a year. The base case is Rs 54,600, and 80C plus 80D cannot give that much |
9. What if you switch halfway?
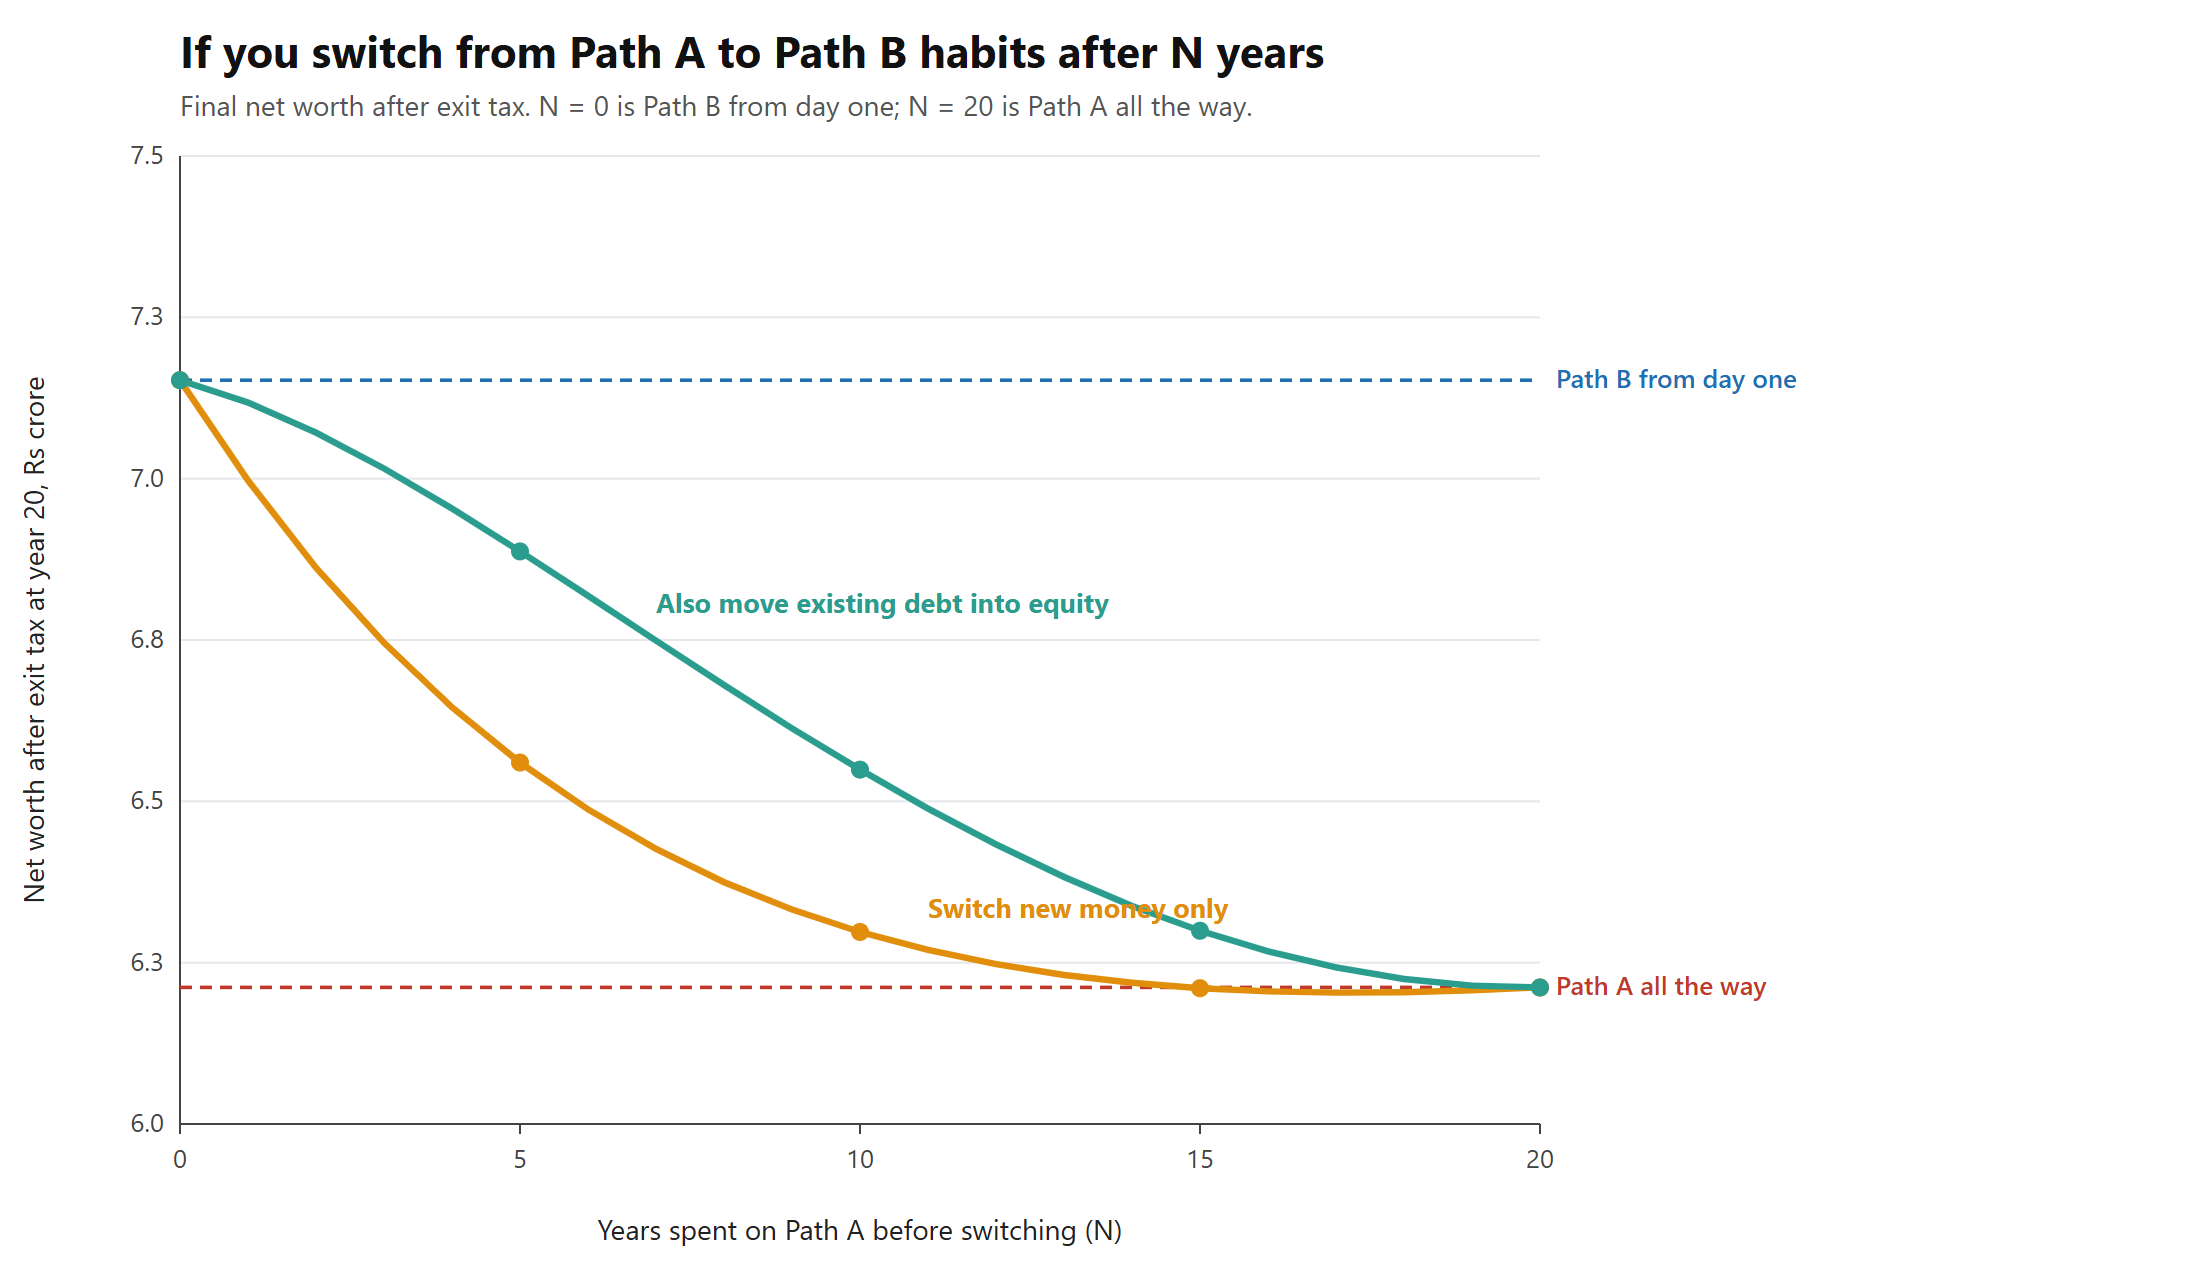
You can change habits mid-way. We tested two ways. In "new money only", you keep the old pile as it is and send new money the Path B way. In "rebalanced", you also sell taxed debt and move it into equity, up to Path B's equity share.
| Years on Path A before switching | New money only | Gain over staying in A | Also move old debt | Gain over staying in A |
|---|---|---|---|---|
| 0 (Path B from day one) | Rs 7.15 crore | +Rs 94.1 lakh | Rs 7.15 crore | +Rs 94.1 lakh |
| 5 | Rs 6.56 crore | +Rs 34.9 lakh | Rs 6.89 crore | +Rs 67.6 lakh |
| 10 | Rs 6.30 crore | +Rs 8.6 lakh | Rs 6.55 crore | +Rs 33.8 lakh |
| 15 | Rs 6.21 crore | −Rs 11,622 | Rs 6.30 crore | +Rs 8.8 lakh |
| 20 (Path A all the way) | Rs 6.21 crore | 0 | Rs 6.21 crore | 0 |
10. What if markets are bumpy?
Real markets do not give 12% every year. We ran lower and higher returns. We also ran two bad-luck cases. In each, five years return only 2%, and the other fifteen years return 15.55%, so the 20-year average is still 12%.
| Case | Path A | Path B | Path A2 | B minus A | B minus A2 |
|---|---|---|---|---|---|
| Equity 8% | Rs 4.95 crore | Rs 5.34 crore | Rs 5.61 crore | +Rs 39.2 lakh | −Rs 26.6 lakh |
| Equity 10% | Rs 5.50 crore | Rs 6.13 crore | Rs 6.16 crore | +Rs 63.1 lakh | −Rs 2.7 lakh |
| Equity 12% (base) | Rs 6.21 crore | Rs 7.15 crore | Rs 6.87 crore | +Rs 94.1 lakh | +Rs 28.3 lakh |
| Equity 14% | Rs 7.13 crore | Rs 8.48 crore | Rs 7.79 crore | +Rs 134.2 lakh | +Rs 68.4 lakh |
| Weak first 5 years | Rs 7.22 crore | Rs 8.60 crore | Rs 7.88 crore | +Rs 138.1 lakh | +Rs 72.3 lakh |
| Weak last 5 years | Rs 5.69 crore | Rs 6.41 crore | Rs 6.35 crore | +Rs 71.5 lakh | +Rs 5.7 lakh |
What to notice: Weak years at the start help everyone, because more money goes in just before the boom. Weak years at the end hurt Path B most. Its lead over A2 shrinks from Rs 28.3 lakh to Rs 5.7 lakh. That is almost a tie.
Other changes we tested left the story the same. Dropping the Rs 1.25 lakh exemption changed no gap. A 10% yearly step-up in what you invest widened the B minus A gap to Rs 1.77 crore. Counting cess on interest made it Rs 97.0 lakh. Counting a tax saving of Rs 60,900 instead of Rs 54,600 made it Rs 91.0 lakh. With 4% inflation instead of 6%, the real-terms gap is Rs 42.9 lakh, up from Rs 29.3 lakh.
11. What this study does not tell you
- Each path is a straight line. There is no volatility and no income change. Only the two simple bad-luck cases above test sequence risk.
- Path B holds more equity. A real crash would hurt it more.
- The allocation advantage is a bet on equity returns. It is not a tax effect.
- We did not model lock-ins, PPF limits, exit loads, surcharge, the standard deduction, or interest cess in the base case.
- The tax saving is Rs 54,600 a year from the stated components. An earlier brief said about Rs 60,900. We ran that as a test above.
12. Try this scenario yourself
These links load the calculator with the same inputs we used. You need a free account for the links to open your plan. Links marked Pro use Pro features.
Each path here is two runs: one for equity and one for debt. Open both and add the two "corpus" numbers. Then subtract the exit tax: 13% of the equity corpus minus the money you put in, after the first Rs 1,25,000 of gain.
- Path B, with your own surplus. Equity run: Open. Debt run: Open. Change "Monthly investing" in both runs. Put 60% of your own monthly surplus in the equity run and 40% in the debt run.
- Path A, with your own surplus. Equity run (40%): Open. Taxed debt run (60%): Open. These links include Rs 4,550 a month of reinvested tax saving. Replace it with your own.
- A lower equity return. Path B equity at 8%: Open. Path A equity at 8%: Open. The debt runs do not change. Step the return from 8% up to 12% and watch the gap open up. At about 2.9% the two paths end level. Against the smart Old Regime (A2), the crossover is about 10.2%.
- Switch at year 10 (Pro). Path A for 10 years, then Path B habits with new money only. Equity run: Open. Taxed debt run, which stops after year 10: Open. Tax-free debt run, which starts in year 11: Open. Change "Stop investing after" and the schedule row (year 11) to switch at year 5 or 15. Compare your totals with the table in section 9.
- See the debt tax cost on one chart (Compare, Pro). This isolates one habit: the same Rs 62,730 a month, once taxed at 30% and once tax-free.
- Open the tax-free debt run: Open. Open "Saved plans (Pro)", type the name Tax-free debt and press Save.
- Open the taxed debt run: Open. Under "Compare (Pro)", press "Pin this plan (create a baseline plan to compare)".
- Pick Tax-free debt in the Saved plans list and press Open.
- The chart draws the taxed debt as a dashed line (pinned) and the tax-free debt as the solid line. At year 20 the corpus is about Rs 2.73 crore against Rs 3.39 crore. That is the Rs 65.8 lakh from section 7.
- See the extra equity on one chart (Compare, Pro). Do the same with the two equity runs: Path A's 40% (Open) pinned against Path B's 60% (Open). At year 20 the corpus is about Rs 3.85 crore against Rs 5.52 crore. Now change the return on both from 12% to 8% and watch the gap shrink.
What the links cannot do. Compare shows one run against another, so it shows one habit at a time. It does not add the equity and debt runs into one net worth, and it does not take the exit tax off. You do both by hand, as above. The calculator draws a straight line, so there are no market ups and downs.