Stress Testing India's Safe Withdrawal Rate (2026)
finfire.org Research, paper 4. Published 16 October 2026. Market data up to December 2025. Tax rules for FY2026-27, new regime. We plan to re-run this every year, so the next edition will be "India SWR 2027".
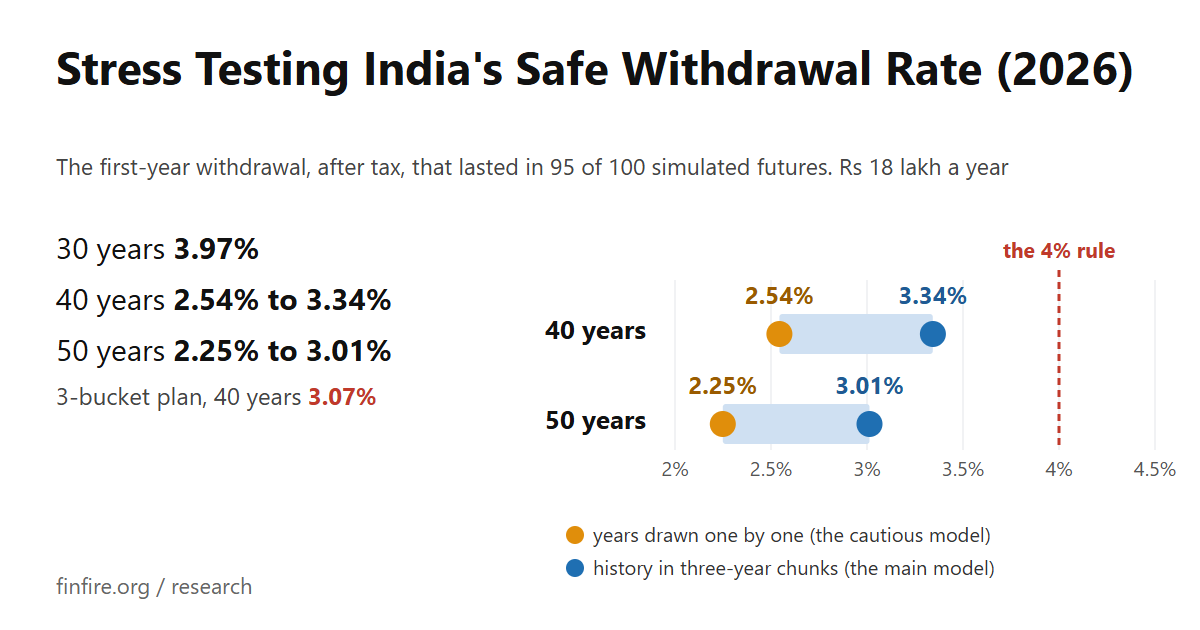
Key Findings - The short answer
- If your money has to last 40 years. Start by taking 2.54% to 3.34% of your savings in the first year, after tax, and raise that amount with inflation every year after. Do that, and your money lasted the full 40 years in 95 out of every 100 futures we simulated. Put another way, you need savings of 29.9 to 39.4 times one year's spending. If you're comfortable with 90 out of 100, the range goes up to 3.04% to 3.73% (26.8 to 32.9 times your yearly spending).
- If it has to last 50 years. For 95 out of 100, take 2.25% to 3.01% in the first year. At 3.01% that's savings of 33.2 times a year's spending; the multiple at 2.25% is 44.5. For 90 out of 100, it's 2.71% to 3.39% (29.5 to 36.9 times).
- Three buckets vs one simple portfolio. Many people expect the bucket plan to hold up better. In our tests, it didn't. When both started with the same amount in equity, the 3-bucket plan's safe rate for 40 years was 3.07%. The plain SWP's was 3.34%.
- The famous 4% rule. It works for about 30 years (3.97% at 95 out of 100). For 40 or 50 years, 4% is too much.
- Why we give a range rather than one number. We simulated the future in two different ways, and they disagree by up to 0.80 of a percentage point. The higher figure assumes that a bad year for Indian shares tends to be followed by a good one, which is how years 2000 to 2025 went. The lower figure assumes each year has nothing to do with the year before. Nobody knows which is closer to the truth, so we show you both.
Disclaimer: None of this constitutes financial, tax, or investment advice. Every figure relies on assumptions. We spell them out in this paper. finfire.org operates the calculator and offers paid tiers.
1. What we asked, and what our words mean
The question. Say you retire with a pile of savings and need it to last 40 or even 50 years. How much can you take out each year, after paying tax, without running dry? And there's a second question many people ask: does splitting your money into three buckets (cash, debt and growth) work better than keeping it all in one portfolio? By "one portfolio" we mean a single mix of equity and debt funds that you rebalance once a year and draw from every month. Most people know this as a systematic withdrawal plan, or SWP.
A few words come up again and again, so here is what we mean by them:
- Withdrawal rate. Your first year's spending as a percentage of the savings you have on the day you retire. Each year after that, you spend the same amount plus inflation. We always quote the rate against your starting savings, not whatever the pile happens to be worth later.
- After tax. The spending figure is money you actually get to spend. Any tax is paid on top of it, out of your savings.
- Funded. Every single month was paid in full. If a plan runs short in year 37, it counts as funded for 30 years but failed for 40.
- Horizon. How many years the money has to last: 30, 40, 45 or 50.
- Corpus multiple. Your savings divided by one year's spending. It's simply 1 divided by the withdrawal rate, so a 3.5% rate means you need 28.6 times your yearly spending.
When you see "95 in 100", it means that in 95 out of every 100 simulated futures, the money lasted the whole horizon.
2. Where the numbers come from, and where they fall short
We used four Indian data series, all measured over the same calendar years:
- Equity (shares): the Nifty 50 Total Returns Index. It counts dividends as well as price changes.
- Debt (bonds): the Nifty 10-year government bond index from 2011 onwards. Before 2011 there was no such index, so for 2000 to 2010 we had to estimate it from RBI bond yields. When we tested that estimate on years it hadn't been built from, it was off by about 1.1 percentage points a year, and by 1.7 at worst.
- Cash: the RBI call money rate up to 2010, then the Nifty 1D Rate Index.
- Inflation: the IMF's consumer price index for India, measured December to December. Before 2011 it tracks the price index for industrial workers; from 2011 it tracks the combined index.
Put together, that gives us 26 years, 2000 to 2025, with all four series side by side. This is not 40 or 50 years, and we want to be upfront about it. Every 40- or 50-year future in this study is built by reusing those same 26 years over and over. Two 26-year stretches that happen to look alike don't add up to a real 50-year history. And if something truly awful never happened in those years (a lost decade like Japan's, or 1970s-style inflation), it can't show up in our results either.
Why we used calendar years. India's tax year runs April to March, so you might expect us to use that. The trouble is that the only price index covering the whole period is a monthly one, which lets us measure inflation December to December, exactly as we measure returns. April-to-March figures would have meant either using a second price index or living with a three-month mismatch. Tax is still worked out by financial year in the simulation: each simulated year takes one calendar year of returns, so the returns and the tax year are three months apart.
The two halves of our history look like different markets. From 2000 to 2010, shares grew 15.6% a year, but with huge swings: a typical year was 40% above or below average (that's the standard deviation). From 2011 to 2025, they grew 11.5% a year with swings of 14.7%. So the answer depends a lot on how much you believe the 2000s. Take out 2008 alone and the 40-year safe rate jumps from 3.34% to 4.04%.
Over all 26 years, Indian shares beat inflation by 6.9% a year. That's in the same range as the long-run US figure. It's a big part of why our 30-year answer comes out close to the American "4% rule".
3. Assumptions and method
The household. We looked at three spending levels: ₹12 lakh, ₹18 lakh and ₹30 lakh a year after tax in the first year. We call them "lean", "regular" and "fat". Unless we say otherwise, the figures are for ₹18 lakh. Spending goes up with each year's inflation and is drawn at the start of every month. Savings needed = yearly spending ÷ withdrawal rate.
The savings come with a tax history. They aren't fresh cash sitting in a bank. They copy our example person: ₹1.5 crore invested over five years (80% in equity), then ₹1 lakh a month into equity for three more years. By retirement that's 156 separate purchases, 86% in equity, with 41% of the value being gains that haven't been taxed yet.
A path. One simulated 50-year future. Each year in it has an equity return, a debt return, a cash return and an inflation figure, and those four always come from the same real year so they stay realistic together.
How we built the futures.
- History in three-year chunks (our main model). We pick runs of three back-to-back years at random from 2000 to 2025 and string them together. This keeps the pattern of a bad year for shares often being followed by a good one.
- Independent years (our cautious model). A statistical model, fitted to the same 26 years, picks each year on its own. It has the same averages, the same size of swings and the same links between assets, but no memory of the year before.
- Lower returns. Equity's return above inflation cut by 2 percentage points every year. We also ran 1 and 3 points.
- Higher inflation. One percentage point added to inflation every year.
How many futures. 10,000 for each case, and 50,000 for the main cases. With 10,000 futures, a 90% success figure could be off by about 0.3 percentage points just by chance; with 50,000, by about 0.13. Every plan was run through exactly the same futures, so differences between plans are more precise than that.
The plans.
- Plain SWP: one portfolio of equity and debt funds. At the start of each year it's reset to its target equity share. Each month's withdrawal comes out of both, in proportion.
- 3-bucket plan: the finfire calculator's own rules. Bucket 1 is cash holding 1 year of spending, Bucket 2 is debt holding 4 years, and Bucket 3 is growth holding the rest. You spend from cash first. At each year end, debt tops up the cash bucket and growth tops up the debt bucket, whatever the market did.
Every plan starts with the same overall share in equity (40, 50, 60 or 70%). We also tried bucket variations: bigger buckets (2 and 5 years, 3 and 7 years), refilling only when a bucket runs low, not selling equity to refill after a down year, and a growth bucket that moves to all-equity over 10 years.
Tax. FY2026-27, new regime: the slabs, the section 87A rebate, surcharge and 4% cess. Long-term gains on equity are taxed at 12.5% above ₹1.25 lakh a year. Gains on debt and cash funds are taxed at your slab rate. Losses are carried forward for up to 8 years. Tax thresholds rise with inflation. We go further than the finfire calculator in three ways:
- Short-term gains. Equity sold within 12 months of buying it is taxed at 20%.
- Quarterly tax. We pay tax each quarter as advance tax; the calculator pays once a year. The only difference this makes is the tax on the gains you realise to pay the tax itself.
- Oldest units first (FIFO: first in, first out). We track every single purchase and always sell the oldest first. The calculator uses an average cost instead.
On top of that, moving our example portfolio into each plan's mix on day one means selling some holdings at a gain. That tax gets paid in year 1.
Fund costs. 0.2% a year on everything. We also tested 1%.
What we left out. Securities transaction tax, exit loads, brokerage, lock-in periods, moving abroad, and any tax change after FY2026-27. Strictly, debt units bought before 1 April 2023 fall under older tax rules; we taxed all debt gains at slab rates. That affects about ₹5.7 lakh of gains in the example portfolio.
How we checked our work. When set to the calculator's simpler rules, our engine matched the calculator to the rupee, year by year, on 60 random plans. A completely separate program, written in Python from scratch without reference to the engine's code, got the same answers on 23 test set-ups. Run on US data, our engine came within 3 percentage points of the published update to the well-known Trinity study. We also slipped bugs in on purpose (26 in the engine, 14 in the code that builds the futures, 10 in the calculator's link code), and every one was caught.
Random seed: 20261014. Run it again with the same inputs and you get exactly the same outputs.
4. What we found
4.1 Take out a little more, and your odds to last full horizon drop quickly
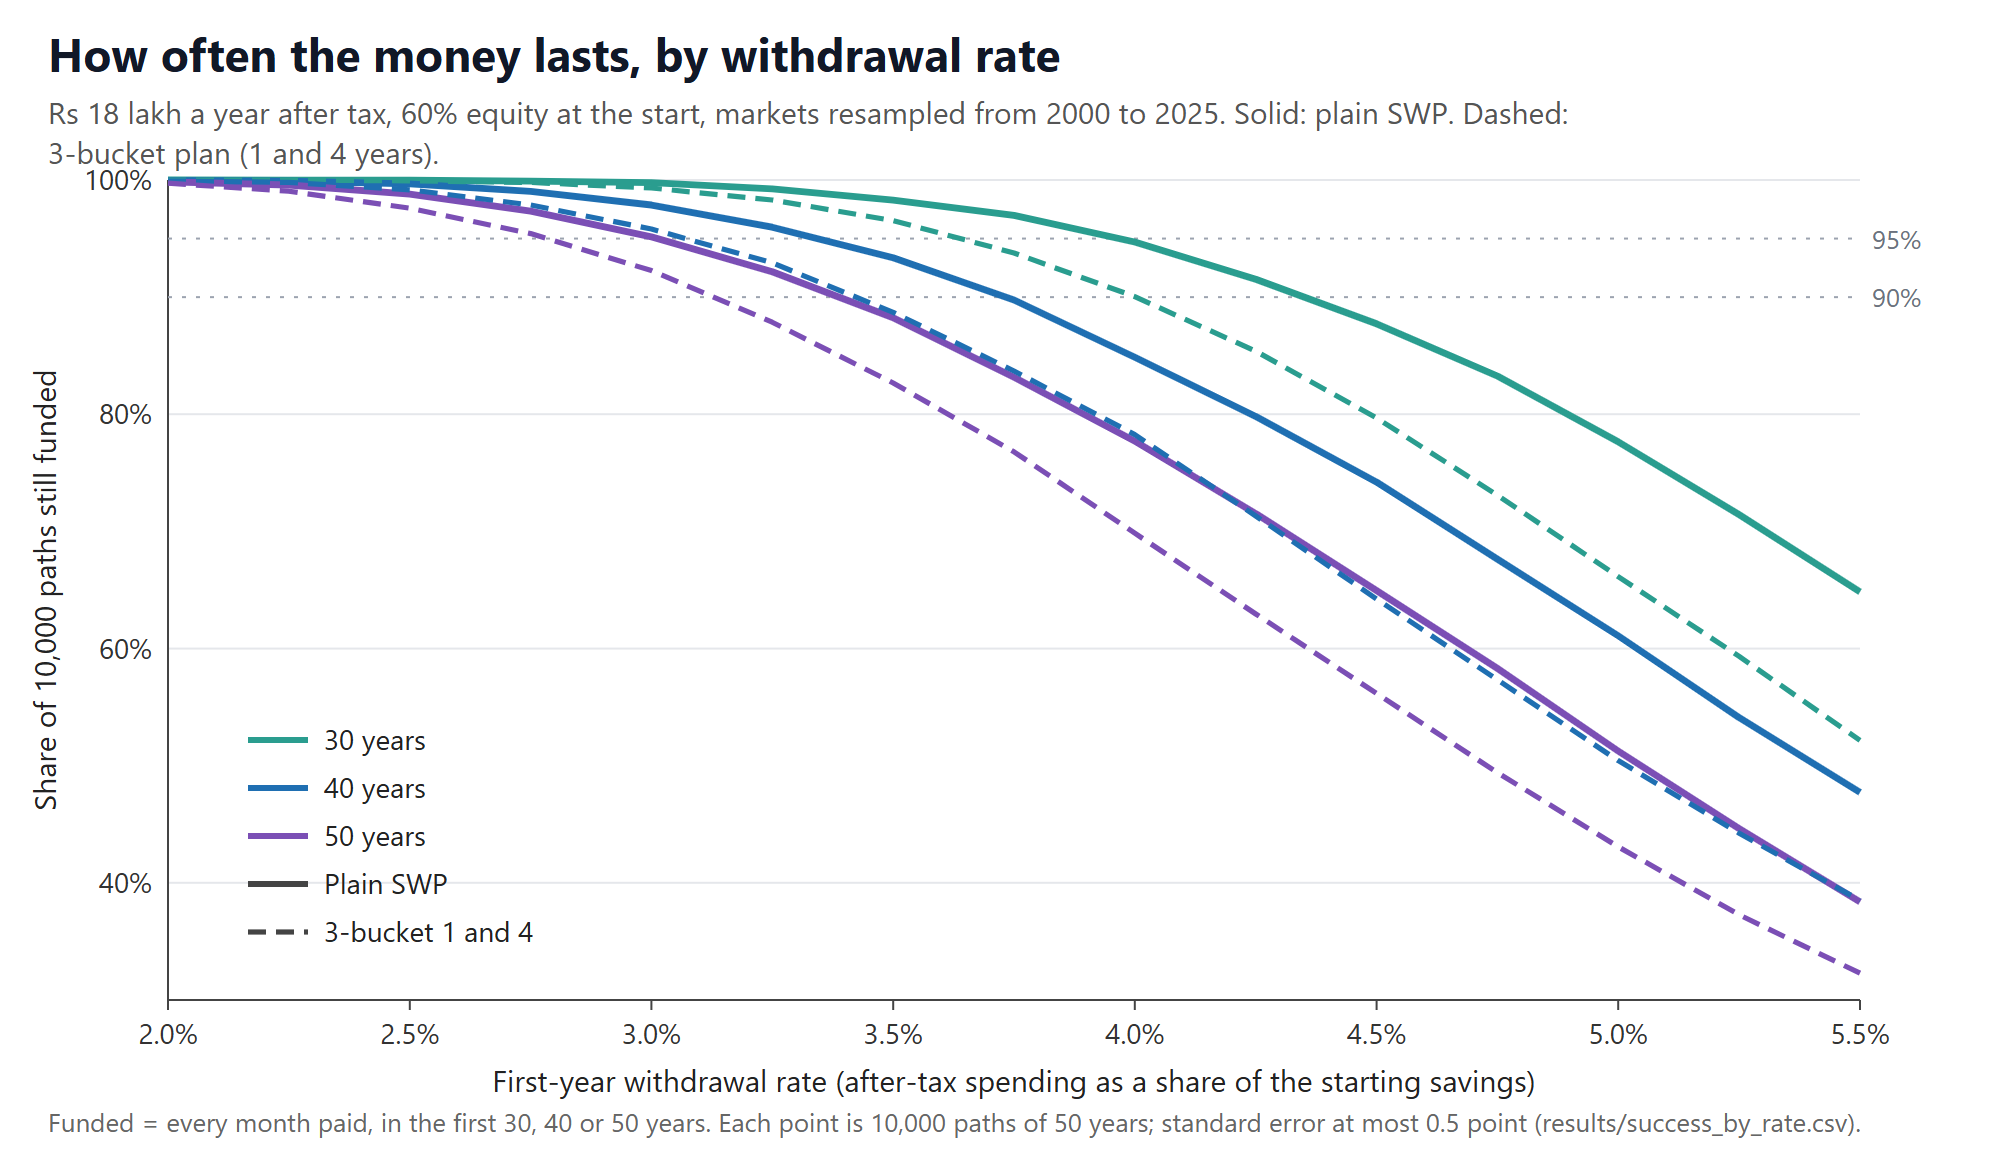
What to notice: every extra half a percent you take out costs you several points of safety, and the longer you need the money to last, the more it costs. Over 40 years, going from 3.5% to 4.0% drops the plain SWP from 93.4% to 85.1%.
4.2 The longer your retirement, the less you can take out
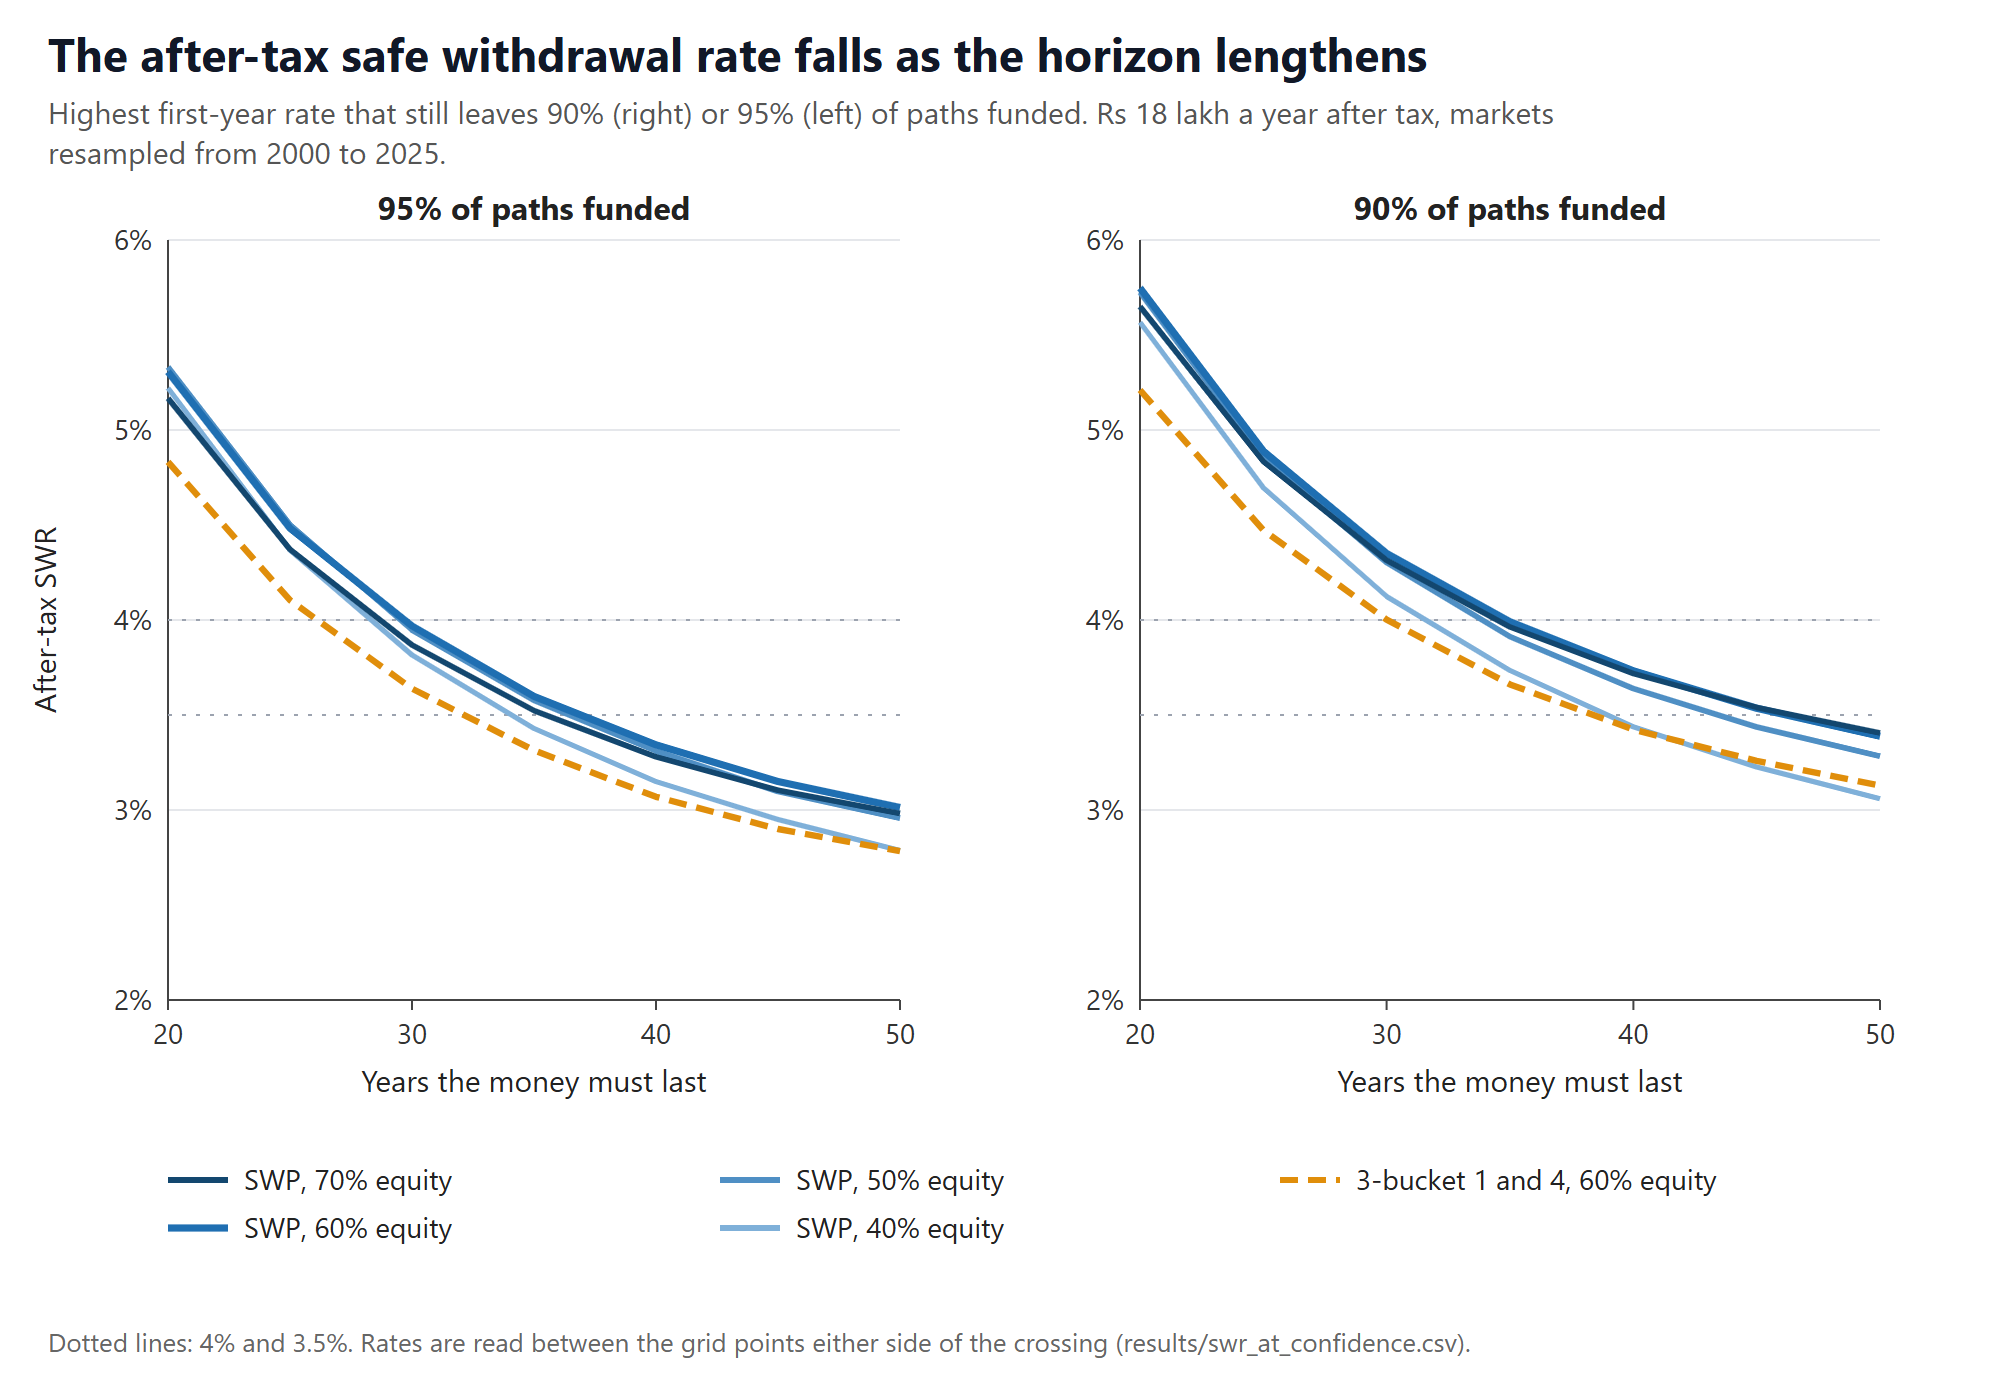
| Years | Rate for 95 in 100 | Times yearly spending | Savings needed for ₹18 lakh a year | Rate for 90 in 100 | Times yearly spending |
|---|---|---|---|---|---|
| 30 | 3.97% | 25.2 | ₹4.54 Cr | 4.35% | 23.0 |
| 40 | 3.34% | 29.9 | ₹5.38 Cr | 3.73% | 26.8 |
| 45 | 3.15% | 31.8 | ₹5.72 Cr | 3.54% | 28.3 |
| 50 | 3.01% | 33.2 | ₹5.97 Cr | 3.39% | 29.5 |
Main model. Plain SWP, 60% in equity.
Under the cautious model, the 40-year rate drops to 2.54% (95 in 100) and 3.04% (90 in 100).
What to notice: Safe withdrawal rates drop steeply when extending a retirement from 30 to 40 years, but level off and decrease much more slowly after 40 years.
4.3 How much in equity? Anywhere from 50% to 70% gives similar results
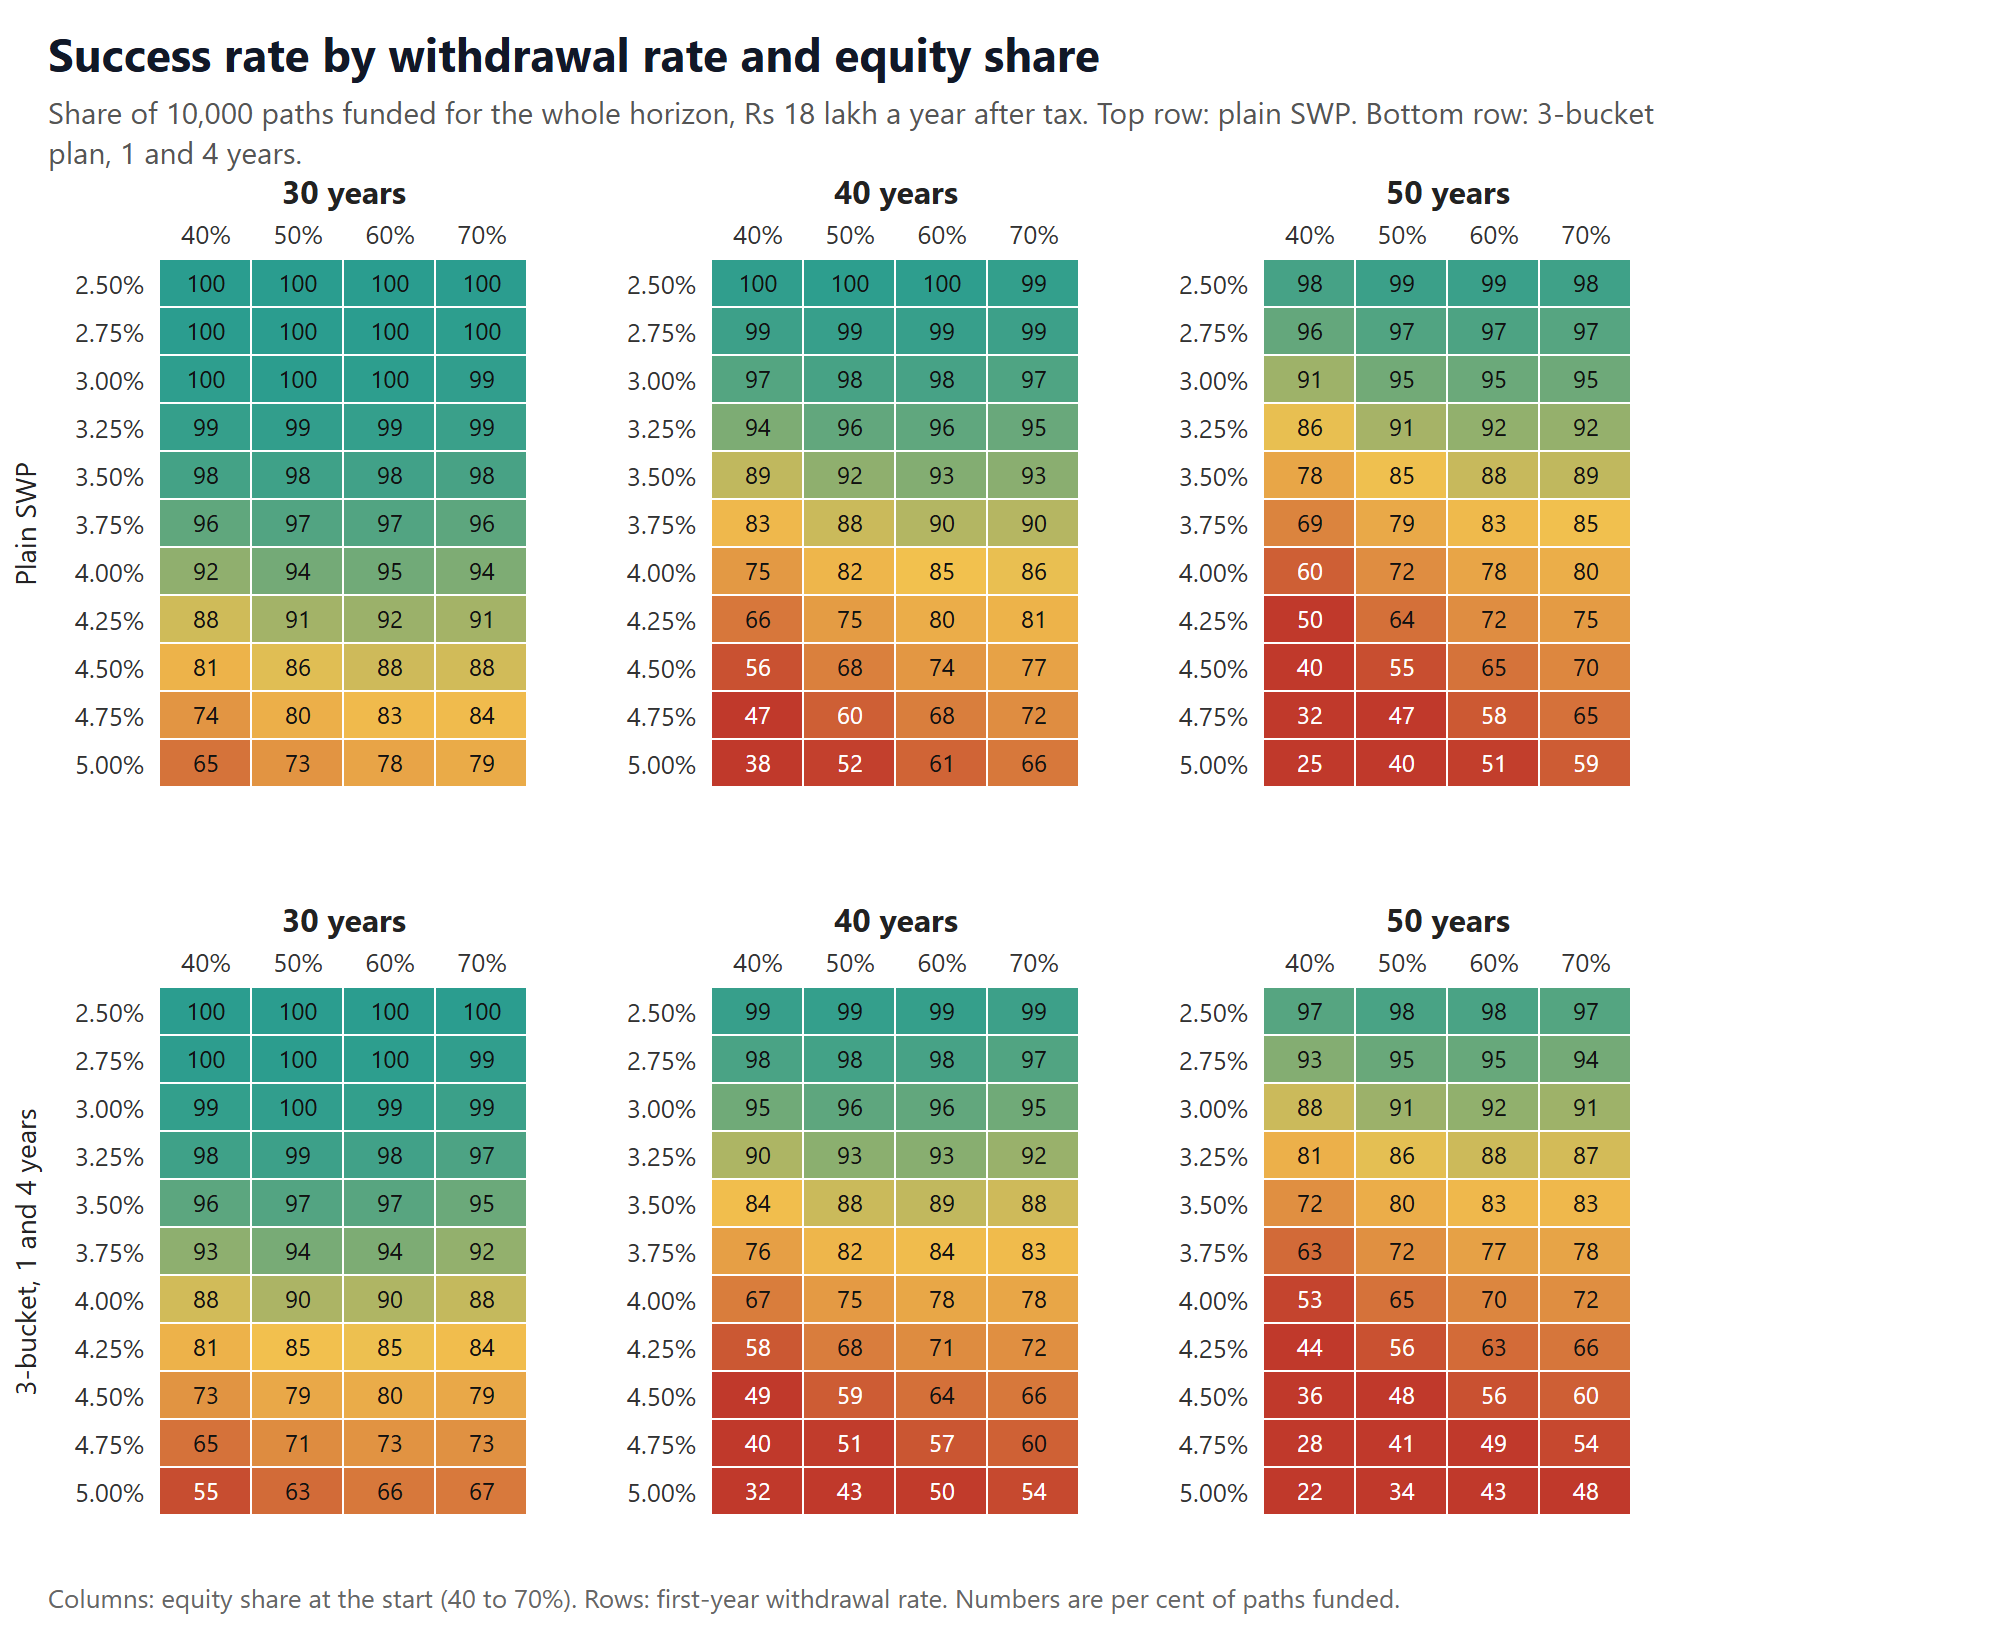
What to notice: 40% equity is clearly worse. Between 50% and 70% there's not much in it, though 60% came out just slightly ahead.
4.4 Bigger spenders need a slightly lower rate
| Years | ₹12 lakh | ₹18 lakh | ₹30 lakh |
|---|---|---|---|
| 40, 95 in 100 | 3.44% | 3.34% | 3.24% |
| 50, 95 in 100 | 3.11% | 3.01% | 2.90% |
What to notice: the more you withdraw, the higher the tax slab you land in, so a bigger share of each rupee goes to tax. That's why the ₹30 lakh household can only take 3.24% while the ₹12 lakh household can take 3.44%. Put simply, income tax brackets step up progressively. Because larger withdrawals push you into higher tax brackets, a bigger spender loses a larger share of money to taxes.
4.5 One simple portfolio vs three buckets
We compared the two approaches in every situation where the comparison meant something, always starting both with the same share in equity. In 3,983 out of 4,028 of those cases, the plain SWP lasted at least as often as the 3-bucket plan. In the other 45 cases, the buckets were ahead by no more than 0.8 of a percentage point. All 45 were under the cautious model (including its lower-returns version), at 20 to 30 years. By "meant something" we mean cases where the plain SWP succeeded somewhere between 1% and 99% of the time, rather than almost always or almost never.
| Plan (40 years, ₹18 lakh, 60% equity) | Rate for 95 in 100 | Compared with plain SWP |
|---|---|---|
| Plain SWP | 3.34% | — |
| 3-bucket, 1 and 4 years | 3.07% | −0.27 |
| 3-bucket, 2 and 5 years | 2.93% | −0.41 |
| 3-bucket, 3 and 7 years | 2.75% | −0.59 |
| Refill only when low | 3.10% | −0.24 |
| Skip refill after a down year | 3.11% | −0.24 |
| Growth bucket moving to all-equity | 2.82% | −0.53 |
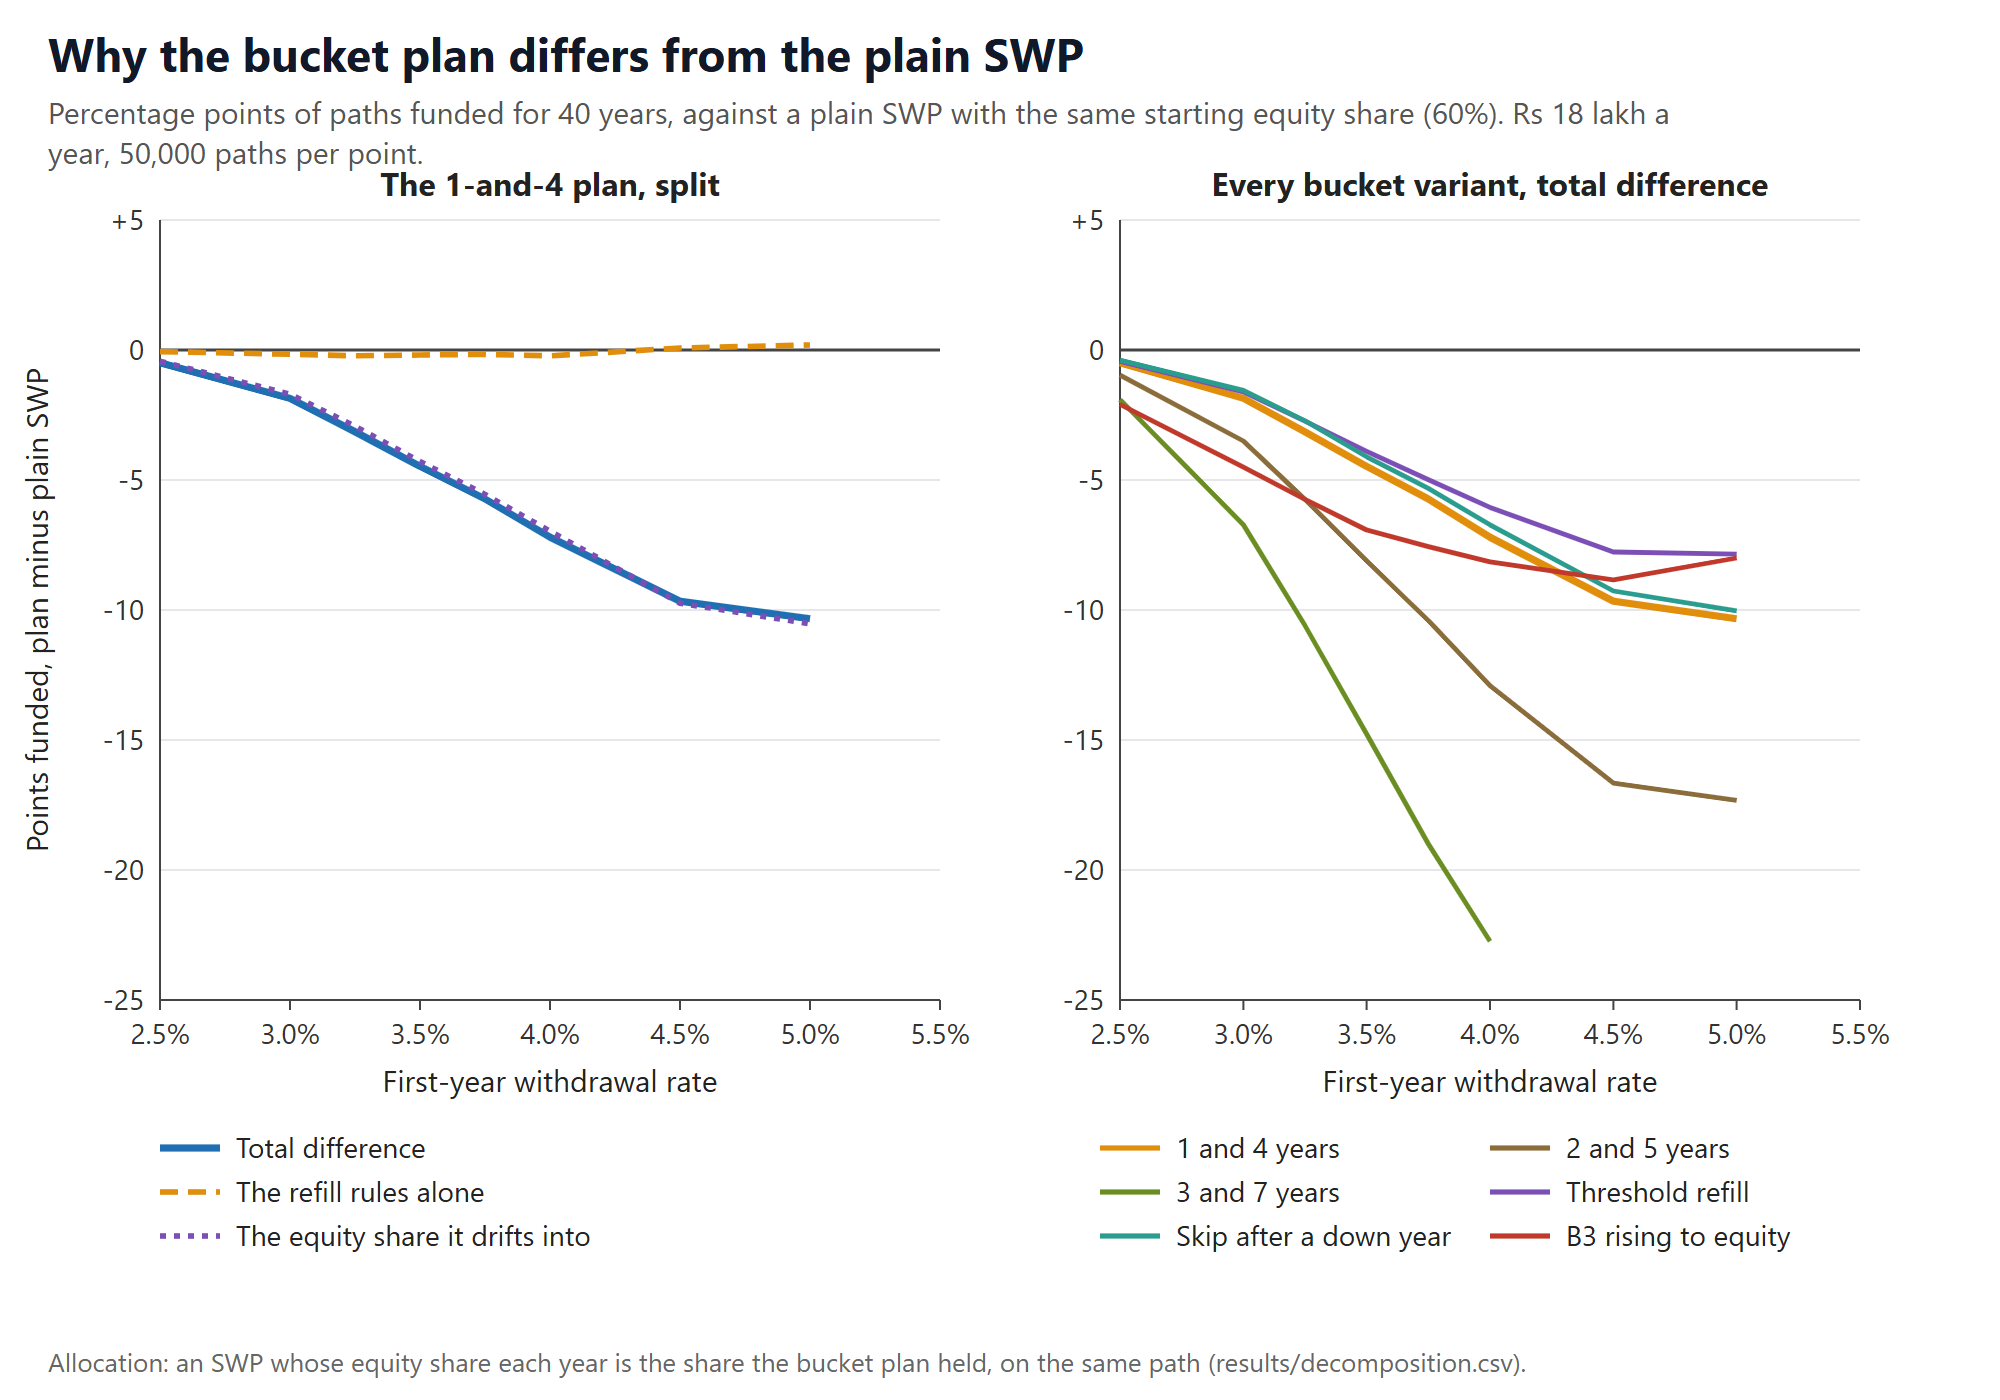
Why the buckets fell behind. At 3.5% over 40 years, the bucket plan lasted in 88.9% of 50,000 futures and the plain SWP in 93.4%. That's a gap of 4.48 points. To work out where it came from, we ran a third plan: a plain SWP that, every year in every future, held exactly the same share in equity as the bucket plan happened to hold at that moment. It lasted in 89.1%. That splits the gap neatly in two:
- The refill rules themselves: 0.19 of a point.
- The share in equity that the buckets drift into: 4.29 points.
Here's what's going on: The plain SWP gets reset to 60% equity every year, so after a crash it buys shares while they're cheap. The bucket plan doesn't. Its equity share wanders with the market: after a fall of more than 20%, it held 59.4% in equity on average, and after a rise of more than 30%, 63.3%. In other words, it ends up holding more shares after good years and fewer after bad ones, which is the wrong way round.
What this does and doesn't mean. This is about whether the money lasts, not about how people behave. The usual argument for buckets is that seeing a year's cash in the bank helps you stay calm and stay invested when markets crash. We didn't model panic, discipline or peace of mind. If buckets stop you from selling shares at the bottom, that's a real benefit, but it isn't in these numbers. One bucket version, where the growth bucket moves towards all-equity, does beat the plain mix in some long, high-withdrawal cases. That's only because it ends up close to 100% in shares, so it isn't a fair comparison.
What to notice: the trouble with buckets isn't the refill rules. It's that the share in equity drifts with the market.
4.6 How things end up
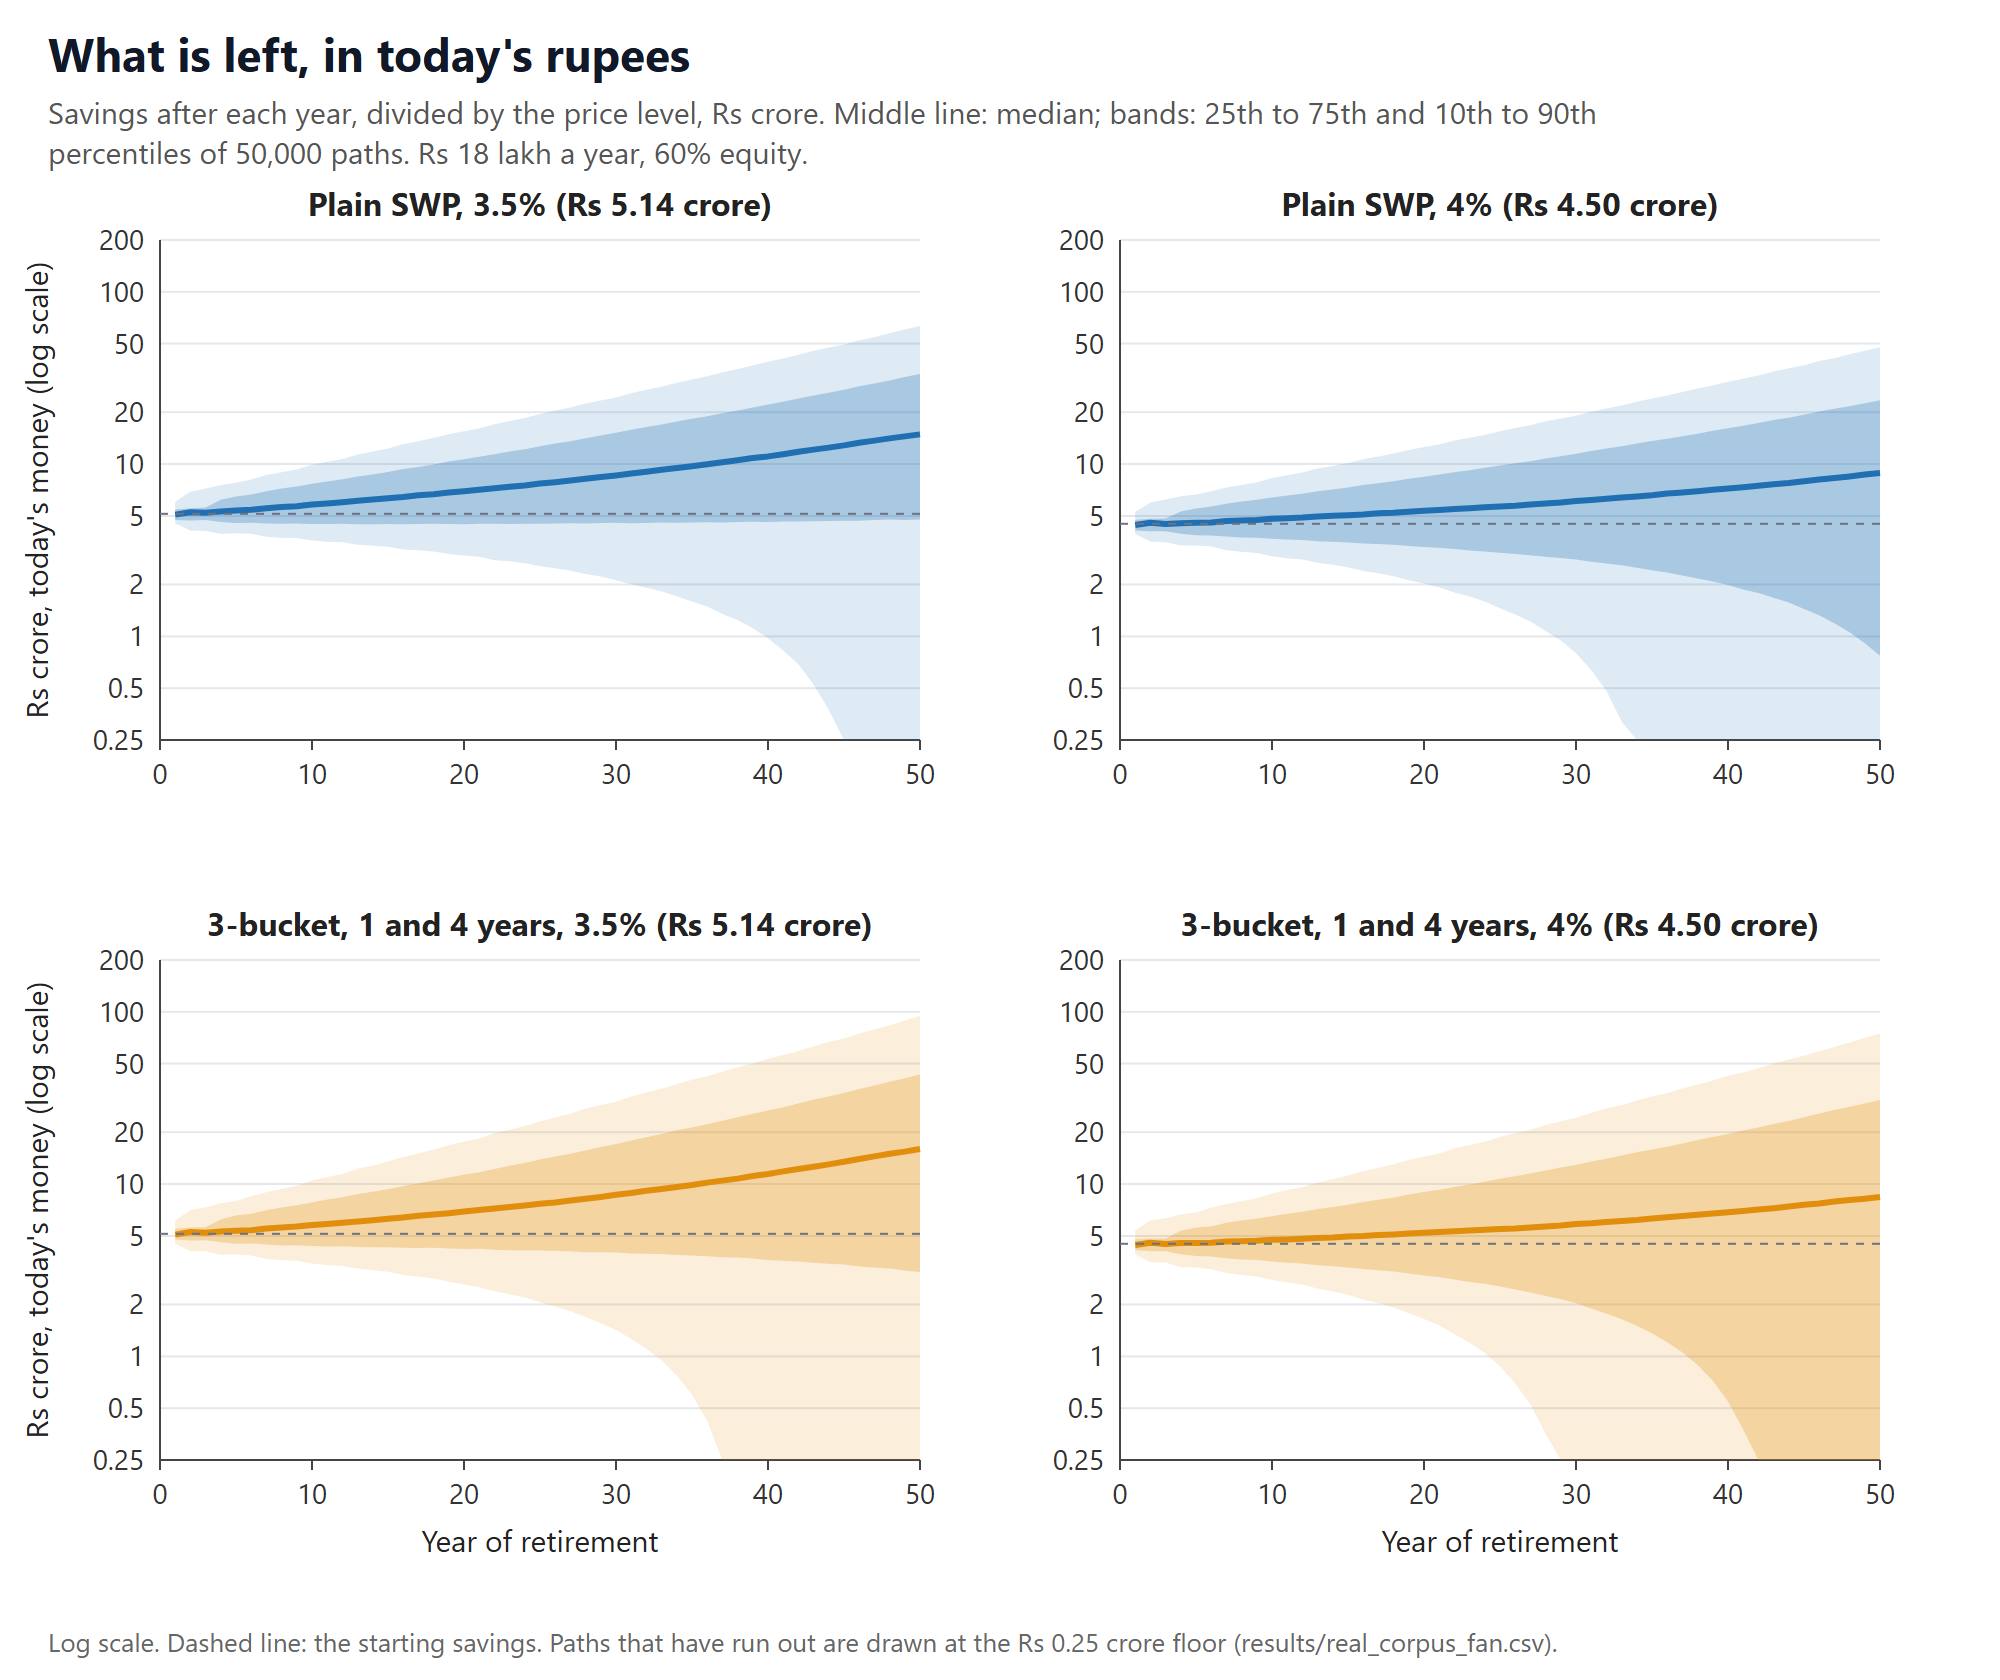
For the plain SWP at 3.5%, the middle outcome after 50 years was ₹14.88 crore in today's money. The luckiest 10% of futures ended with more than ₹63.39 crore. The unluckiest 10% had run out completely.
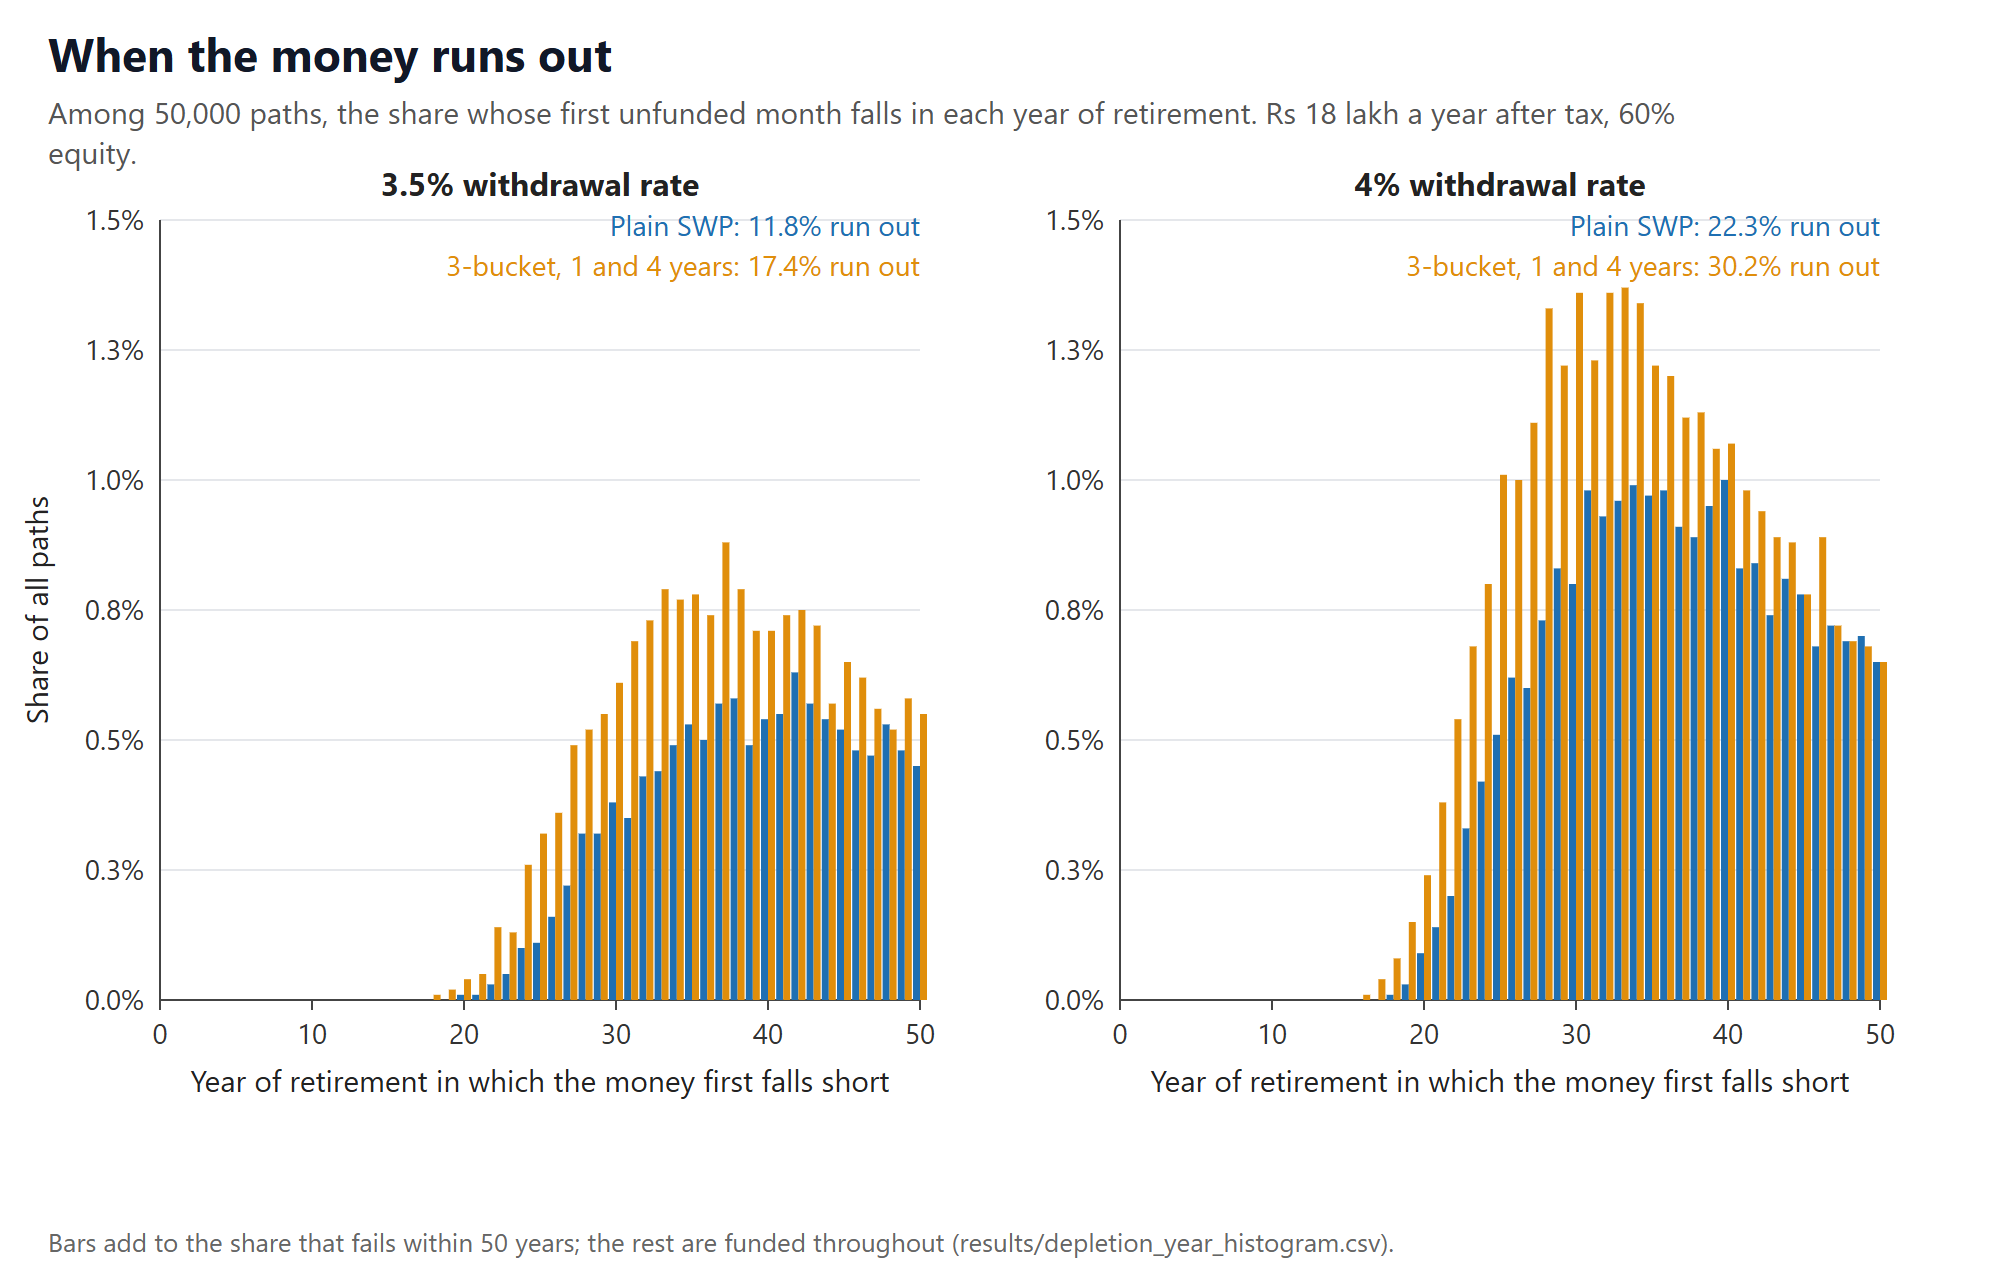
At 4.0%, the plain SWP ran out within 50 years in 22.3% of futures, and the earliest that happened was year 17. For the bucket plan it was 30.2%, with the earliest in year 16.
What to notice: "lasting" and "comfortable" aren't the same thing. Most futures where the money lasts end up very well off. The failures are a minority, but when they happen, they can hit in your 50s or 60s. And a plan that "lasts 40 years" might finish with ₹10 or with ₹10 crore. Both count as success.
4.7 How much goes to tax
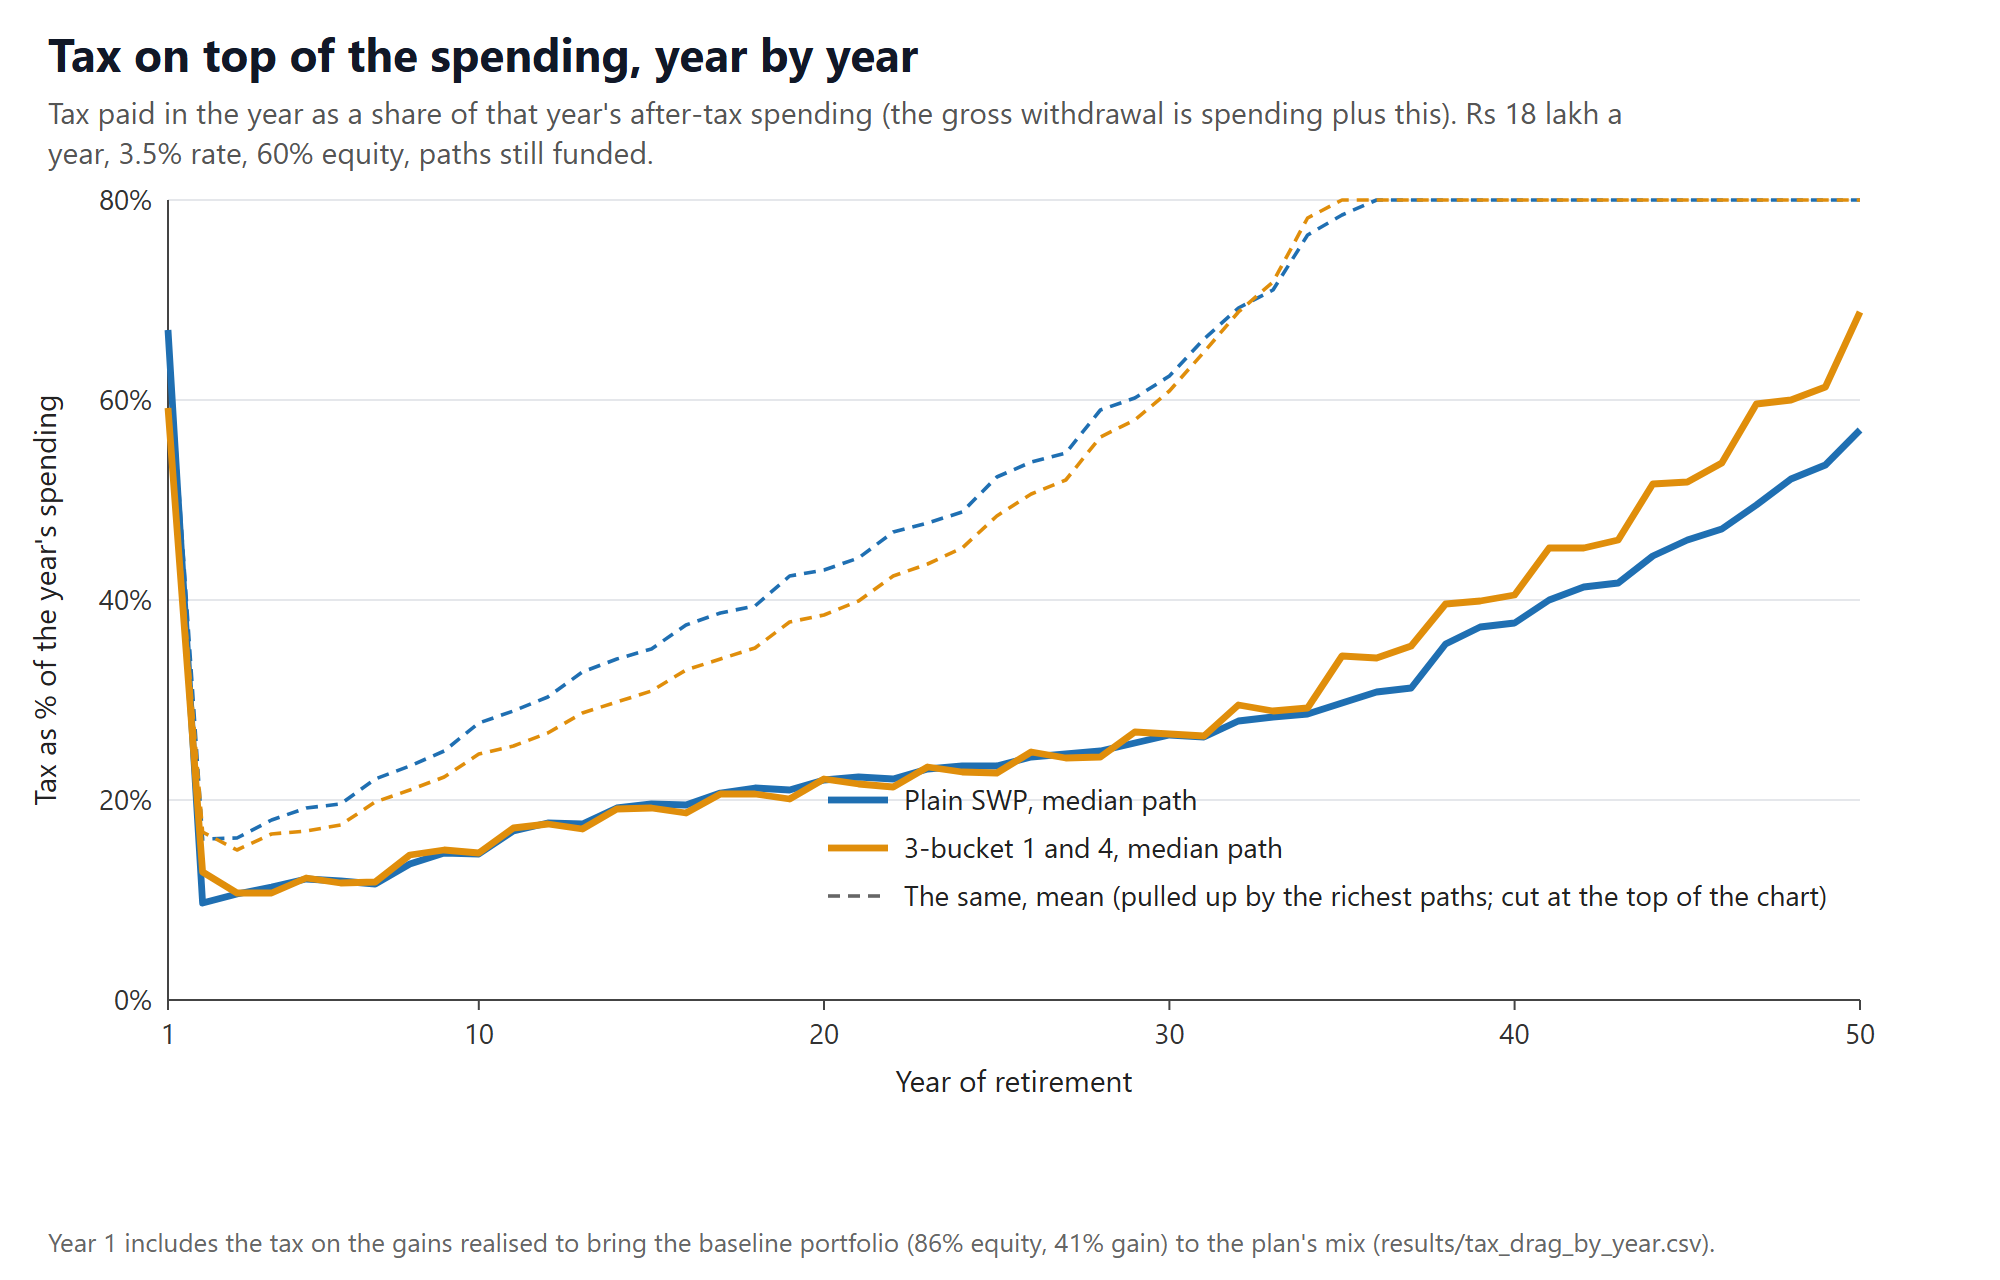
| Year of retirement | 1 | 2 | 5 | 10 | 20 | 30 | 40 | 50 |
|---|---|---|---|---|---|---|---|---|
| Plain SWP: tax as a % of that year's spending (middle outcome) | 67% | 10% | 12% | 15% | 22% | 27% | 38% | 57% |
3.5% withdrawal, counting only futures where the money hasn't yet run out.
Year 1 is a one-off. Our example portfolio starts with 86% in equity, and 41% of its value is untaxed gains. Bringing it down to a 60% equity mix means selling, and the tax on those sales lands in year 1.
If there were no tax at all, the safe 40-year rate would be 3.82% instead of 3.34%. So tax costs you 0.48 of a percentage point. Paying tax once a year instead of quarterly (the way the calculator does it) barely matters: the rate only moves to 3.37%.
Fees hurt about as much as tax. If you pay 1% a year in fund costs (a regular plan, or an adviser's fee), the safe 40-year rate falls to 2.95%. With no costs at all, it would be 3.44%.
What to notice: a 1% fee knocks 0.39 of a point off your safe rate. All the income tax together knocks off 0.48.
4.8 Two stress tests
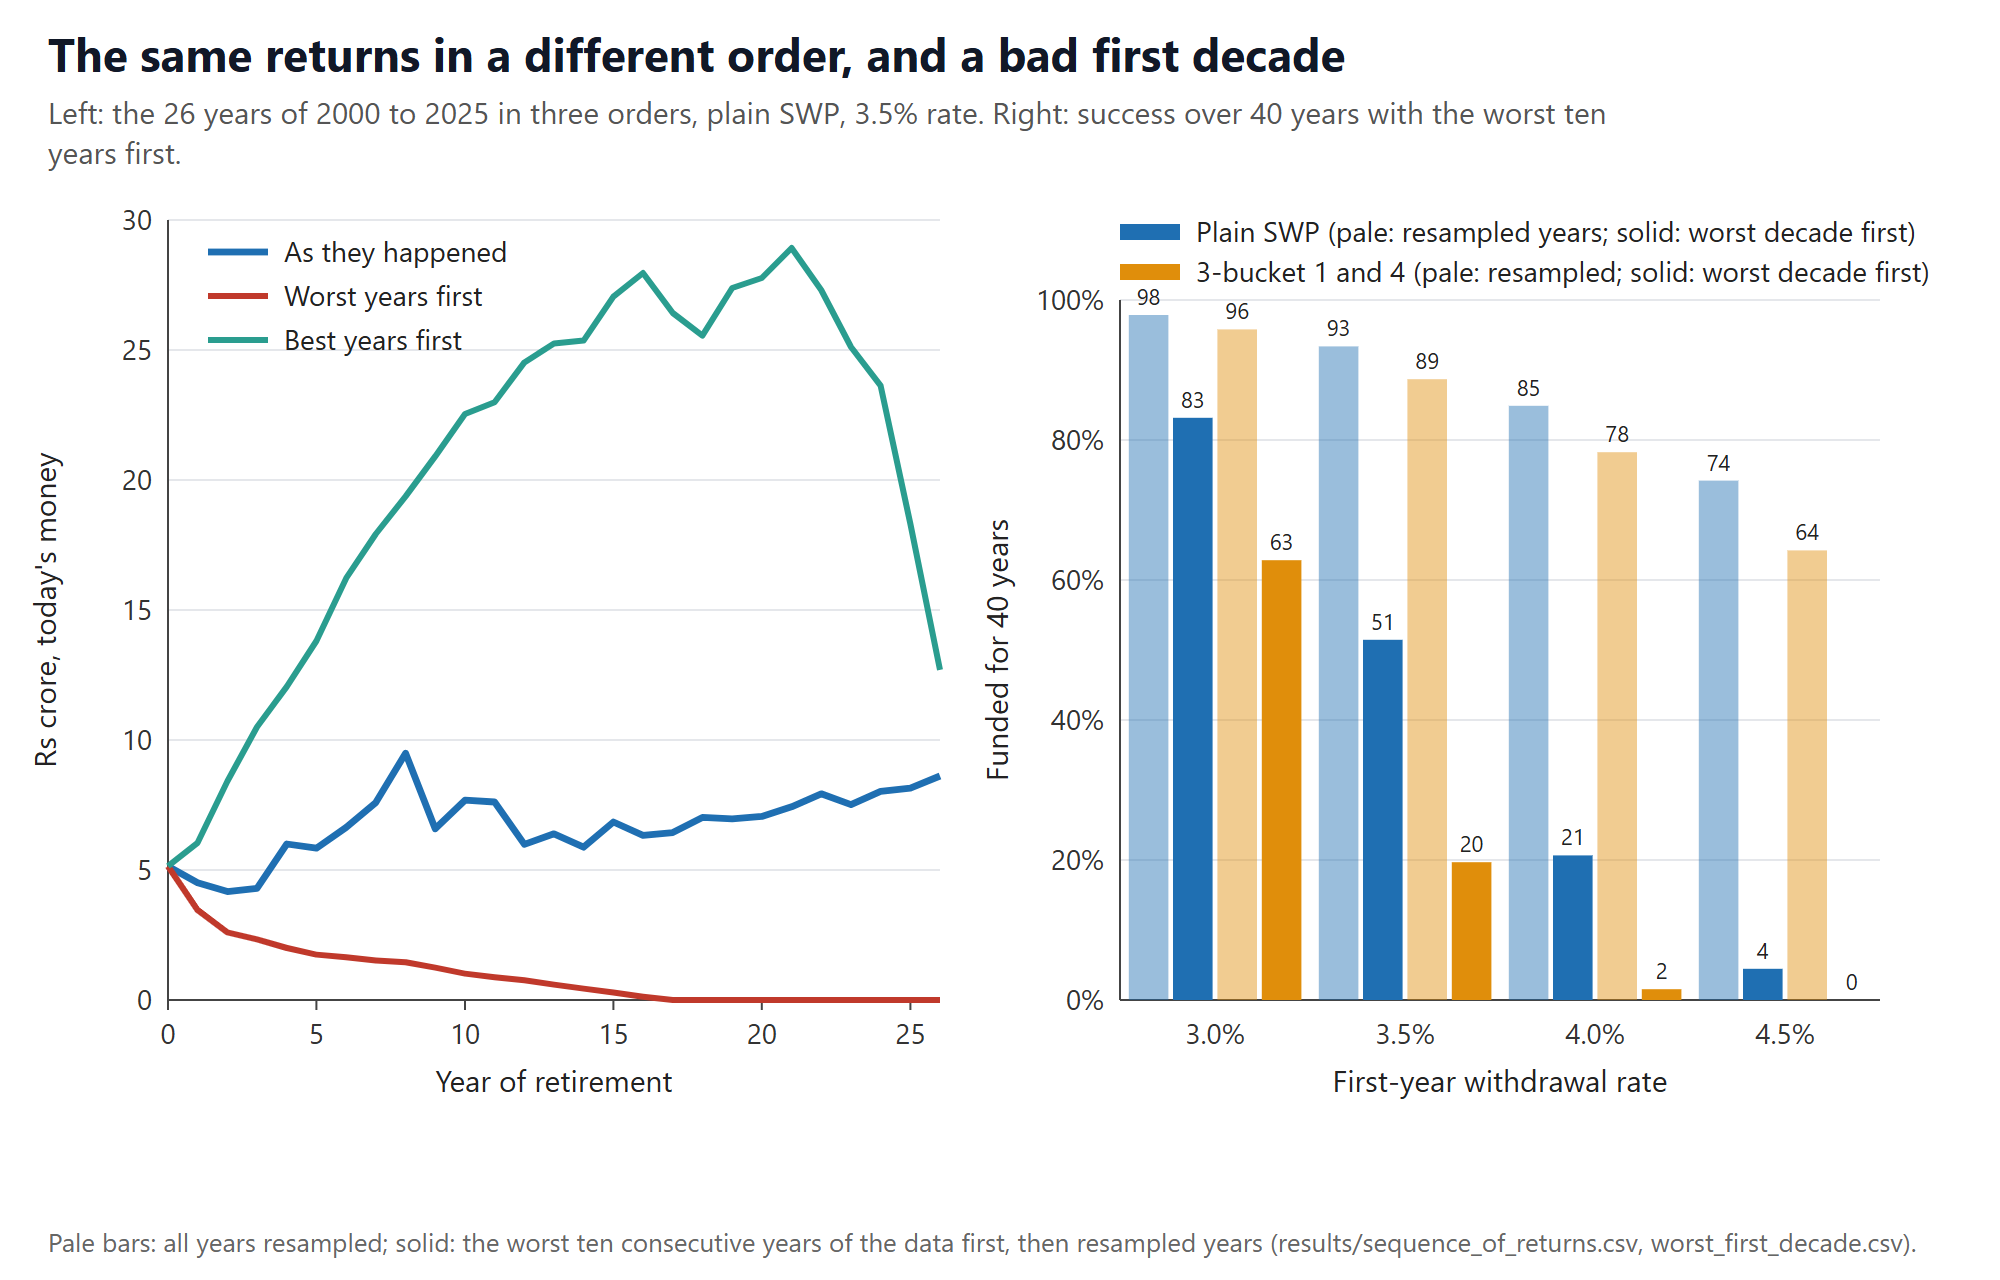
| Order | Withdrawing 3.5%: what was left after 26 years |
|---|---|
| As they actually happened (2000–2025) | ₹8.61 Cr left |
| Best years for shares first | ₹12.70 Cr left |
| Worst years for shares first | Ran out in year 17 |
The worst ten years, right at the start. The worst stretch of ten years in a row in our data was 2008 to 2017. A 60/40 portfolio earned only 0.76% a year above inflation over that decade. Here's what happens if your retirement starts with it:
| Lasted 40 years | 3% | 3.5% | 4% | 4.5% |
|---|---|---|---|---|
| Plain SWP, normal | 97.9% | 93.4% | 84.9% | 74.2% |
| Plain SWP, worst decade first | 83.2% | 51.5% | 20.6% | 4.5% |
| 3-bucket, normal | 95.8% | 88.7% | 78.3% | 64.2% |
| 3-bucket, worst decade first | 62.8% | 19.7% | 1.6% | 0.0% |
What to notice: your first ten years of retirement decide most of what happens. A bad start at 3.5% turns a 93-in-100 plan into a coin toss. That's why it pays to have a spending cut ready in case you need it (see scenarios 3 and 4 in section 8).
5. Worked examples
How much you'd need for a plain SWP with 60% in equity, using our main model:
| Yearly spending after tax | Years | Rate for 95 in 100 | Savings needed | Times yearly spending | Links |
|---|---|---|---|---|---|
| ₹12 lakh (lean) | 40 | 3.44% | ₹3.49 Cr | 29.1 | Replicate (Pro) Free account |
| ₹12 lakh (lean) | 50 | 3.11% | ₹3.86 Cr | 32.2 | Replicate (Pro) Free account |
| ₹18 lakh (regular) | 40 | 3.34% | ₹5.38 Cr | 29.9 | Replicate (Pro) Free account |
| ₹18 lakh (regular) | 50 | 3.01% | ₹5.97 Cr | 33.2 | Replicate (Pro) Free account |
| ₹30 lakh (fat) | 40 | 3.24% | ₹9.26 Cr | 30.9 | Replicate (Pro) Free account |
| ₹30 lakh (fat) | 50 | 2.90% | ₹10.36 Cr | 34.5 | Replicate (Pro) Free account |
Which link should you click?
- Replicate (Pro) opens the plan with the study's average returns, tax slabs switched on, and 40.9% of the savings counted as untaxed gains, just like our example person.
- Free account opens the same plan with flat tax rates and no untaxed gains. It works on a free account, but its tax won't match the study's.
Either way, a link shows one plan in one future, with steady average returns every year. Neither one will give you the success rates above. Those need thousands of futures.
Our example person
She's 50 now, plans to retire at 53, and spends ₹1 lakh a month in today's money. With inflation at 6% until she retires, she'll have ₹3.15 crore and need ₹14.3 lakh in her first year. That's a withdrawal rate of 4.54% before she's made a single choice.
| Her plan (plain SWP unless stated) | 30 years | 40 years | 50 years |
|---|---|---|---|
| 60% equity | 88.0% | 74.8% | 65.7% |
| 86.1% equity (leaves her holdings as they are, no selling) | 85.3% | 77.1% | 72.4% |
| 3-bucket at 60% equity | 79.9% | 64.7% | 56.8% |
For her money to last 40 years in 95 out of 100 futures, she'd need ₹4.21 crore (a 3.40% rate). That's ₹1.06 crore more than she'll have. Under the cautious model she'd need ₹5.52 crore.
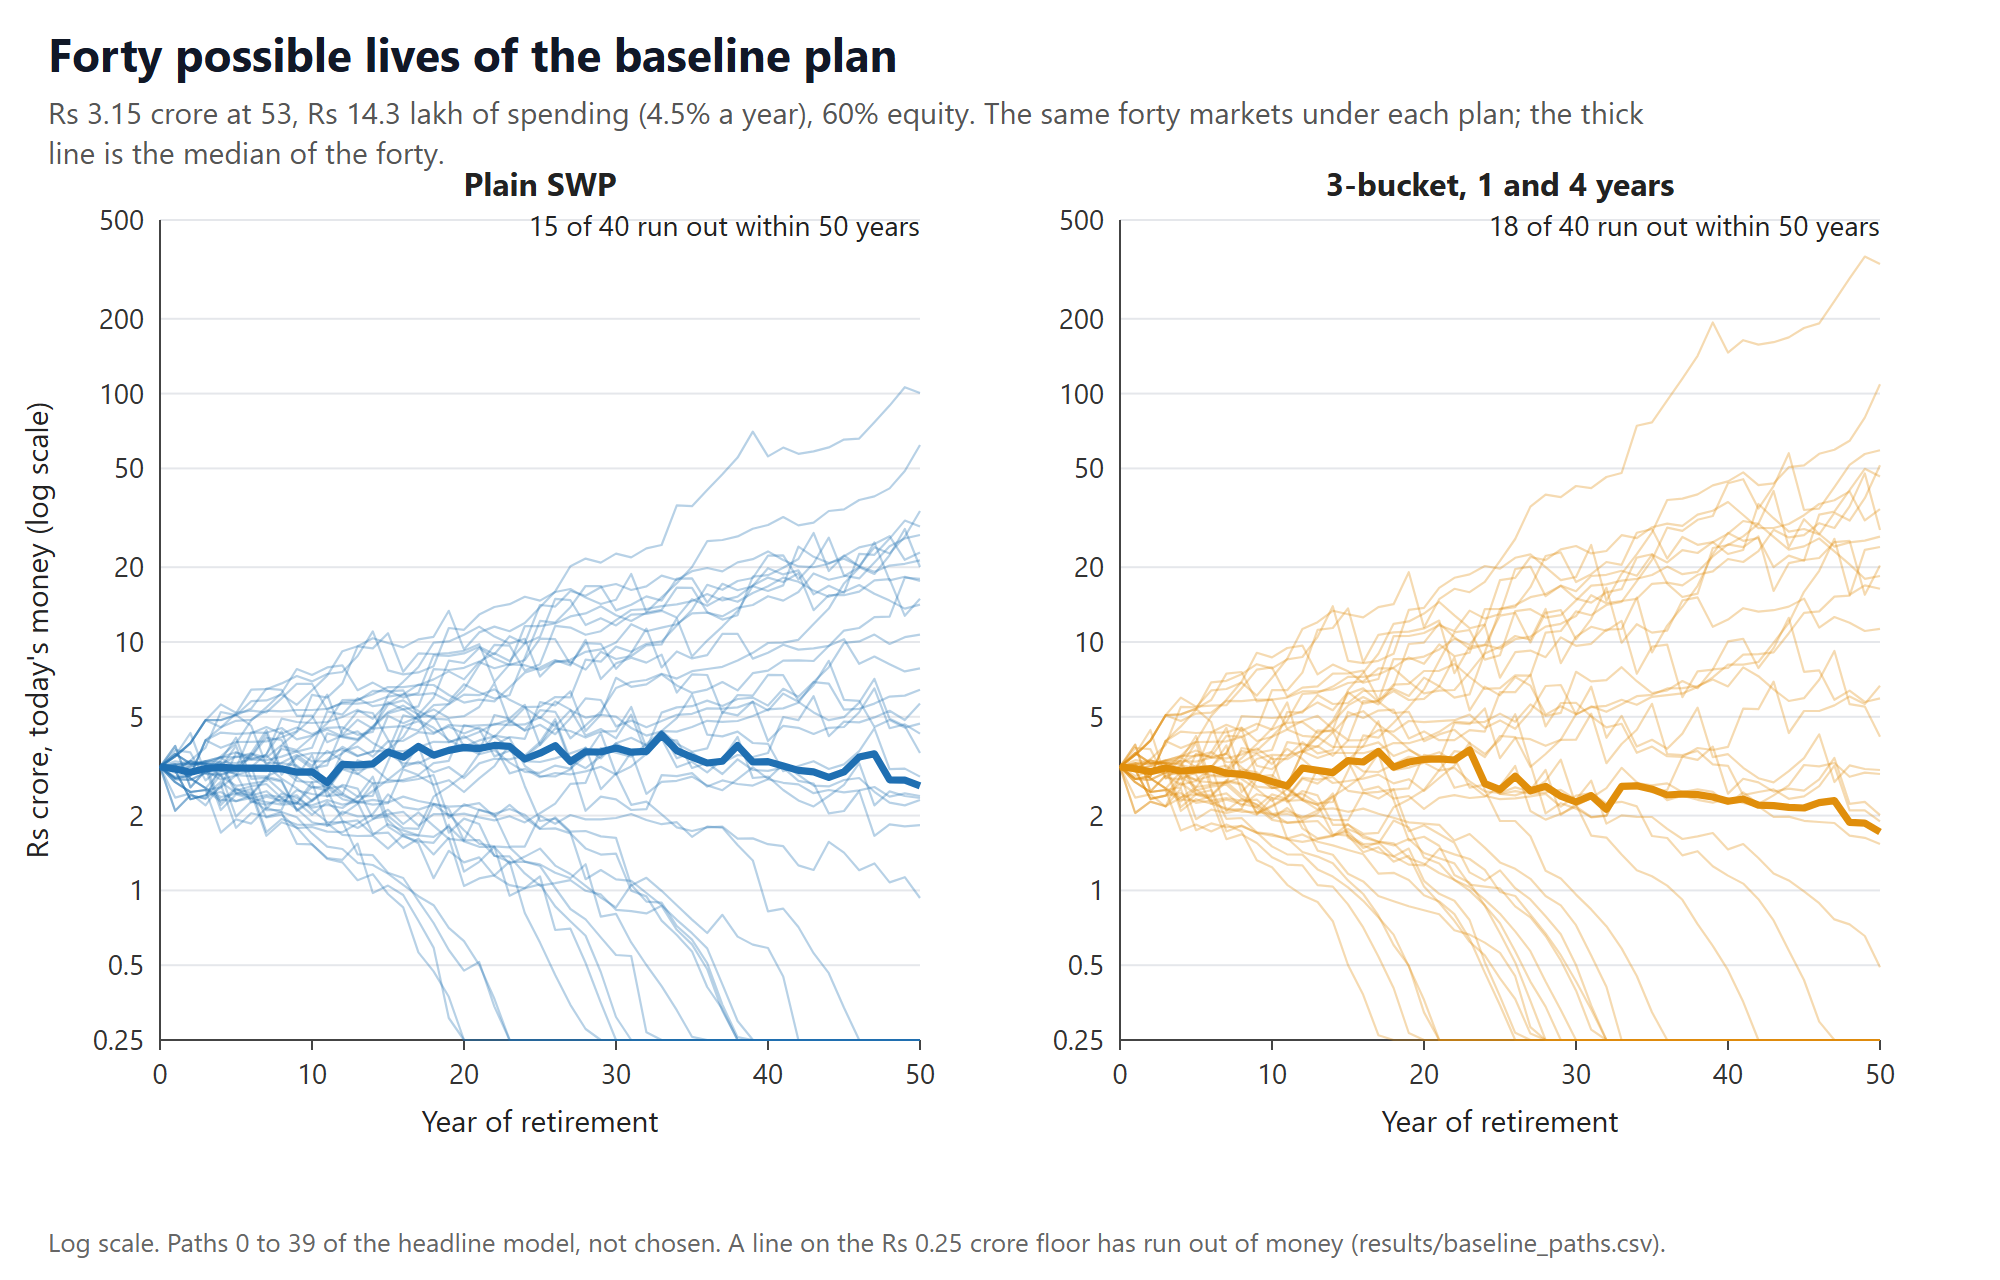
We followed forty of her possible futures. Under a plain SWP, she ran out of money within 50 years in 15 of them. Under the 3-bucket plan, 18.
Realistically, she has three options: work a bit longer, spend a bit less, or accept lower odds. Scenario 6 in section 8 puts her plan side by side with the ₹4.21 crore version. That link also includes a three-year market slump, so the years it shows are a stress case, not a typical one.
6. What moves the answer most
We changed one thing at a time and watched what happened. The starting point is a plain SWP at 3.5% for 40 years, which lasted in 93.4% of futures:
| What we changed | Lasted 40 years | Change (percentage points) |
|---|---|---|
| History in five-year chunks | 93.4% | 0.0 |
| Tax paid once a year | 93.7% | +0.3 |
| ₹3 lakh a year of other income | 92.3% | −1.0 |
| History in two-year chunks | 91.1% | −2.2 |
| Equity 1 point lower | 88.6% | −4.8 |
| Leaving out 2008 | 98.4% | +5.0 |
| Only 2011–2025 data | 86.5% | −6.8 |
| Fund costs of 1% a year | 86.4% | −6.9 |
| Single years picked at random | 85.9% | −7.5 |
| Cautious model, built on 2011–2025 only | 78.3% | −15.0 |
| Cautious model, inflation 1 point higher | 74.6% | −18.7 |
| Equity 3 points lower | 72.4% | −20.9 |
Barely matters (under a point): using longer chunks of history, and paying tax yearly instead of quarterly. Having ₹3 lakh of other income is right at about one point.
Matters a lot (more than five points): what you expect from shares in future, how much you pay in fees, whether 2008 and the rest of the 2000s are in the data, and whether bad years tend to come in clusters.
The things you can control, like fees and how much you spend, matter about as much as the things you can't.
7. What this study can't tell you
- Twenty-six years isn't forty. Every long future here is pieced together from the same 26 years. Anything worse than what happened in that period simply can't show up. The lower-return runs ask "what if the future is poorer?", but they aren't predictions.
- The 2000s carry a lot of weight. That decade had a boom, a 51% crash in 2008 and a 78% bounce in 2009. How much you expect something like that again can move the answer by more than a percentage point.
- Debt returns before 2011 are our estimate, not real index figures.
- The people in our study never change. They never cut back or splurge (except in the guardrails version), never earn again, never inherit, never face a big medical bill, and never panic. We also left out pensions, rental income, one-off big expenses, and healthcare costs rising faster than general inflation.
- Lasting isn't the same as being well off. A plan that scrapes through with almost nothing and one that ends with crores both count as success.
- Tax rules will change. These are FY2026-27, new regime. We'll re-run the study when they do.
- India might not keep growing the way it has. Looking at a country whose market did well and assuming that continues is a bias in itself.
- The calculator and this study are different tools. The calculator follows one steady future. The study runs thousands of futures built from history.
8. Try it yourself
The finfire calculator lets you put two plans side by side using Compare. Each link below opens Plan B on screen with Plan A already pinned as a dashed line, so you can see both. Press Unpin to drop Plan A. Anything you change only affects Plan B.
Compare is a Pro feature. If you're on a free account, the links open a sample plan with a short note explaining why.
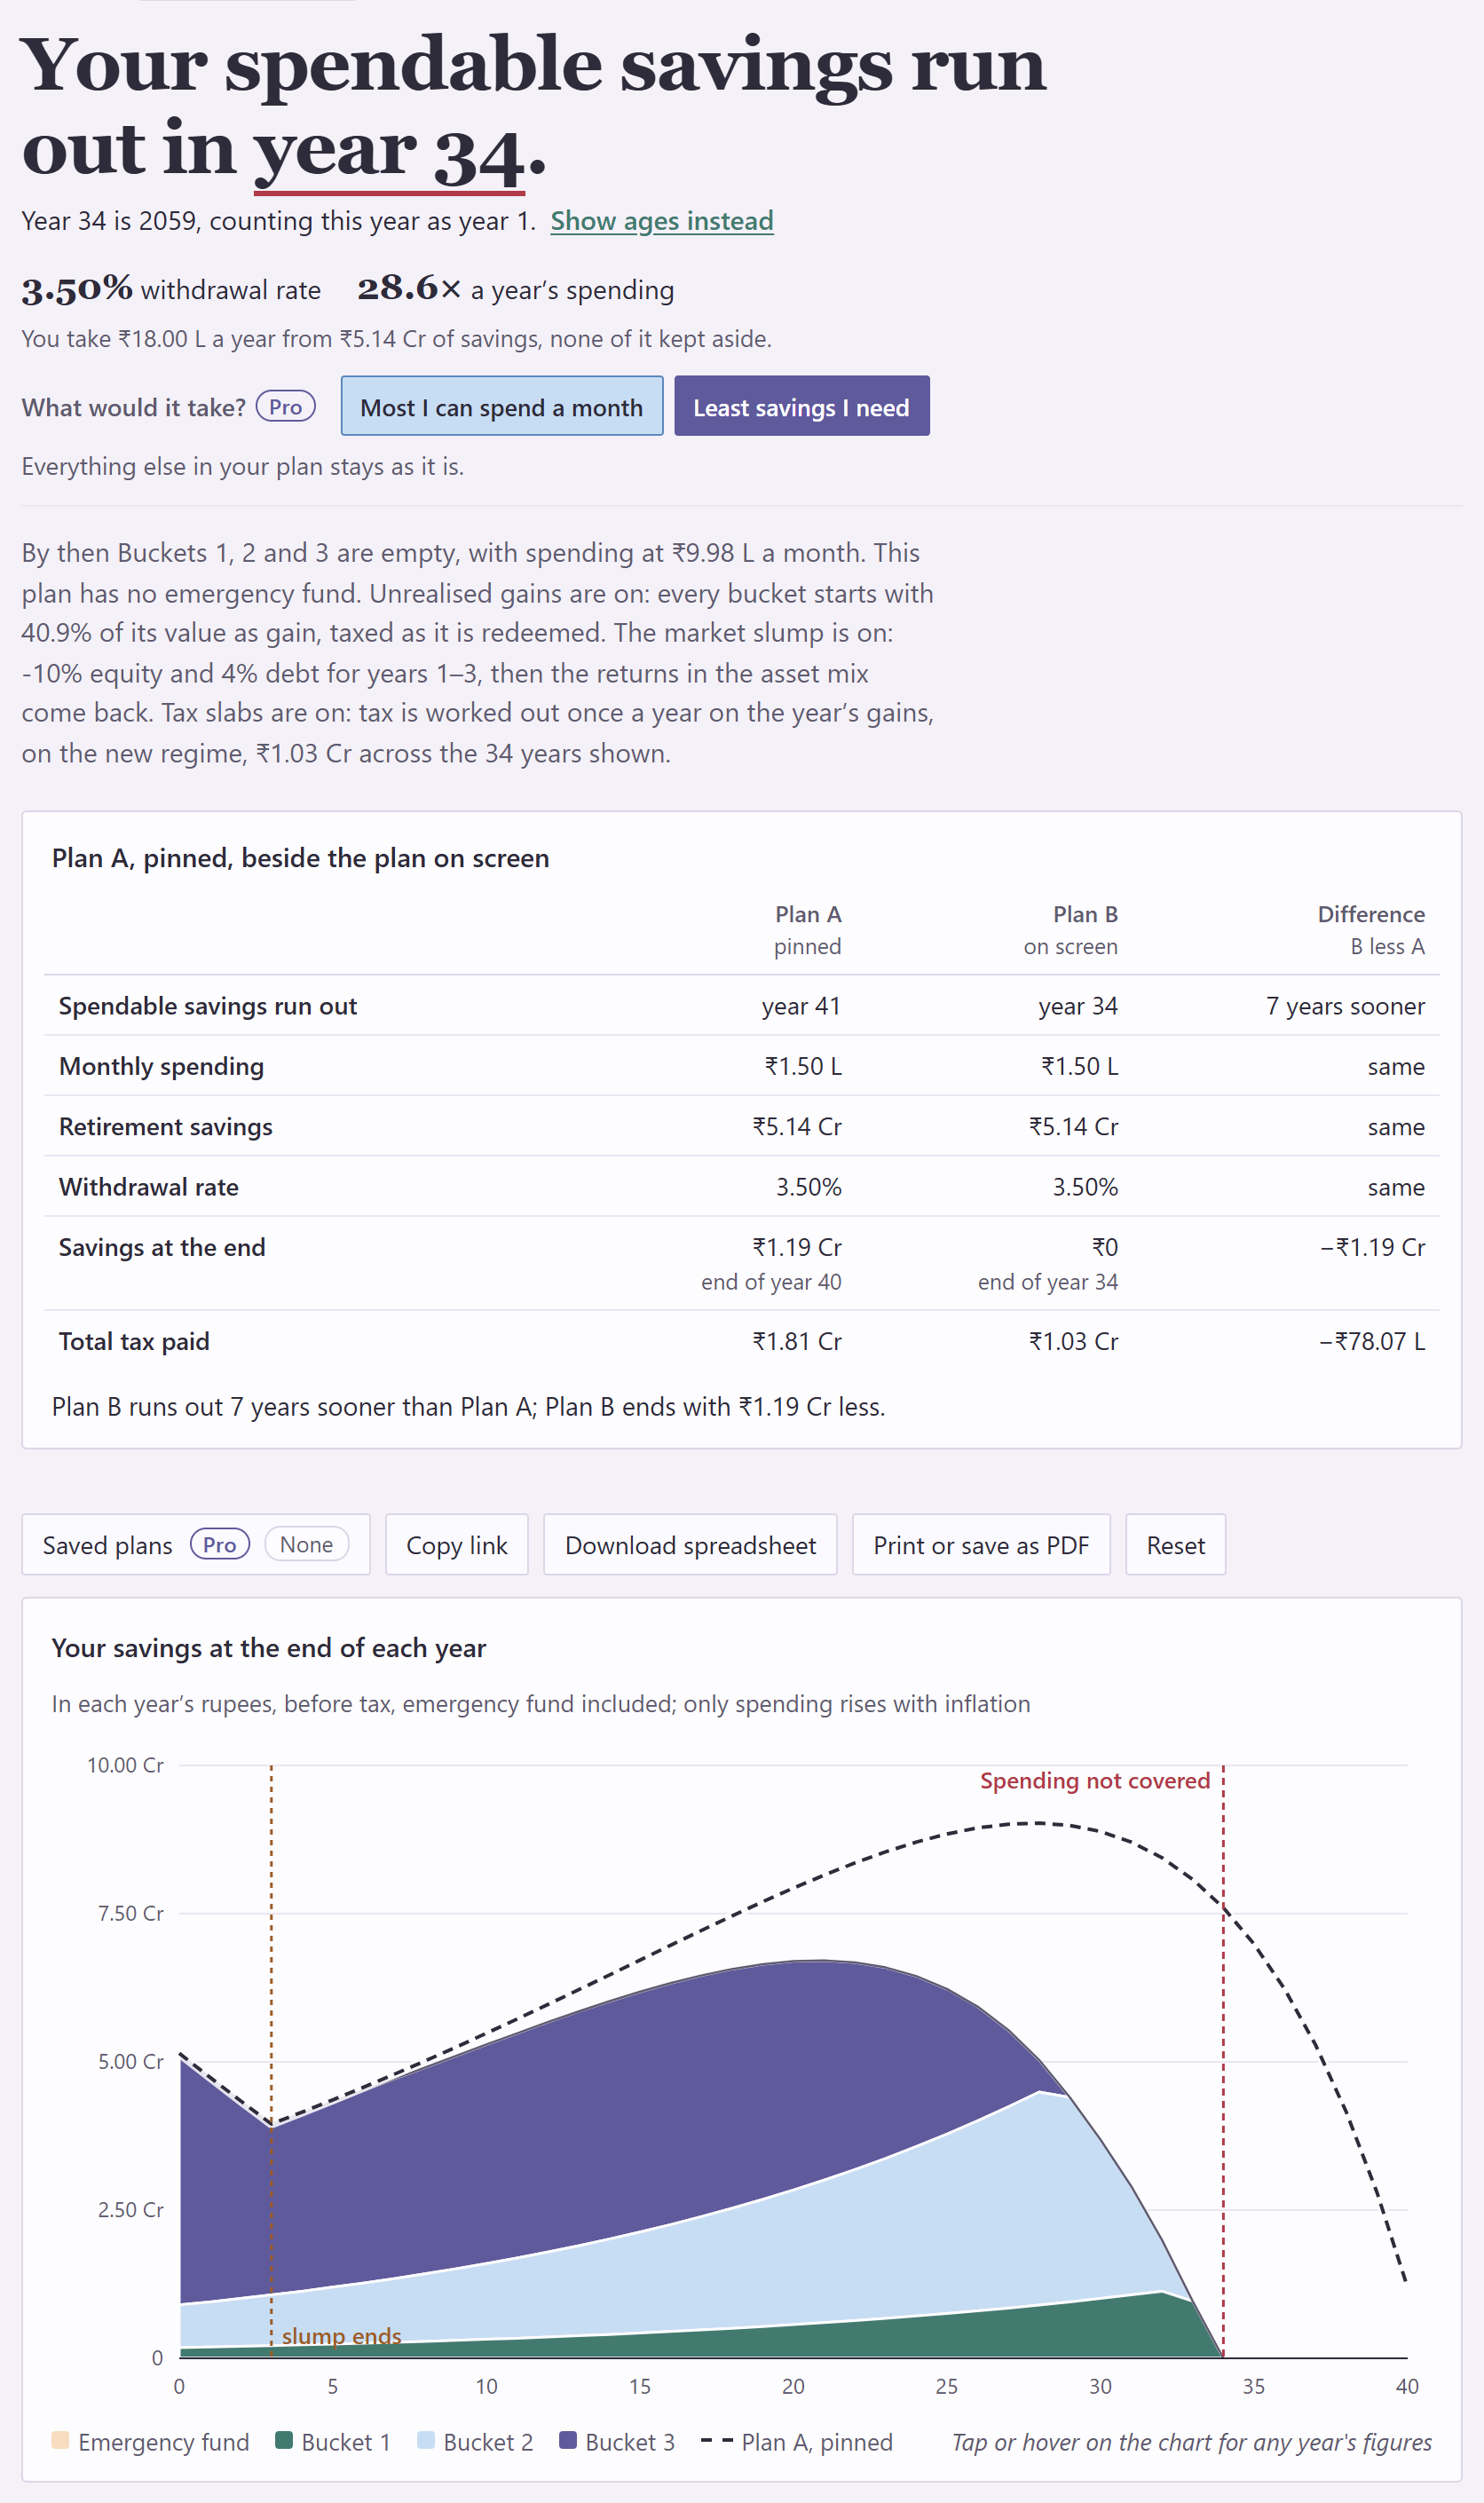
Compare is a Pro feature.
-
1 Half a point of withdrawal rate
- Plan A (pinned)
- ₹18 L a year from ₹4.50 Cr (4.0%)
- Plan B
- Same spending from ₹5.14 Cr (3.5%)
- What you'll see
- Plan A runs out in year 30, Plan B in year 41, and Plan B ends ₹1.19 Cr richer
- Then try changing
- Your own monthly spending. To find the savings you'd need: yearly spending ÷ the rate you want
-
2 One portfolio vs three buckets
- Plan A (pinned)
- Plain SWP, 60% equity, ₹5.14 Cr
- Plan B
- The calculator's buckets (12 + 48 months), same 60% equity
- What you'll see
- Year 41 vs year 34, and Plan B ends ₹1.19 Cr poorer
- Then try changing
- The months in Bucket 1 and Bucket 2
-
3 Cut spending 10% from year 4
- Plan A (pinned)
- 3.5% plan, no change
- Plan B
- Spends ₹1.35 L a month from year 4
- What you'll see
- Year 41 vs year 57
- Then try changing
- When the cut starts, or how big it is. A cut that starts later helps less
-
4 Cut spending 20% from year 4
- Plan A (pinned)
- 3.5% plan, no change
- Plan B
- Spends ₹1.2 L a month from year 4
- What you'll see
- Year 41 vs not running out within 120 years
- Then try changing
- Same as above
-
5 Equity returns 2 points lower
- Plan A (pinned)
- Study's average returns
- Plan B
- Equity at 11.09% instead of 13.21%
- What you'll see
- Year 41 vs year 32
- Then try changing
- The equity Return cells, to whatever you believe
-
6 Our example person vs the savings the study says she needs
- Plan A (pinned)
- ₹3.15 Cr, ₹14.29 L a year (4.54%)
- Plan B
- Same spending from ₹4.21 Cr (3.40%)
- What you'll see
- Year 25 vs year 46
- Then try changing
- The savings figure, to what you actually have
One more, without Compare: the calculator's own simulated markets (Pro). This runs ₹18 lakh a year from ₹5.38 crore through 2,000 simulated markets, and the money lasts 40 years in 86% of them.
What the calculator can and can't show you. Each link shows one plan in one future. It won't reproduce the study's success rates. The calculator also works a little differently: it uses an average cost rather than tracking each purchase, pays tax once a year, and doesn't tax the selling on day one. When we set our engine to those same simpler rules, the two match to the rupee.
The calculator's simulated markets treat each year as independent of the last, so they line up with our cautious model rather than our main one. At 3.5% over 40 years, the calculator says 84.9%, our cautious model 83.9%, and our main model 93.4%.
Year numbers count years since you retired. If you'd rather see your age, switch Count years as to Age.
Appendix A. Before tax, for comparing with other studies
Most international studies ignore tax. Without any tax, the safe 40-year rate (95 in 100) is 3.82% (4.25% for 90 in 100), and the 50-year rate is 3.52%. For the 3-bucket plan it's 3.49% at 40 years.
Appendix B. Every way we simulated the future
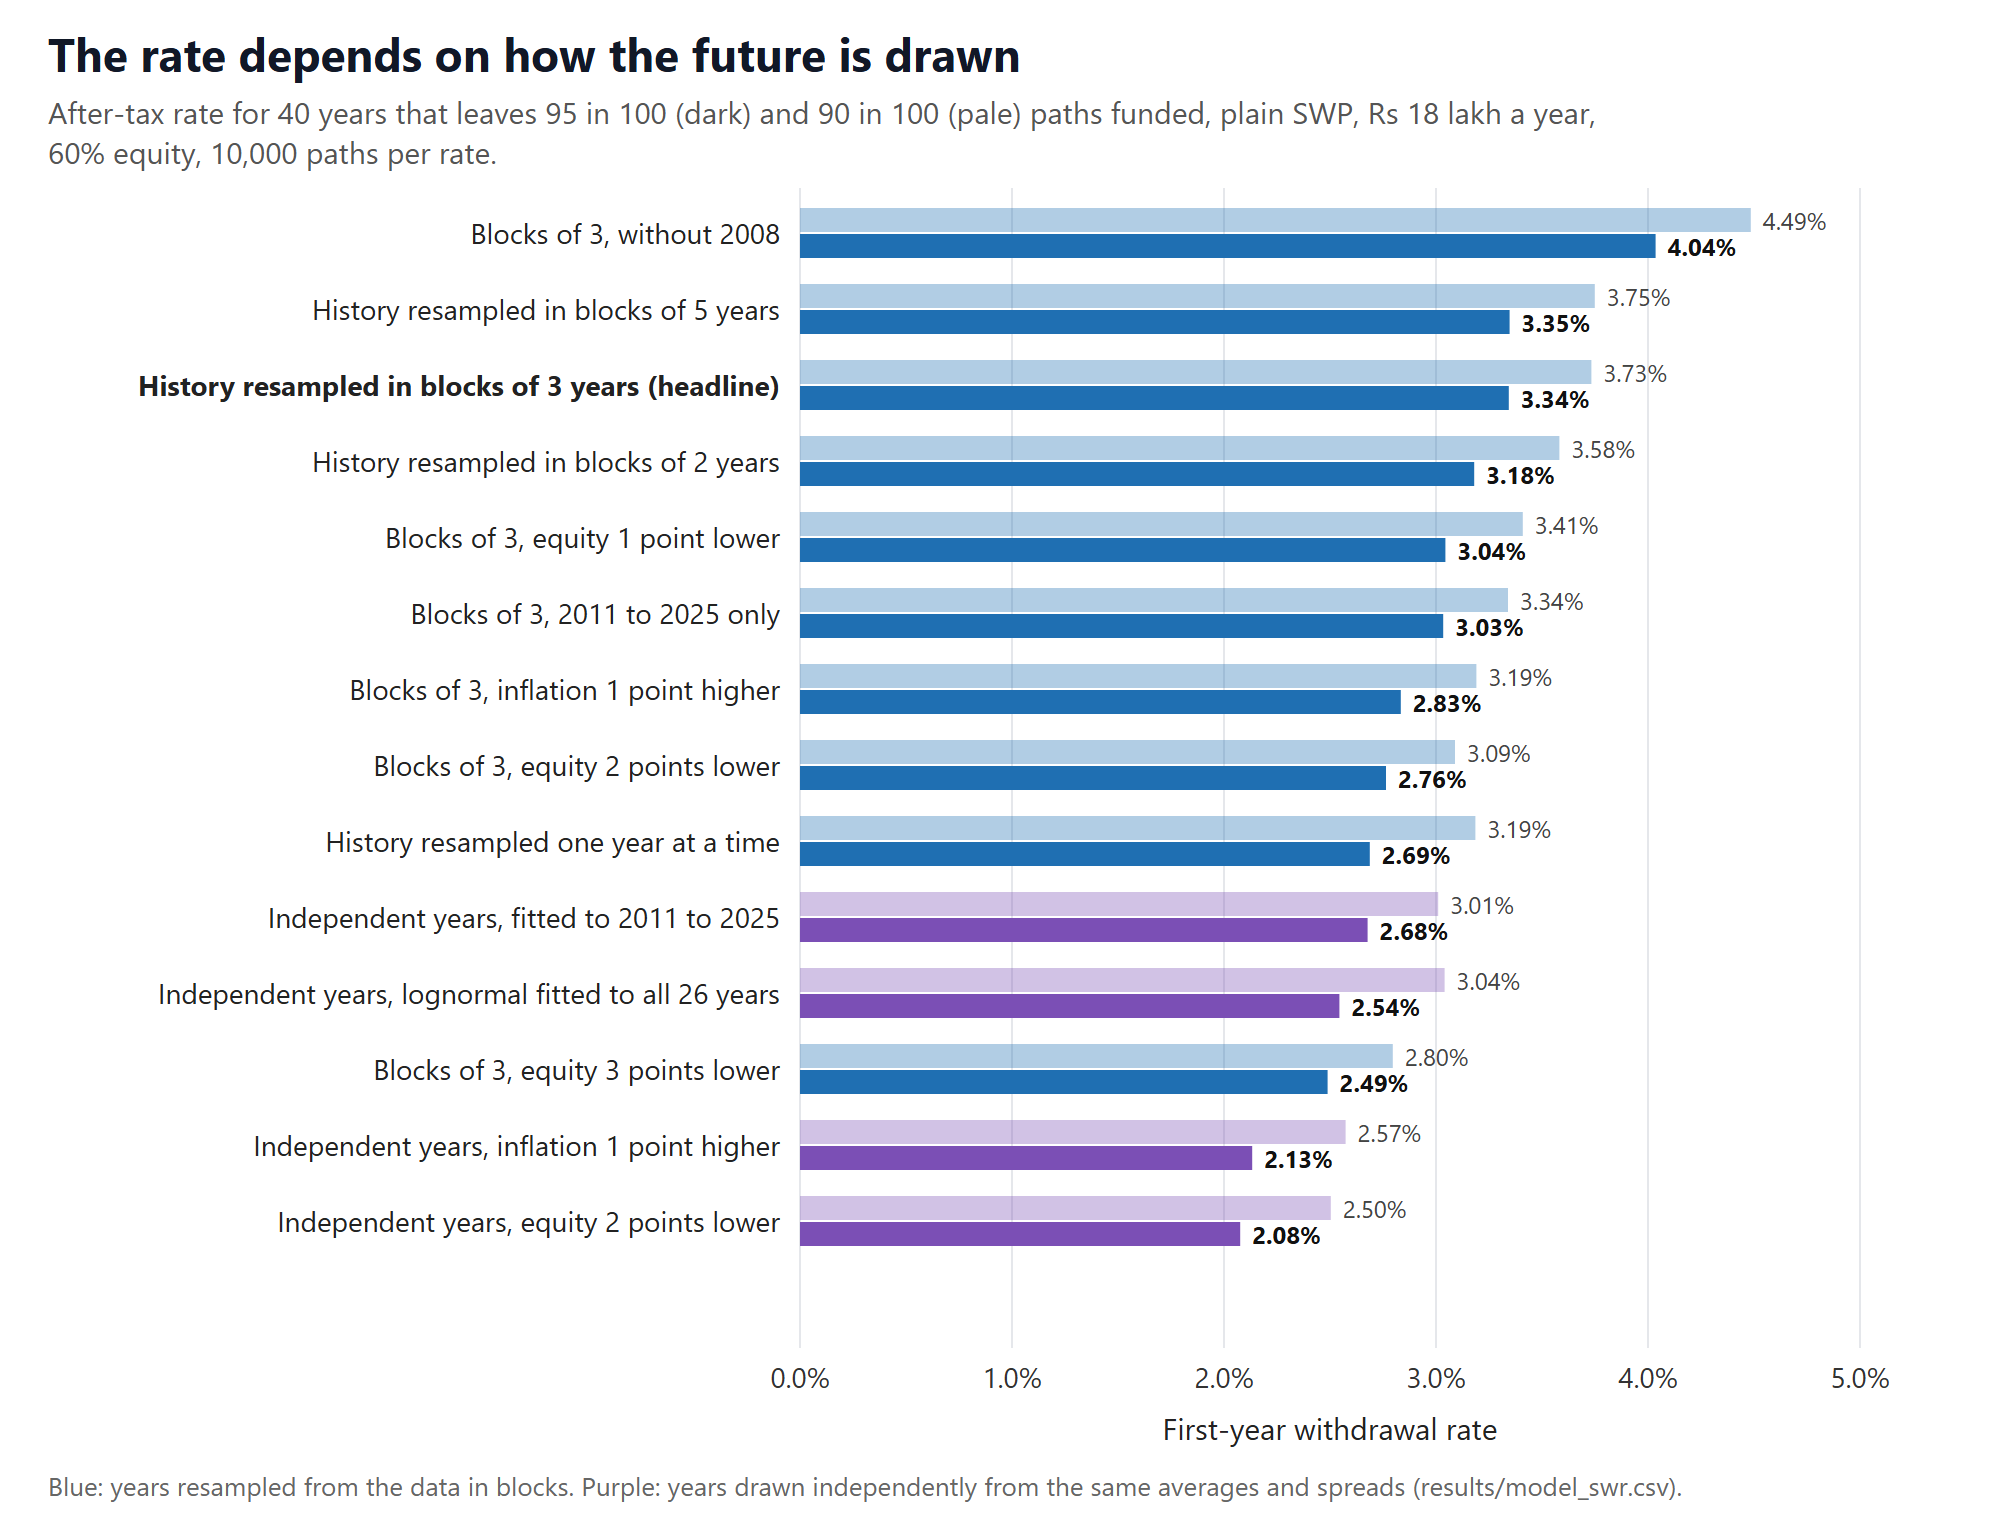
| How the futures were built | 40 yrs, 95 in 100 | 40 yrs, 90 in 100 | 50 yrs, 95 in 100 | 50 yrs, 90 in 100 |
|---|---|---|---|---|
| History in three-year chunks (main model) | 3.34 | 3.73 | 3.01 | 3.39 |
| Single years | 2.69 | 3.19 | 2.36 | 2.85 |
| Two-year chunks | 3.18 | 3.58 | 2.85 | 3.25 |
| Five-year chunks | 3.35 | 3.75 | 3.03 | 3.40 |
| Only 2011–2025 | 3.03 | 3.34 | 2.66 | 2.95 |
| Leaving out 2008 | 4.04 | 4.49 | 3.77 | 4.23 |
| Equity 1 point lower | 3.04 | 3.41 | 2.68 | 3.04 |
| Equity 2 points lower | 2.76 | 3.09 | 2.39 | 2.71 |
| Equity 3 points lower | 2.49 | 2.80 | 2.10 | 2.40 |
| Inflation 1 point higher | 2.83 | 3.19 | 2.48 | 2.81 |
| Cautious model, all 26 years | 2.54 | 3.04 | 2.25 | 2.71 |
| Cautious model, 2011–2025 | 2.68 | 3.01 | 2.32 | 2.63 |
| Cautious model, equity 2 points lower | 2.08 | 2.50 | 1.75 | 2.14 |
| Cautious model, inflation 1 point higher | 2.13 | 2.57 | 1.82 | 2.22 |
All figures are withdrawal rates in %. Plain SWP, ₹18 lakh a year, 60% equity.
Just for context: an SWP with "guardrails" (you cut spending by 10% whenever your withdrawal climbs above 120% of where it started) reached 4.42% over 40 years. But because it changes how much you spend, it's really answering a different question.
Appendix C. Checking our work yourself
You can rebuild every chart and table from the research/india-swr-2026/ folder: the data is in data/, the tax rules in inputs/tax_rules_FY2026-27.json, the 5,360 cases in inputs/grid.json, and the random seed is 20261014. We ran the whole set twice, and all 5,360 cases came out exactly the same both times. The exact inputs, links and results behind each chart are in results/reproducibility.csv.
Every number in this paper rests on assumptions, not forecasts. Tax rules are FY2026-27 under the new regime and may change. None of this constitutes financial, tax, or investment advice. finfire.org operates the calculator and offers paid tiers.
Reproducibility. The exact inputs, calculator links and results behind every figure and table in this paper: reproducibility.csv