The Illiquidity Trap
What it costs to sell your equity investments at Year 7 to buy a home
Paper 1 of the finfire.org research series
The question
A 30-year-old investor in India has Rs 50 lakh invested in equity and puts Rs 1 lakh a month into equity funds. At Year 7, they can buy a Rs 1 crore home. To do that they sell equities to pay 20% down payment, 6% for stamp duty, registration charges and buffer. After that, part of the monthly SIP component is used to fund EMI. This is the 'buyer' persona in this paper.
We compare this with a twin 'renter' who keeps renting and stays fully invested all through the tenure.
The question is: How much wealth is lost (if any)? Will the home ever catch up? What yearly price growth would the home need to win by the Year 27? And what would be the impact on retirement plans?
The short answer
The home does not catch up. Not surprising though. But, it's also not really a trap or as drastic as it sounds.
At Year 27 (age 57) the buyer is Rs 2.92 crore behind, which is 9.1% of the renter's net worth. The buyer reaches financial independence about one year later.
That is the only real cost. To close the gap by Year 27, the home would need to grow about 9.23% a year (4.02% after inflation). We have assumed 5.5% home growth in this paper.
You can always try this scenario with your own numbers and with additional nuances. See "Try this scenario yourself" section below.
Continue reading if you are still interested.
Assumptions and Method
- The investor is aged 30, lives in India, has a family of 3 and is the only earner. Income and expenses have not been modelled (not really needed as well for this purpose); Rs 1 lakh a month is the surplus money.
- Start with Rs 50 lakh invested (all of it cost). SIP is Rs 1 lakh a month, flat. Equity earns 12% a year (monthly rate 1.12^(1/12) - 1, about 0.949%, not 1%).
- Path A - renter rents and keeps investing every month. Path B - buyer buys a Rs 1 crore home at the end of Year 7 (month 84).
- Down payment 20% (Rs 20 lakh) plus 6% costs (Rs 6 lakh) = Rs 26 lakh, paid by selling equities.
- The sale needs to be grossed up so that Rs 26 lakh is left after tax. Tax is 12.5% plus 4% cess (13%) on the gain share of the sale (average cost), after the Rs 1.25 lakh yearly exemption. The tax is gone for good.
- Loan: Rs 80 lakh, 8.5% fixed, 20 years. EMI turns out to be about Rs 69,426 a month.
- New tax regime. No home-loan interest deduction and no 80C, so Path B gets no tax refund. The old regime will be a side test.
- From month 85(after 7 years), Path B invests Rs 1 lakh + rent saved - EMI. The rent saved starts at Rs 25,000 a month (3% of Rs 1 crore a year) and grows 5% a year.
- The home grows 5.5% a year (3% to 10% tested). Upkeep costs are off. The home is held (not sold).
- Inflation is 5% for "today's money" figures. Will be interesting to see net worth at Year 27, before any exit tax. Also at year 30 looks like.
- Liquid-portfolio numbers come from the calculator's own engine. The loan, rent, tax and property arithmetic is added around it.
- The SIP changes once a year, at the start of each plan year, not every month.
1. The Year-7 shock
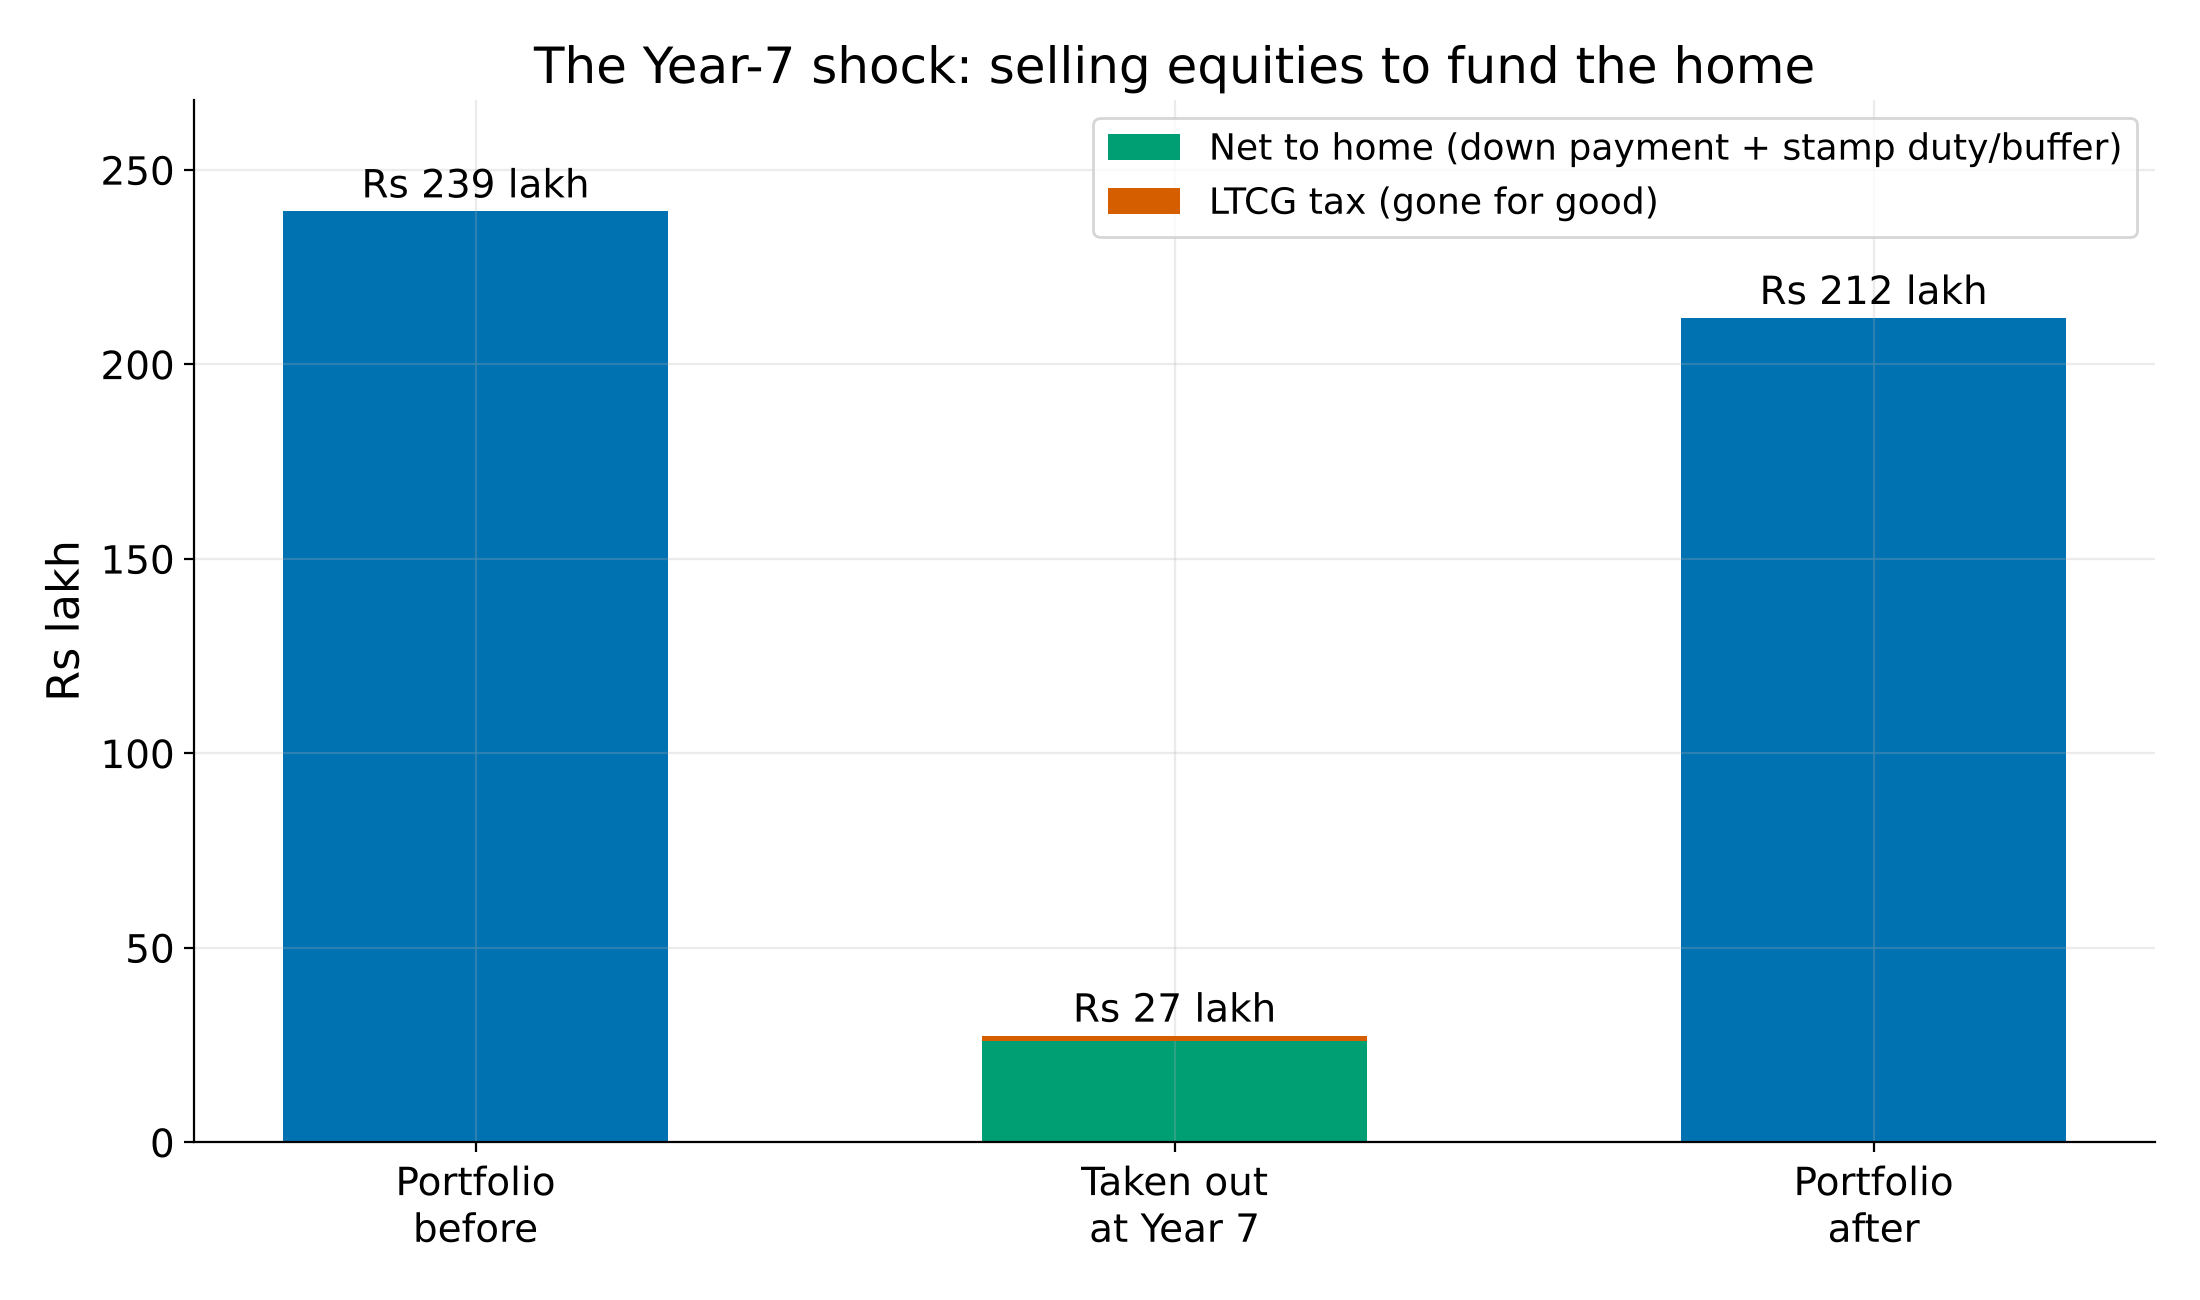
At Year 7, the portfolio is worth Rs 2.393 crore. With cost of Rs 1.34 crore, 44% of it is purely gain.
In order to fund Rs 26 lakh, the buyer must sell Rs 27.41 lakh. Tax incurred being Rs 1.41 lakh. Net portfolio falls to Rs 2.119 crore.
Note: Tax is small amount. But Rs 26 lakh reduction in portfolio is the real loss. Because it stops compounding.
charts/03_year7_shock_data.csv.2. No crossover
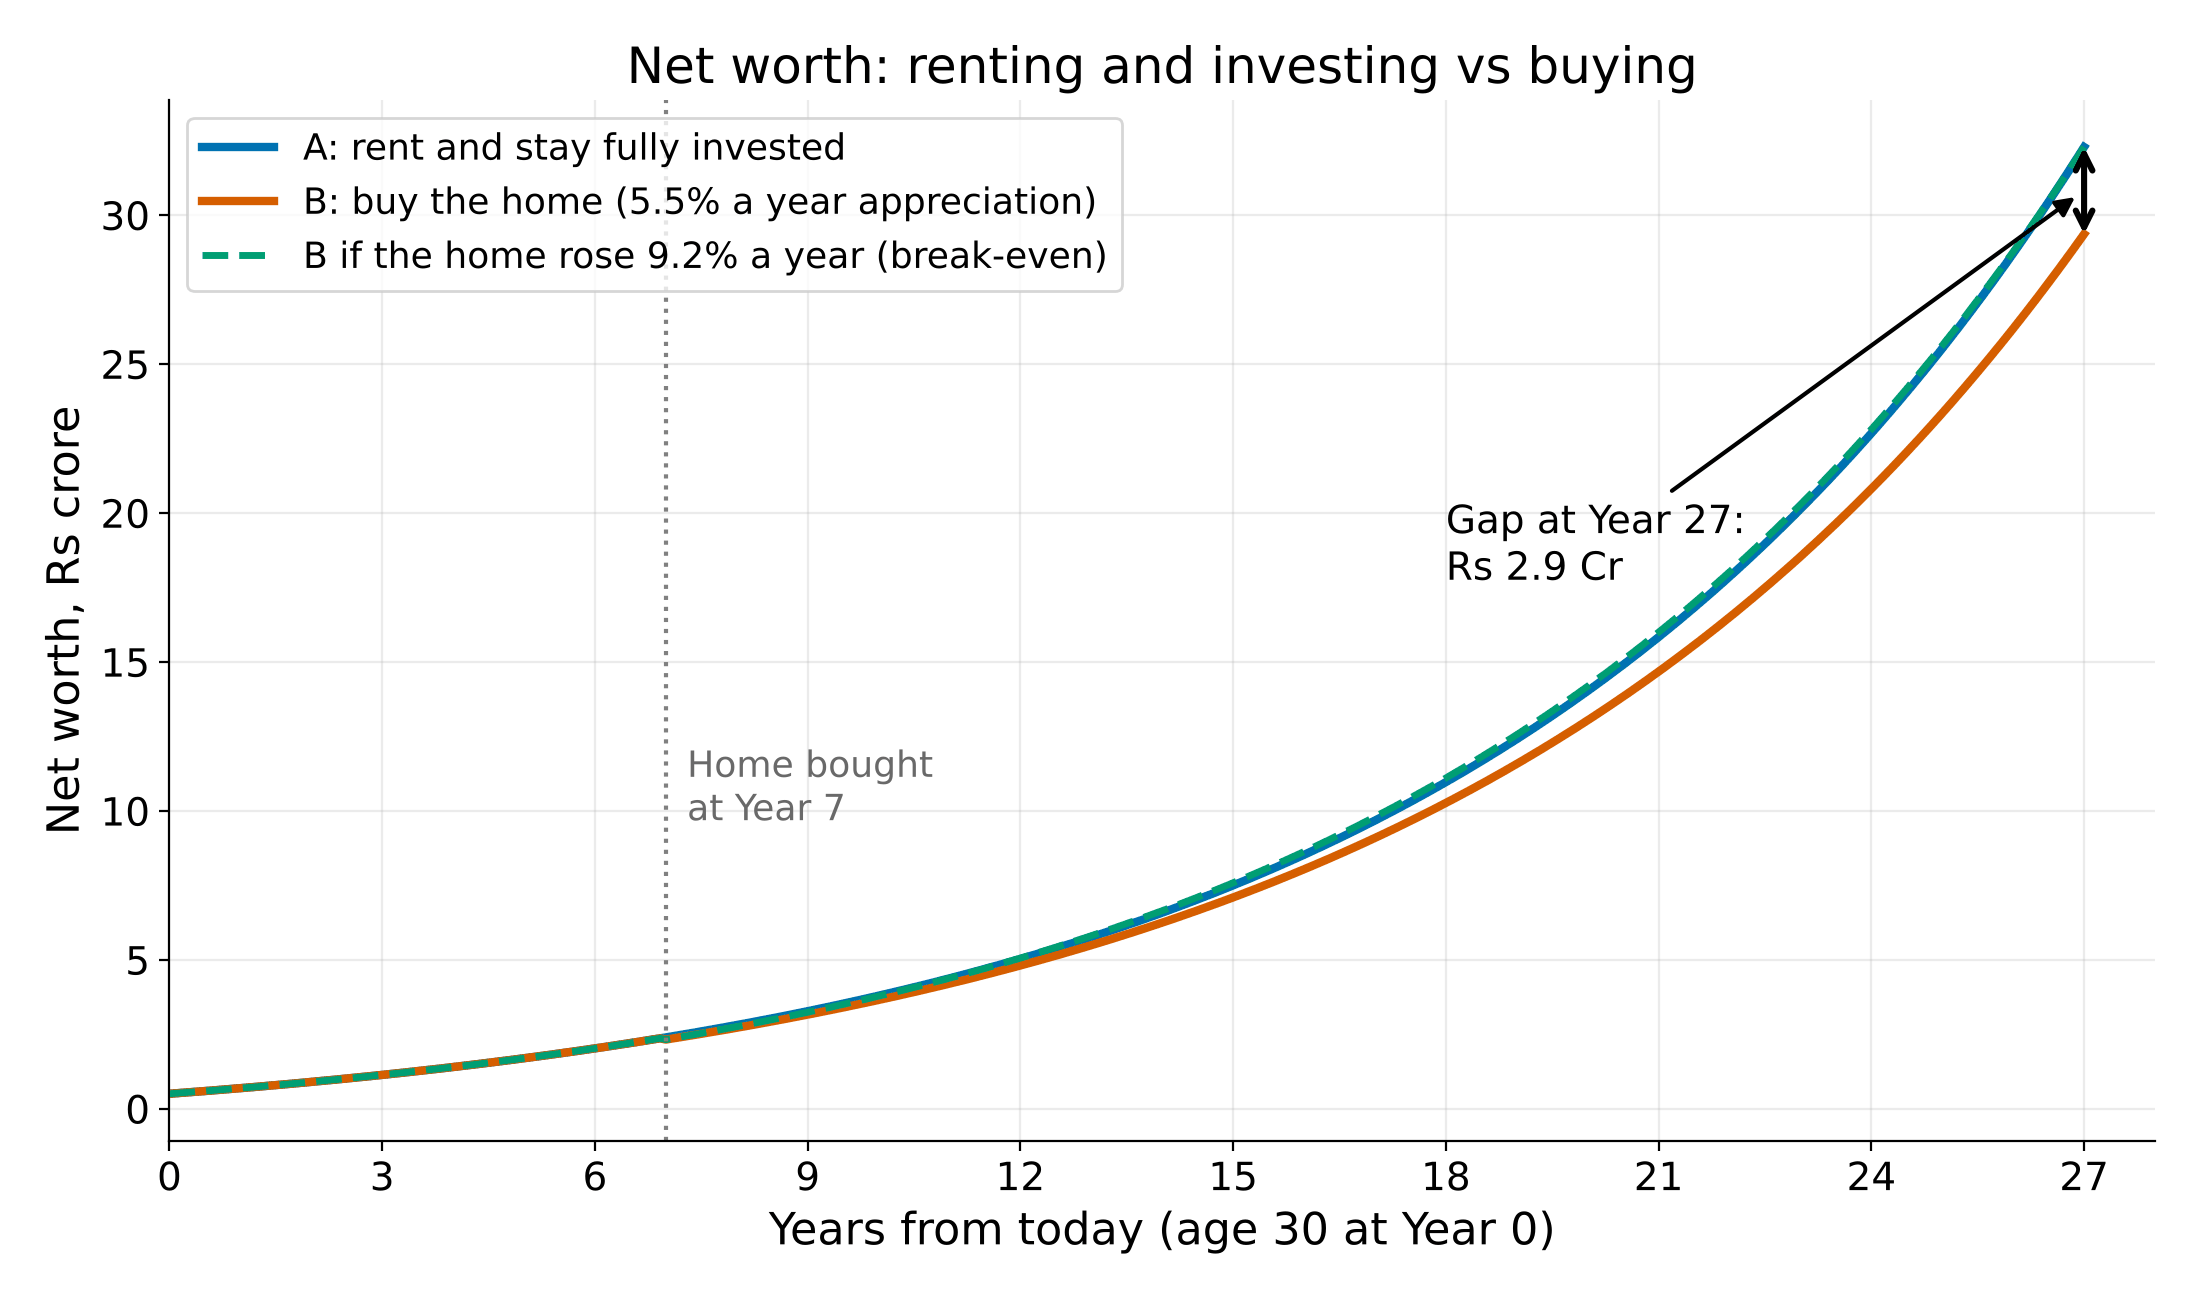
Path A, the renter, ends Year 27 with Rs 32.29 crore. While, Path B, the buyer, ends with Rs 29.36 crore: Rs 26.44 crore in equities + Rs 2.92 crore home (fully repaid loan).
The gap is Rs 2.92 crore. It is narrowest right after the purchase (Rs 7.5 lakh at month 85) and then keeps widening thereafter. At Year 30 the gap grows to Rs 4.48 crore.
But if you look at the investments alone, the gap looks even more larger. Buyer's liquid portfolio is Rs 5.84 crore (18%) less.
charts/01_networth_A_vs_B_data.csv.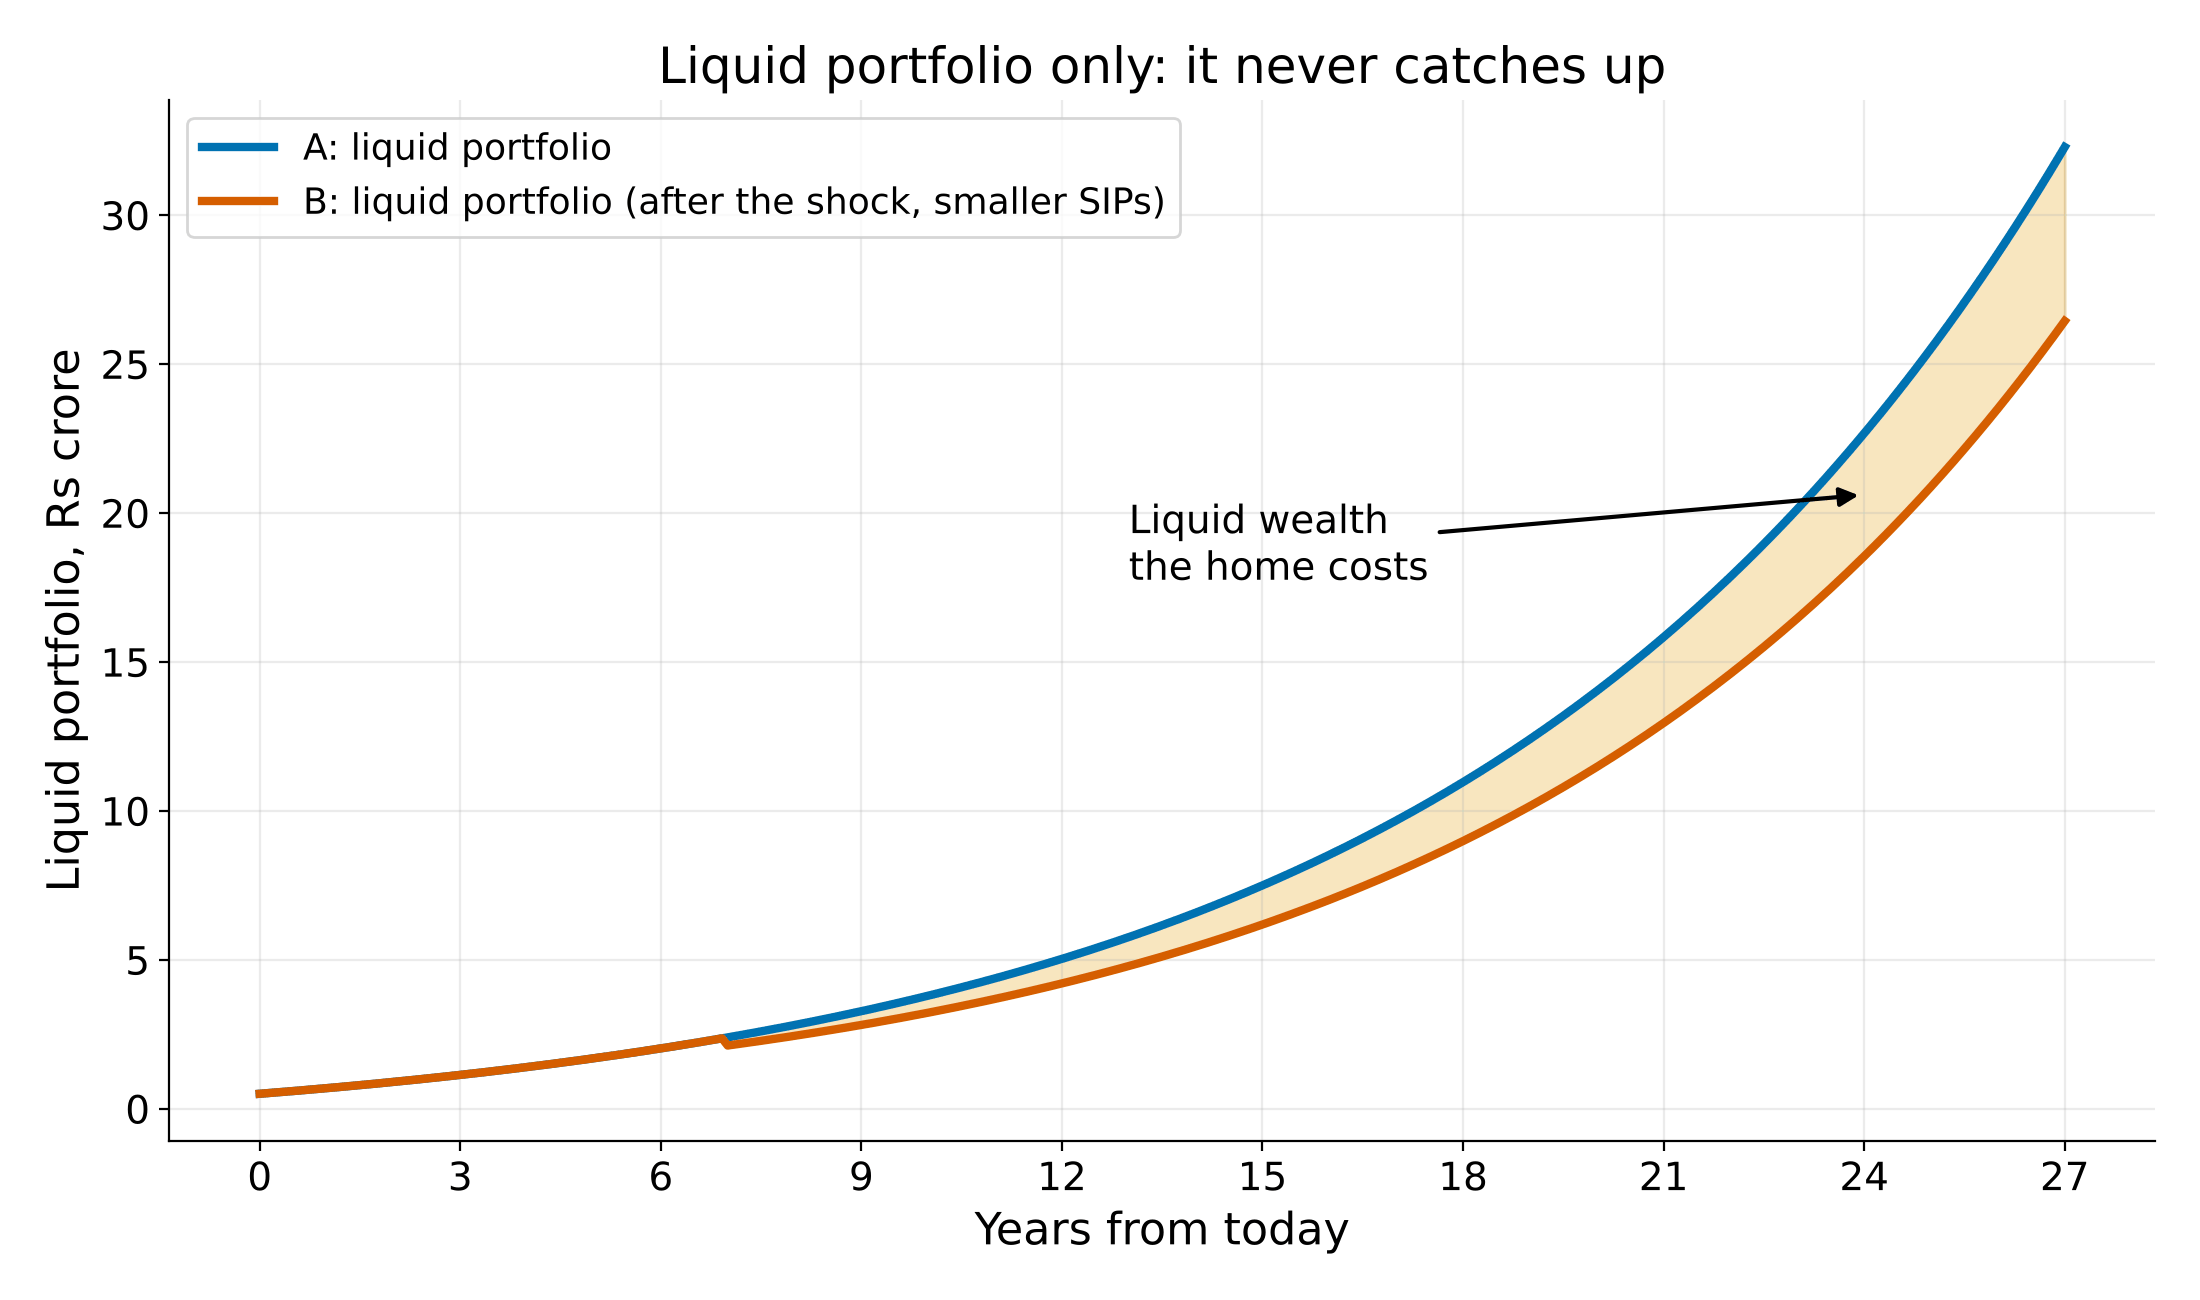
charts/02_liquid_A_vs_B_data.csv.If everything were sold at Year 27, with equity tax, property tax and a 2% sale cost, A has Rs 28.58 crore and B has Rs 26.00 crore. The gap is Rs 2.58 crore.
3. Where the gap comes from
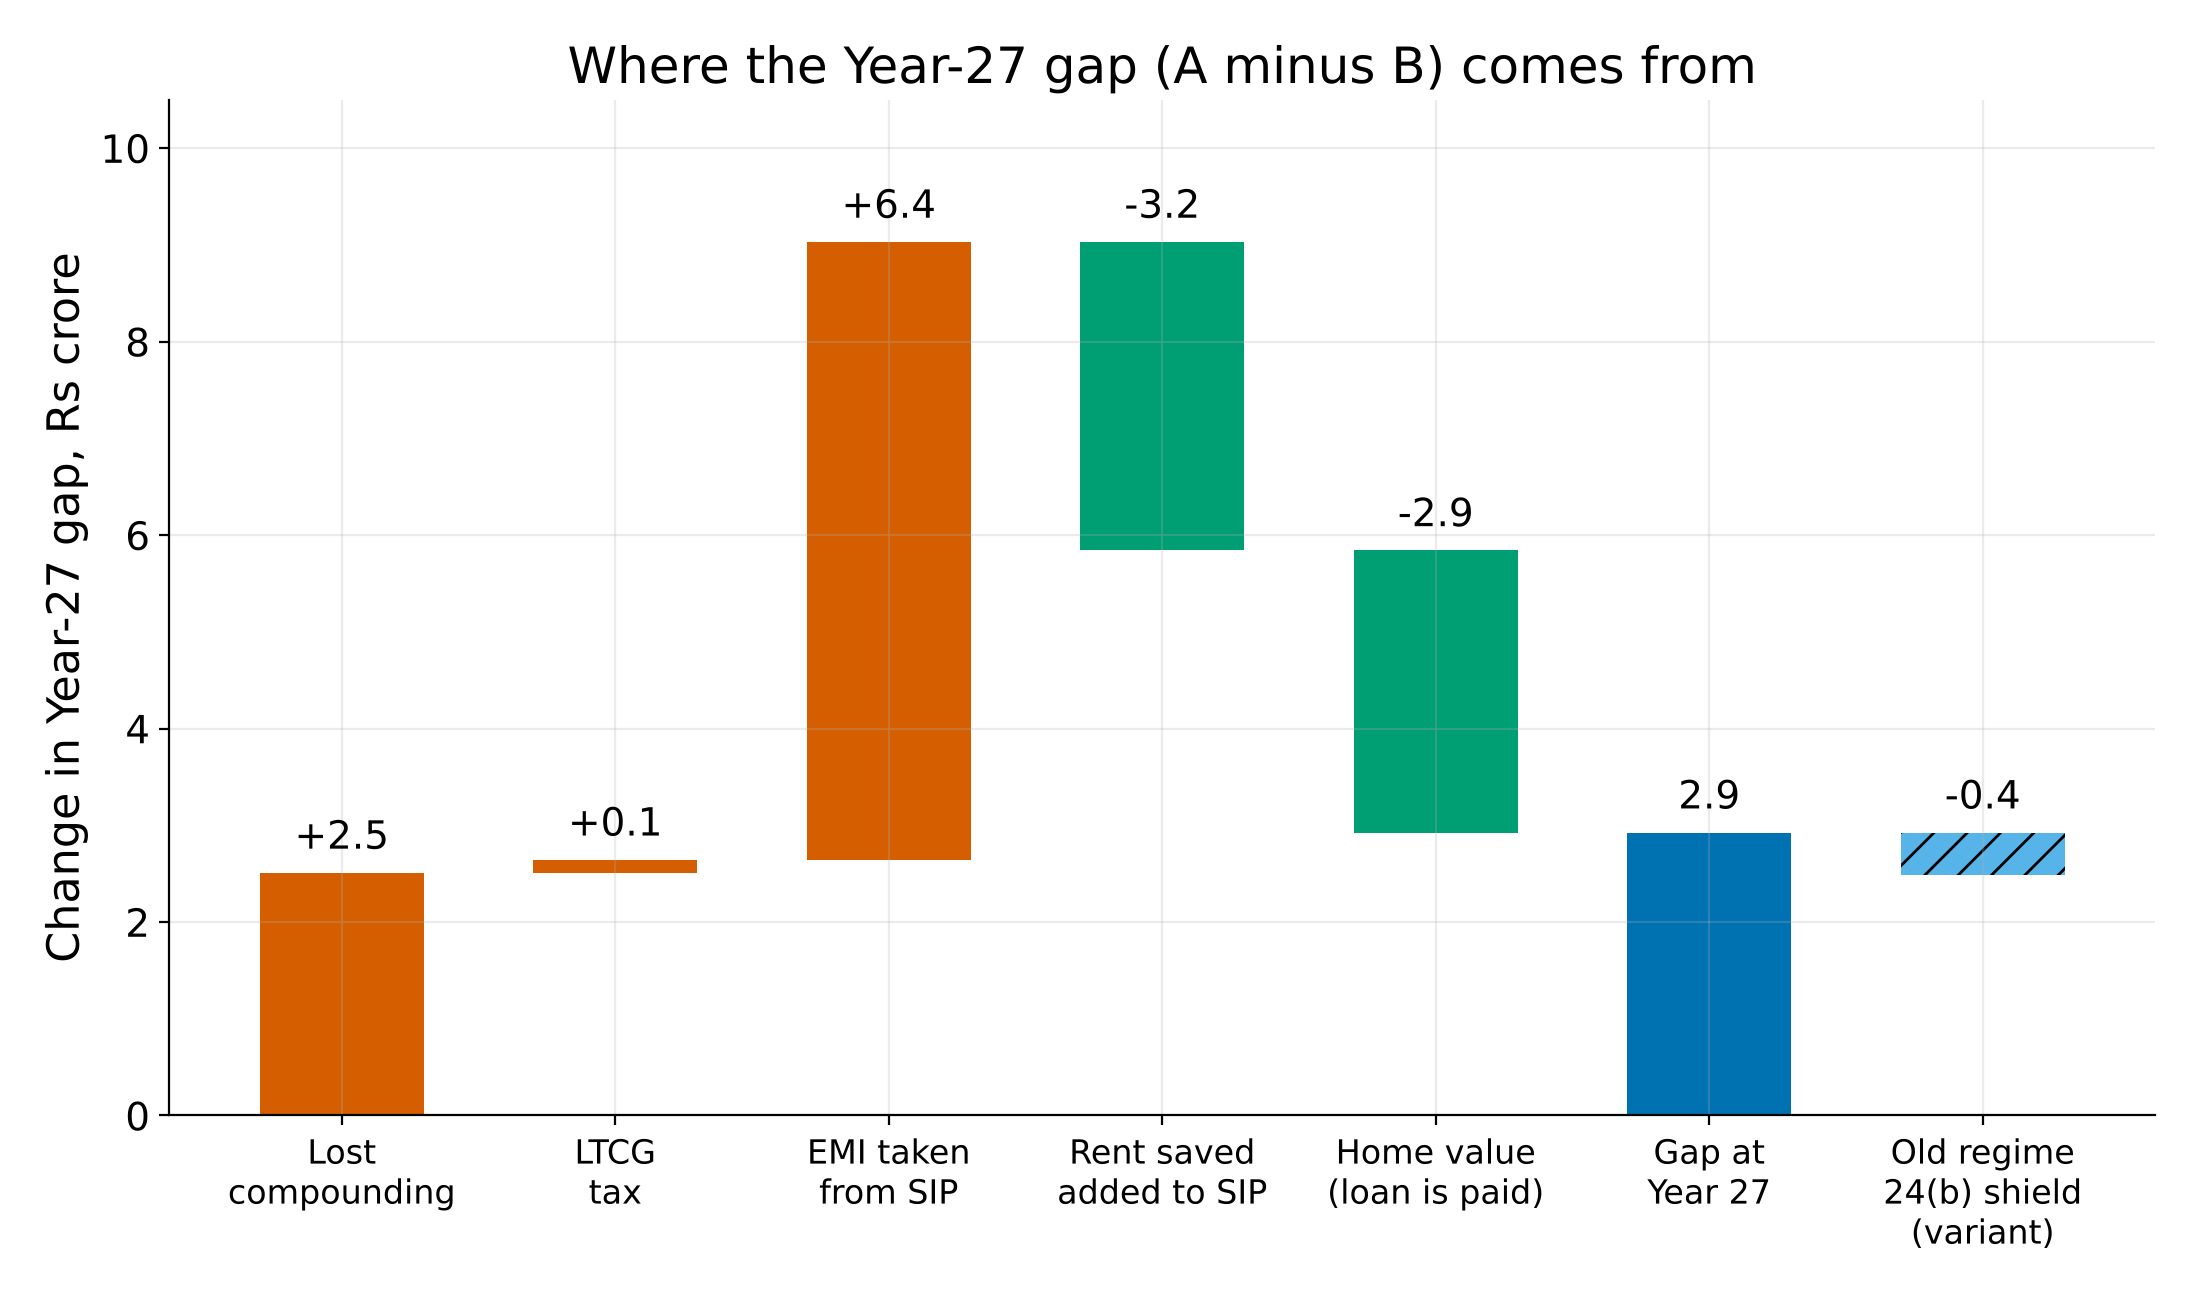
We build Path B one cost at a time, starting from Path A. Each step changes the Year-27 gap (in Rs crore):
| Step | Change in gap |
|---|---|
| Lost compounding on the Rs 26 lakh | +2.51 |
| LTCG tax | +0.14 |
| EMI taken out of the SIP | +6.39 |
| Rent saved, added back to the SIP | -3.19 |
| Home value counted | -2.92 |
| Gap at Year 27 | 2.92 |
The EMI is the big cost. The Rs 69,426 EMI is more than two-thirds of the Rs 1 lakh SIP, so Path B's SIP drops to about Rs 55,600 a month in Year 8. Rent saved and the home's value win back most of it, but not all.
The order of the steps changes the split a little. For example, rent saved looks bigger after the EMI has been taken out.
charts/04_waterfall_year27_gap_data.csv.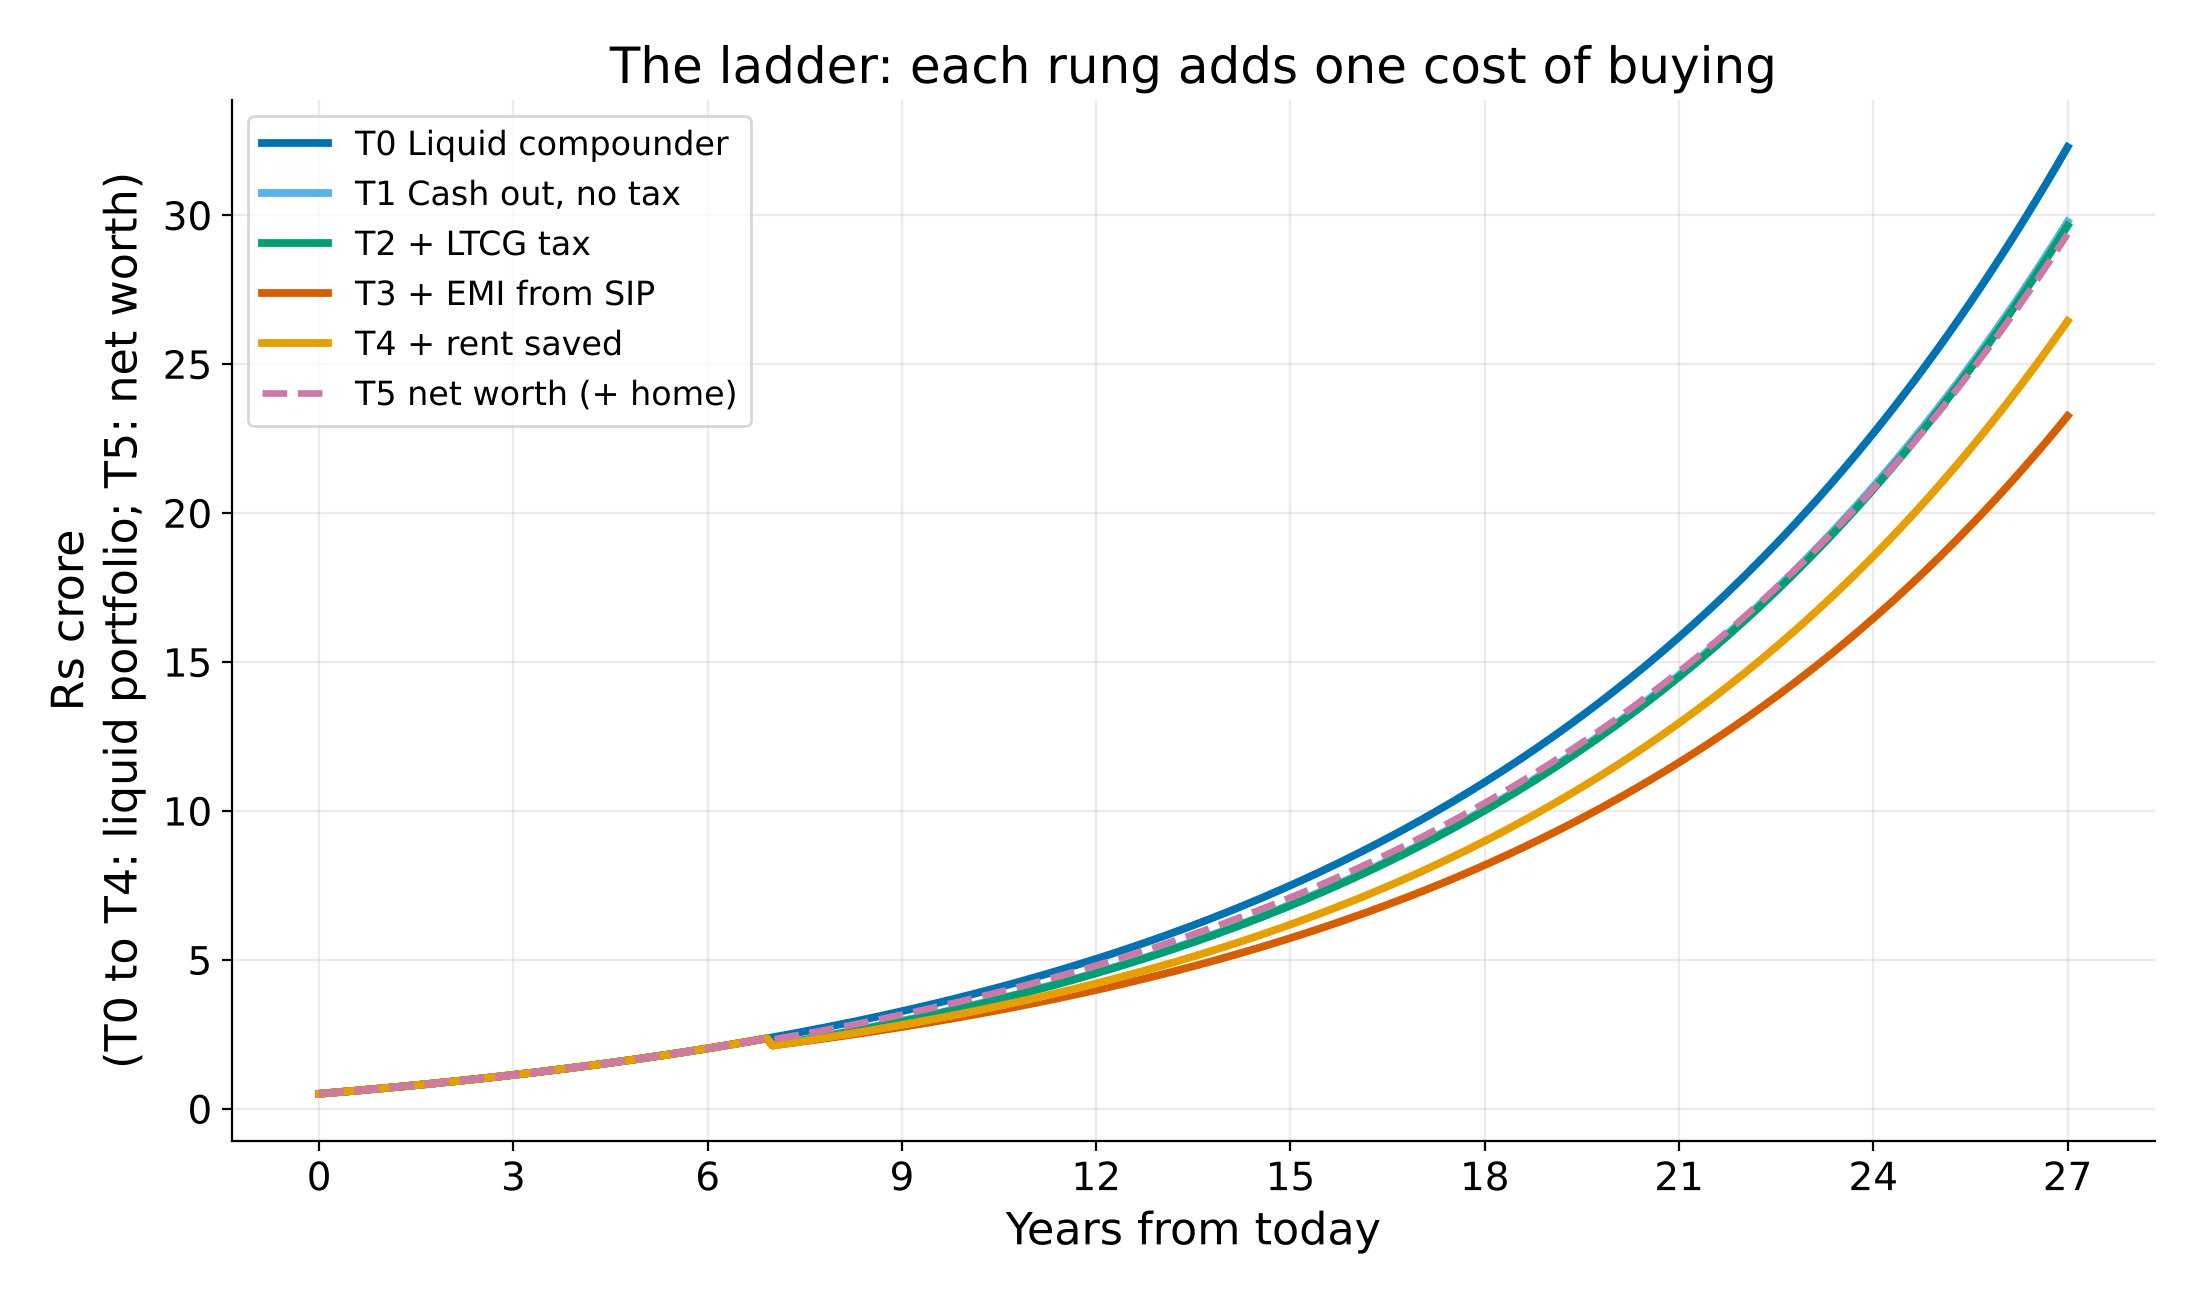
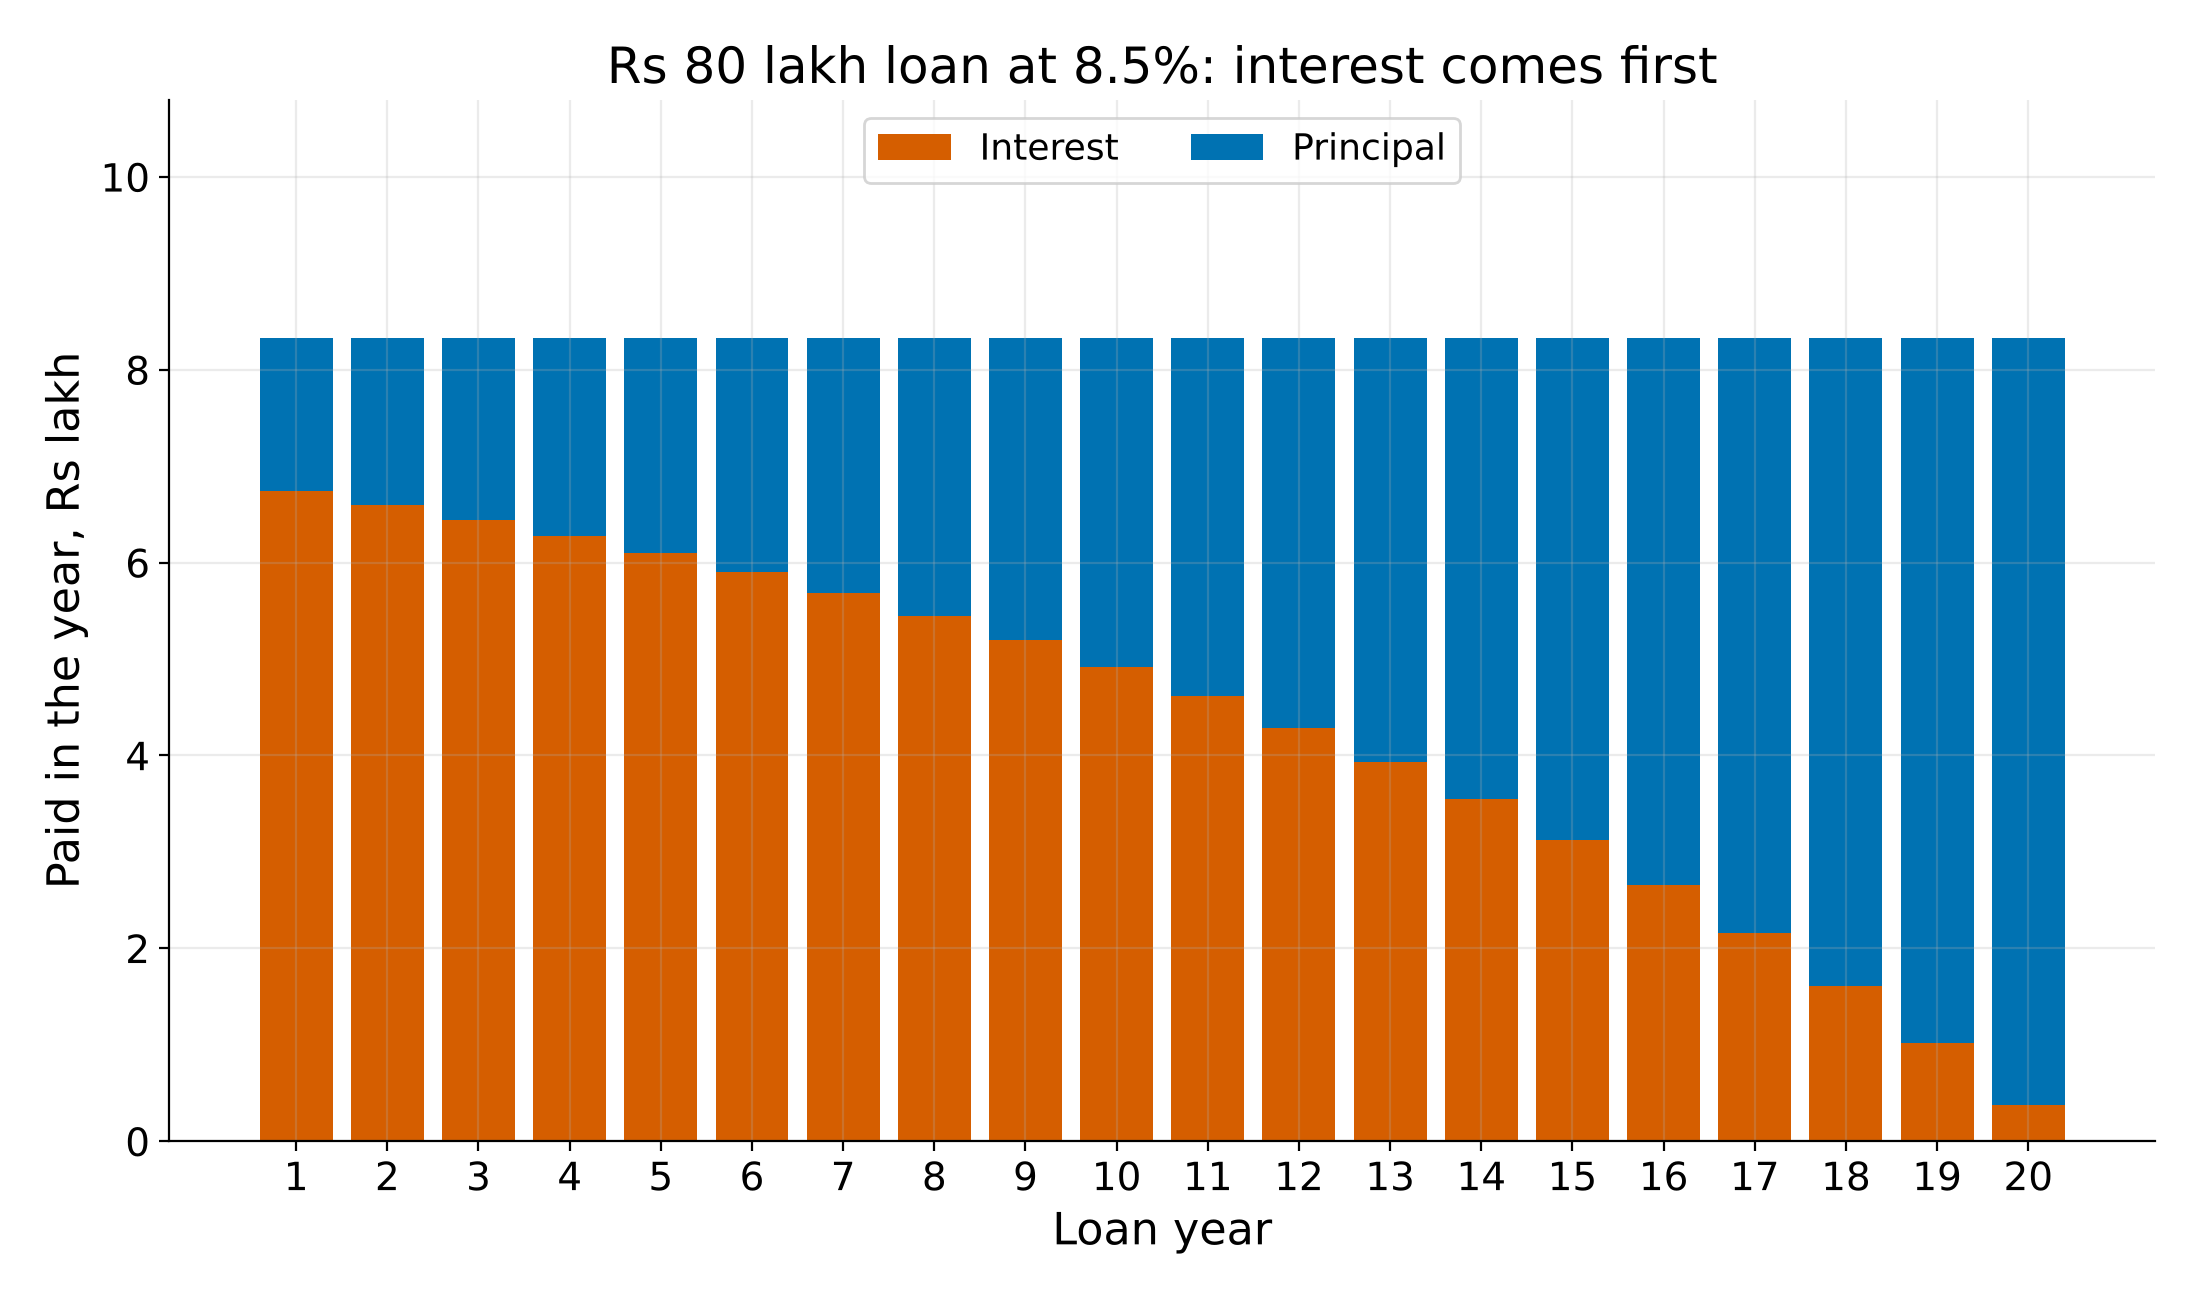
charts/05_ladder_T0_to_T5_data.csv.The EMI hurts most early on because interest comes first. In the first loan year, about Rs 6.7 lakh of the roughly Rs 8.3 lakh paid is interest. Over 20 years the interest adds up to Rs 87 lakh.
charts/06_loan_interest_vs_principal_data.csv.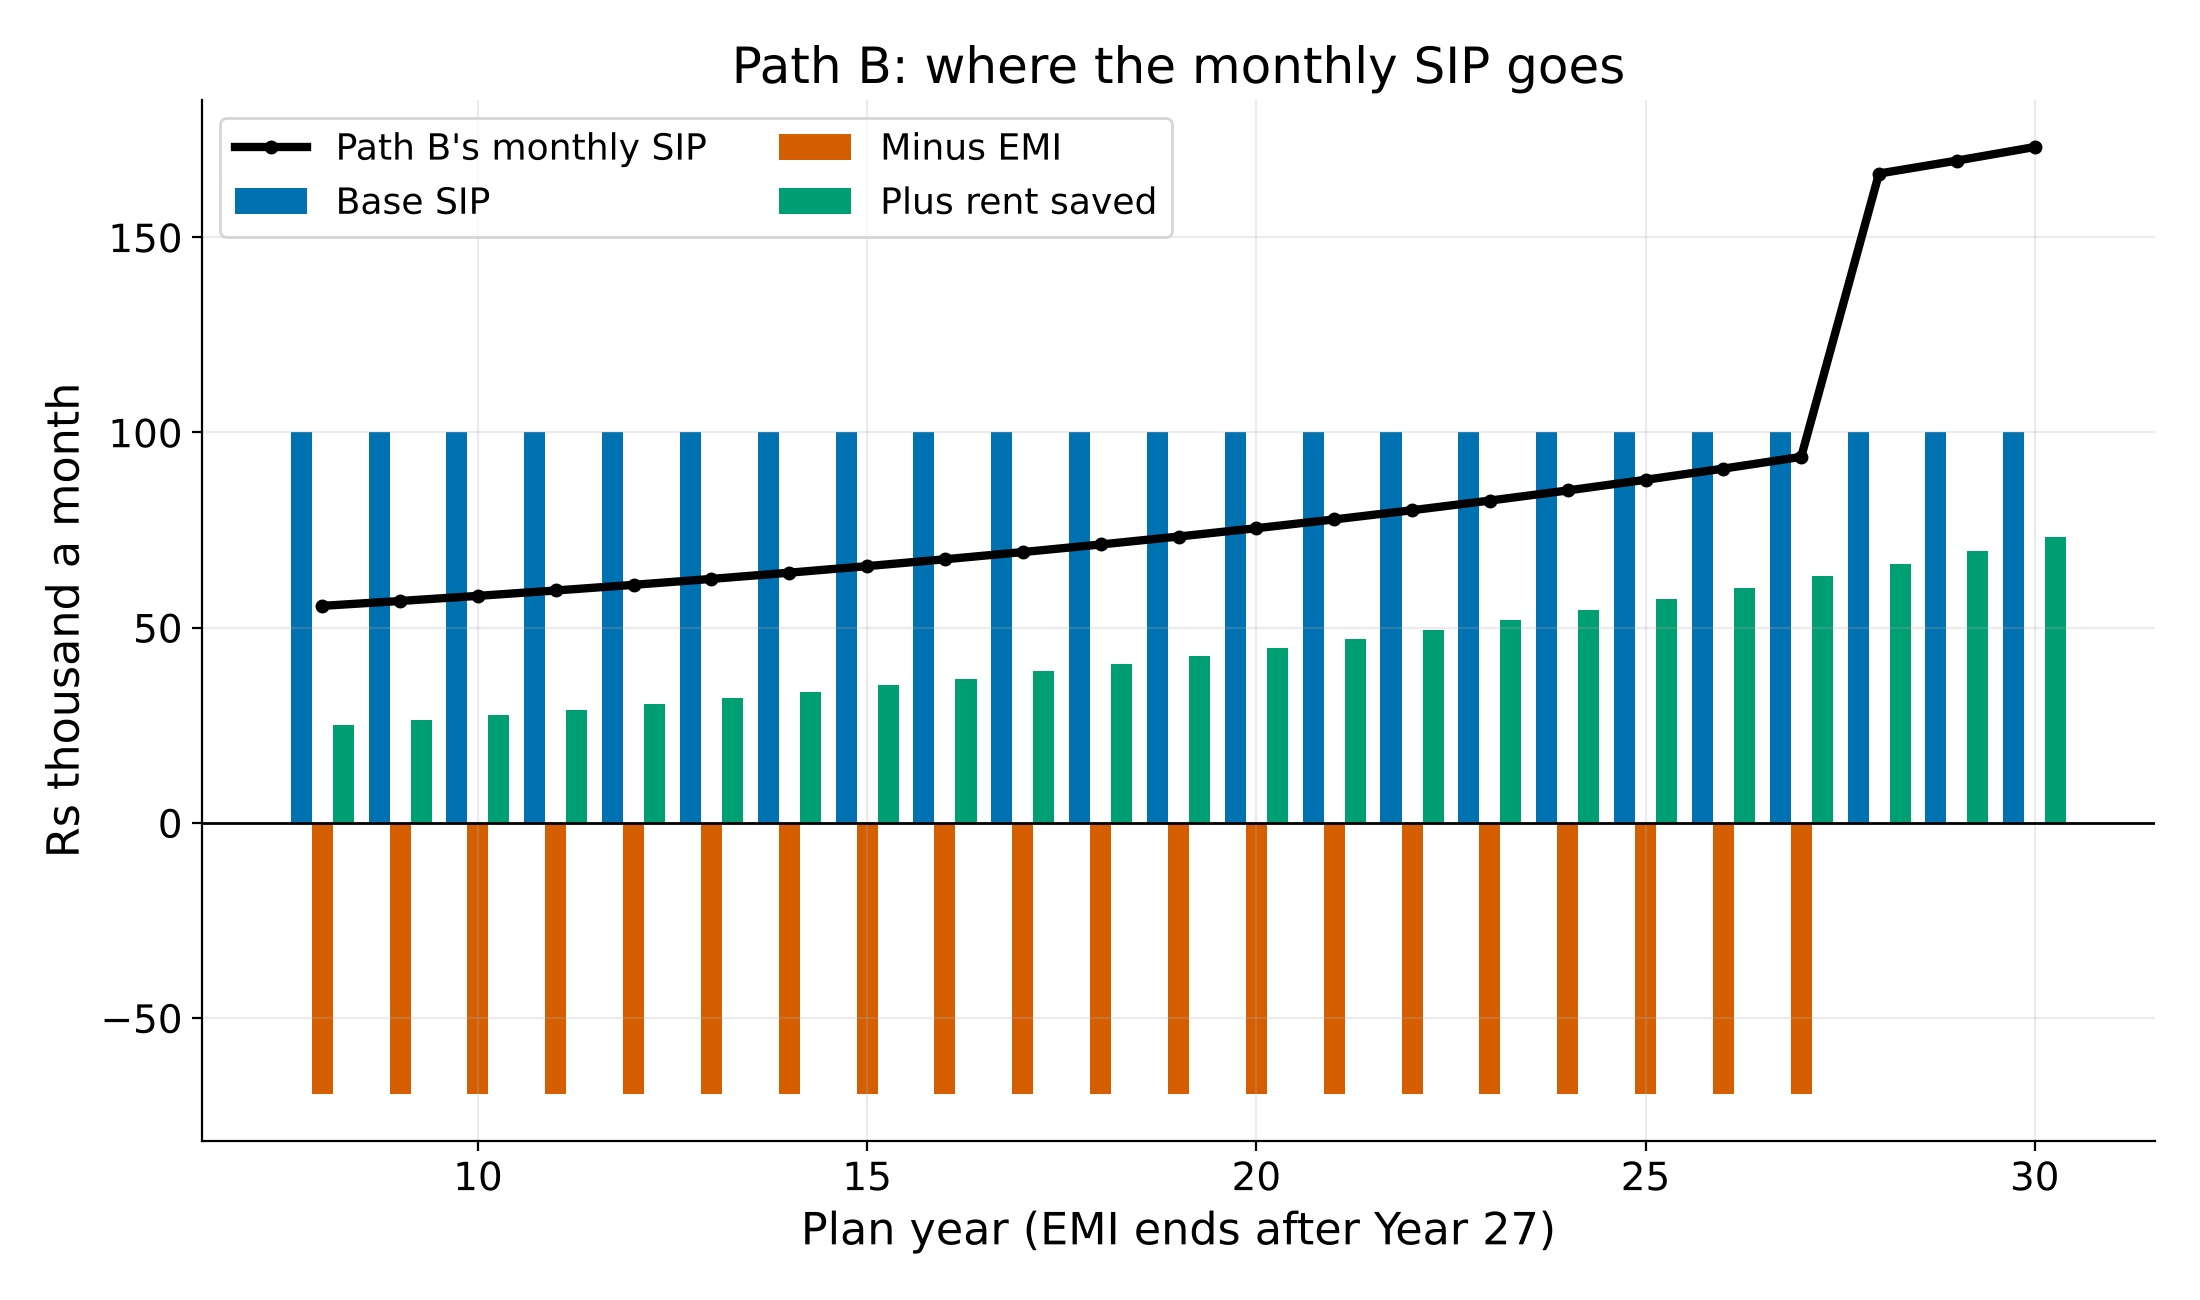
charts/07_pathB_sip_bridge_data.csv.4. How fast must the home grow?
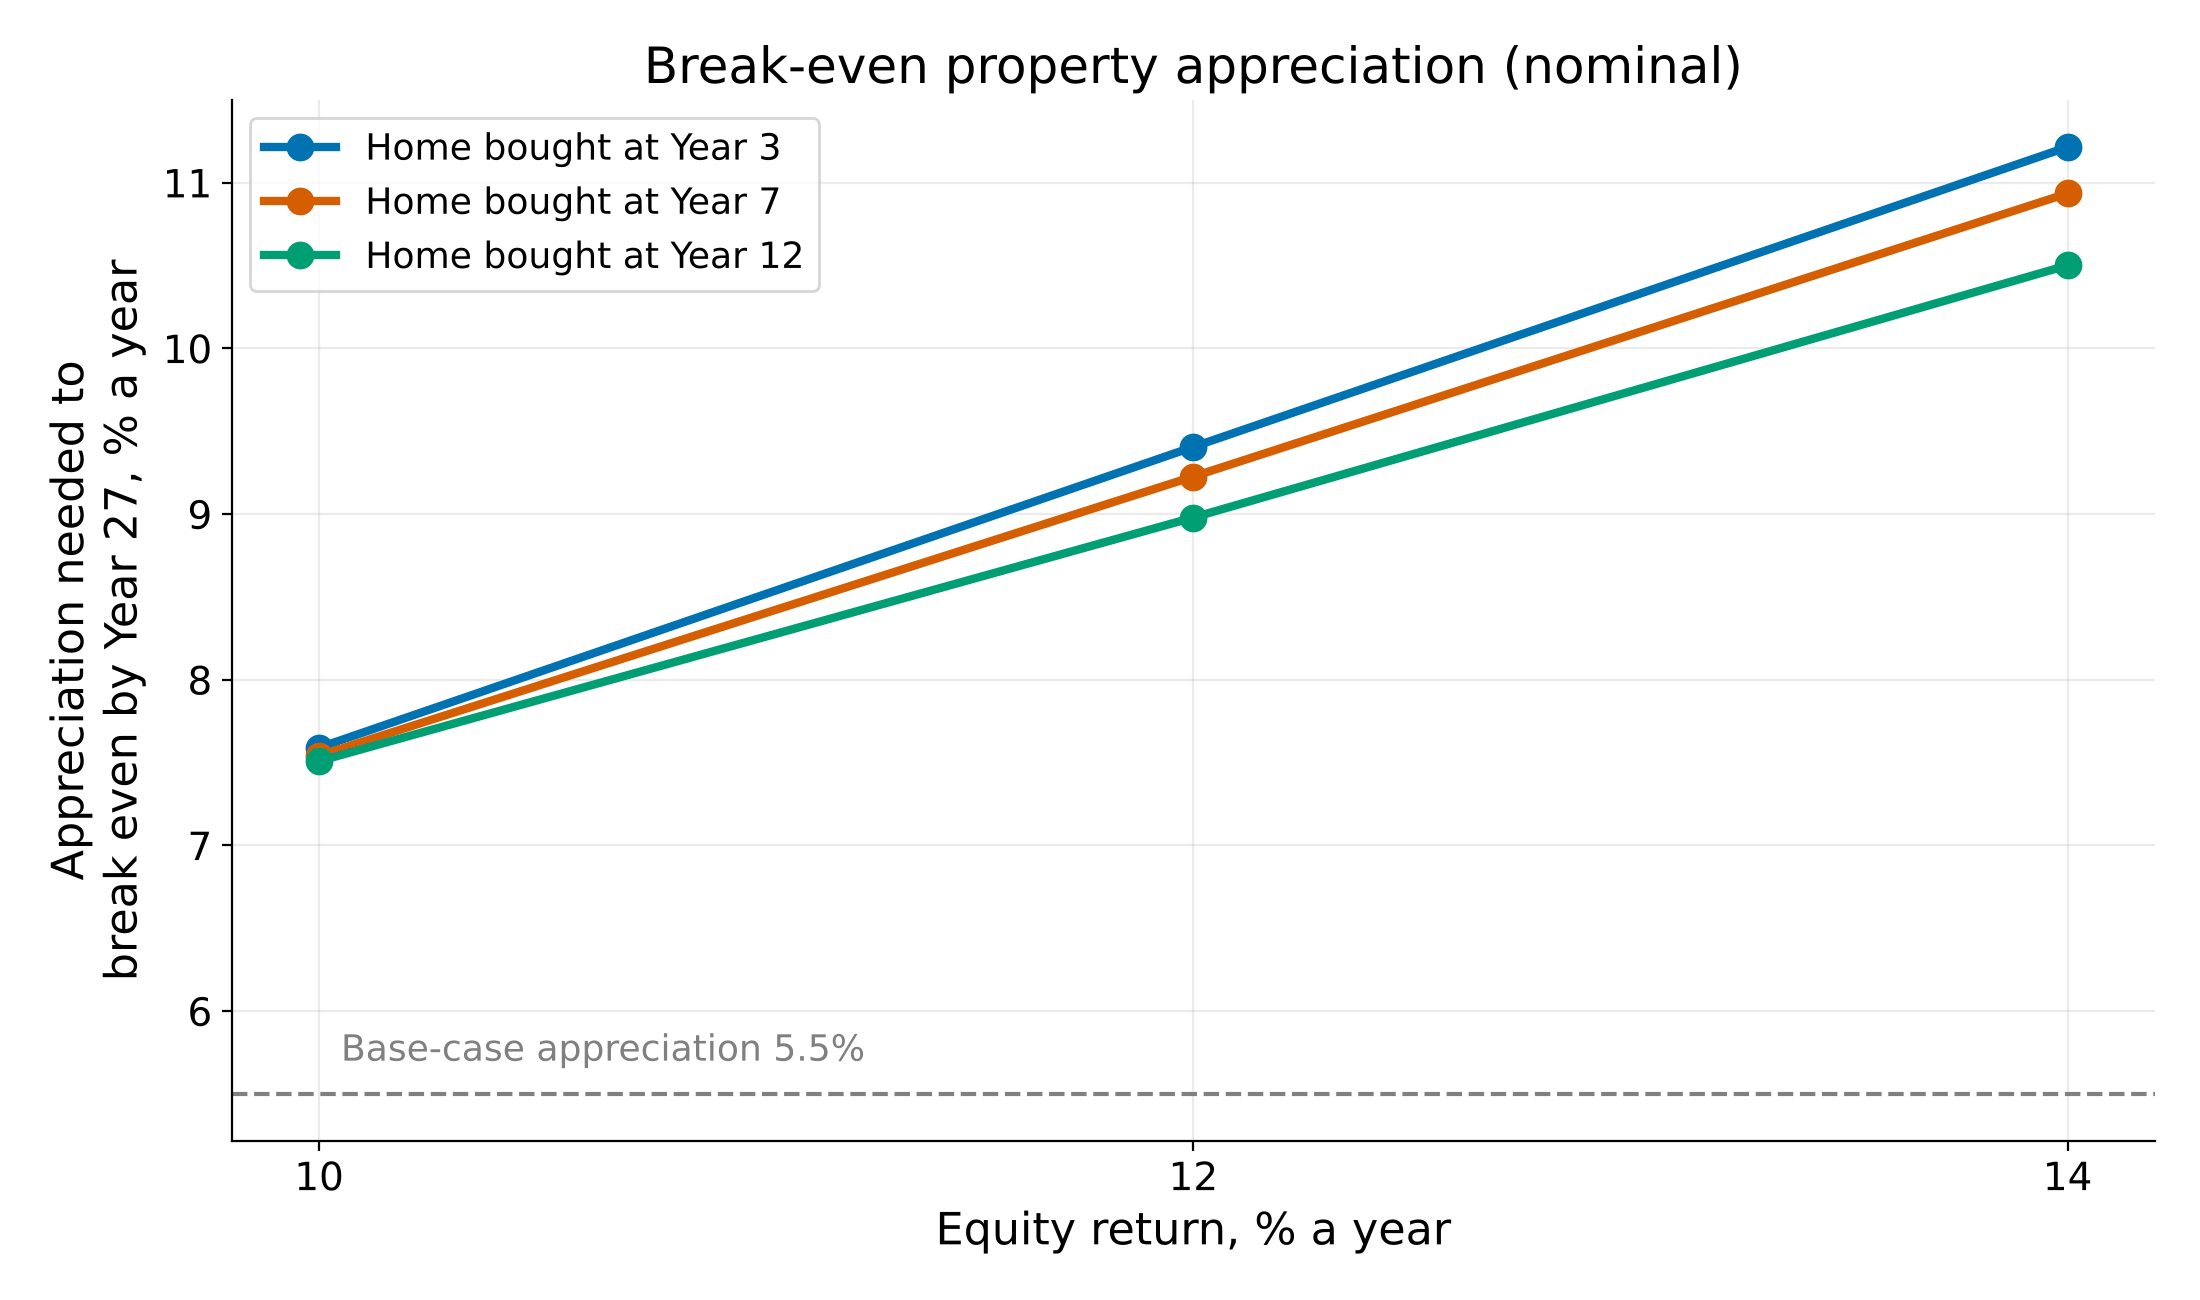
To catch up with the renter by Year 27, the home must grow 9.23% a year (nominal), or 4.02% after 5% inflation. That means a home worth Rs 5.84 crore at Year 27, against Rs 2.92 crore in the base case.
This depends on how well equities do. Higher equity returns make the home's job harder:
| Equity return | Break-even home growth (nominal) | Real |
|---|---|---|
| 10% | 7.54% | 2.42% |
| 12% | 9.23% | 4.02% |
| 14% | 10.94% | 5.65% |
The buying year matters less. At 12% equity, break-even is 9.40% if the home is bought at Year 3, 9.23% at Year 7 and 8.98% at Year 12. In every case we tested, break-even stayed below 11.3%.
charts/08_breakeven_vs_equity_cagr_data.csv.The heat map shows the Year-27 gap across both rates. At 12% equity the buyer comes out ahead only at 10% home growth (Rs 0.89 crore ahead, from month 116). At 8% equity the buyer is ahead from about 6% growth.
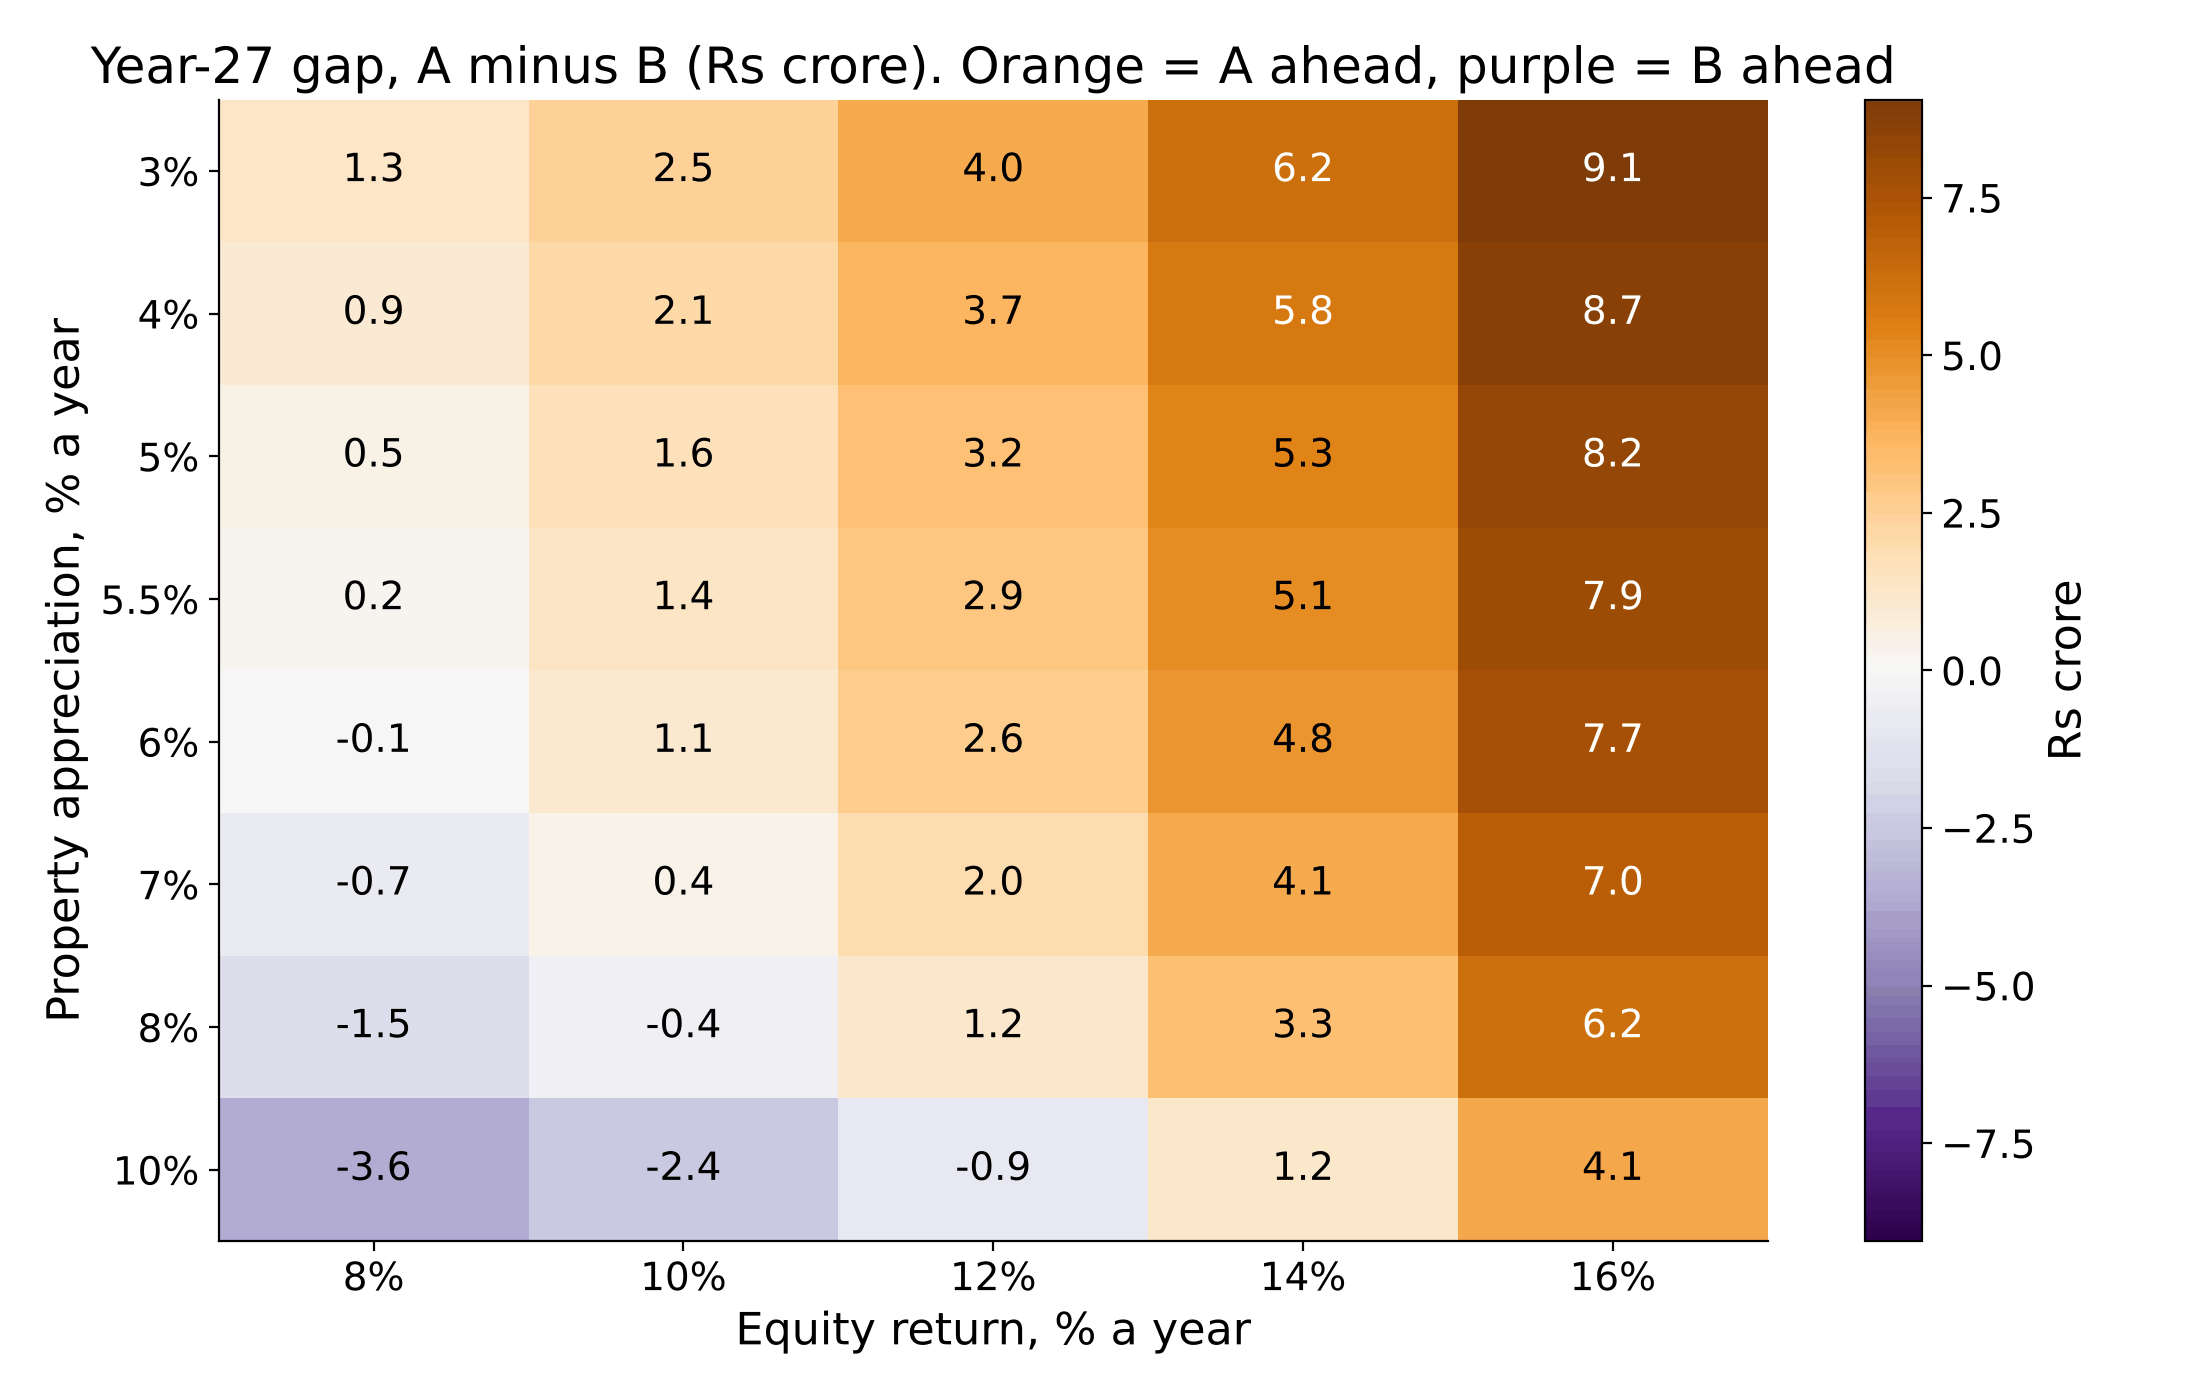
charts/09_heatmap_gap_year27_data.csv.Year-27 gap by home growth, at 12% equity (Rs crore):
| Home growth | 3% | 4% | 5% | 6% | 7% | 8% | 10% |
|---|---|---|---|---|---|---|---|
| Gap | 4.04 | 3.65 | 3.19 | 2.63 | 1.97 | 1.18 | -0.89 |
5. Retirement
Both paths pass their FIRE numbers well before Year 27, so the gap measures wealth, not a failed plan.
Here the renter's FIRE number includes rent, and the buyer's does not. Spending is Rs 1.5 lakh a month in today's money, growing 5% a year.
At Year 27 (age 57), income from the liquid portfolio at a 3.5% withdrawal rate:
- Path A: Rs 9.4 lakh a month (Rs 2.52 lakh in today's money).
- Path B: Rs 7.7 lakh a month (Rs 2.07 lakh in today's money).
At 4%, it is Rs 10.8 lakh for A and Rs 8.8 lakh for B. At Year 30 the portfolios are Rs 45.8 crore (A) and Rs 37.9 crore (B).
The 3.5% FIRE number at Year 27 is Rs 19.2 crore for A and Rs 16.9 crore for B. Both portfolios are 1.6 to 1.9 times those numbers.
Age at which each path first reaches FIRE:
| Withdrawal rate | Path A | Path B | Delay from buying |
|---|---|---|---|
| 3.5% | 49.7 | 50.7 | 1.0 year |
| 4% | 47.9 | 48.8 | 0.9 year |
6. What changes the answer
A rising SIP changes the picture most. If the SIP grows 8% a year in both paths, the EMI stays fixed while income-linked saving grows. The gap is still Rs 2.91 crore, but it is only 5.5% of A's net worth (Rs 53.2 crore against Rs 50.3 crore). The FIRE delay shrinks to 0.1 to 0.2 years.
Other changes, with the Year-27 gap (base case: Rs 2.92 crore):
| Change | Gap (Rs crore) | Break-even growth |
|---|---|---|
| Equity return 10% | 1.36 | 7.54% |
| Equity return 14% | 5.05 | 10.94% |
| Loan rate 7.5% | 2.47 | |
| Loan rate 9.5% | 3.40 | |
| Buffer 5% | 2.82 | |
| Buffer 7% | 3.03 | |
| Down payment 30% | 3.15 | |
| Upkeep costs on (0.5% a year) | 3.46 | 9.70% |
| Old regime, Section 24(b) deduction | 2.48 | 8.80% |
| Old regime, with 80C as well | 2.15 | 8.45% |
Three points stand out:
- Higher equity returns punish buying. The gap grows faster than the home does.
- Upkeep costs add about Rs 0.5 crore to the gap.
- The old-regime deduction helps, but it does not close the gap.
Limits of this study
- New tax regime is assumed. There is no home-loan interest deduction and no refund for Path B. The old regime is shown only as a variant.
- Flat SIP all through. The base case does not step up the SIP. Section 6 proves that this matters a lot. (Our calculator needs to be enhanced for this).
- No home upkeep costs accounted in the buyer's case. Maintenance and property tax are real costs.
- Rent and growth are assumptions. Rent saved is 3% of price a year, growing 5%. The home grows 5.5% a year. Real homes vary widely by city and year.
- Path A is too ideal. It assumes the full surplus is invested every month for 27 years and that 12% holds, with no market swings.
- The home is never sold in the headline. The "everything sold" view uses a 2% sale cost and 13% tax with no indexation.
- Not modelled: income and job risk, prepayment of the loan, brokerage and exit loads, Section 54 relief, interest-rate resets, and market volatility.
- Calculator coverage. The calculator in it's current form (as on 9-Oct-2026), has no fields for a loan, a home, net worth and step-up SIP. Those parts are arithmetic around its engine. For now, the liquid-portfolio numbers in this paper were cross verified using Python scripts. The numbers show better than 0.001%.
- Annual steps. The SIP and rent change once a year, and the purchase falls on the year boundary.
Try this scenario yourself
These links load the calculator with the same inputs. (Links marked Pro use Pro features.)
- Path A, the renter. Loads Rs 50 lakh start, Rs 1 lakh SIP, 12%, 27 years. Year-27 corpus: Rs 32.29 crore. Open
- Path A with the Year-7 sale. Same plan with Rs 19.48 lakh (today's money) taken out in Year 8. After inflation that is the Rs 27.41 lakh sale. Year-27 corpus: Rs 29.64 crore. This shows the shock before the EMI. Open
- Path B's liquid portfolio (approximate, Pro). Adds the reduced SIP, held in two-year blocks because the page allows 10 schedule rows. It matches the exact base-case portfolio to 0.02%. Year-27 corpus: about Rs 26.44 crore. Open
- Renter with an 8% yearly SIP step-up (Pro). Year-27 corpus: Rs 53.23 crore, in line with the step-up result above. Open
- Renter at 10% equity. Year-27 corpus: Rs 21.86 crore. Open
- Both paths on one graph, with Compare (Pro). Open link 3, open "Saved plans (Pro)", type the name Path B and press Save. Then open link 1. Under "Compare (Pro)", press "Pin this plan (create a baseline plan to compare)". Now pick Path B in the Saved plans list and press Open. The chart draws Path A as a dashed line (pinned) and Path B as the solid line, and a table under the answer sets the two side by side: Rs 32.29 crore against about Rs 26.45 crore at Year 27, a gap of Rs 5.84 crore.
What the links cannot do. The loan, the home's value and net worth are not calculator fields yet, so they cannot be loaded. We used our internal scripts to model this part for now. Compare links 1 to 3 to see the lost compounding and the SIP cut. Then change the equity return, the SIP or the step-up to test your own case.
This paper is for education, not personal financial advice. Results come from model assumptions, not forecasts.