The Hidden Drag of Forex and Compliance for Indian Investors
A finfire.org research paper. Not investment advice.
Many Indians now invest in US shares. The returns look great on paper. But money has to cross the border, and that crossing has friction and a cost. In this paper we stress-test foreign equity investing from the point of view of a typical Indian resident investor.
Our question: If you invest ₹12 lakh a year in US shares for 15 years, how much of the "expected" corpus (your final pot of money) do forex and compliance rules take away?
The short version
- Expected result: ₹548.06 lakh (₹5.48 crore). This is Path A, as if there were no cross-border friction. The ideal case.
- After three real-world frictions: ₹514.19 lakh (₹5.14 crore). The gap is ₹33.87 lakh, or 6.18%. (This counts only the US tax on dividends. See the next point.)
- The biggest leak is not the remittance tax. It is the US tax on dividends: ₹23.55 lakh. The forex spread costs ₹8.22 lakh. The remittance tax (TCS) is squared off when you file your tax return, but the wait for that refund costs ₹2.10 lakh.
- The dividend leak is mostly avoidable, if you claim the foreign tax credit. India taxes dividends at 31.2% anyway. Take a domestic investor who earns the same return and pays that tax. Offshore ends 1.83% below them (₹8.70 lakh) if you claim the credit. It ends 5.91% below (₹28.11 lakh) if you don't. Claiming is worth it since it's ₹19.40 lakh.
- Our first shortcut overstated the damage. It gave a gap of 8.38% (₹45.90 lakh). The explicit model gives 6.18%.
- Tax at sale is a separate, bigger number. After it, the gap to Path A is 13.85%. But an Indian investor pays tax at sale anyway. Against Path A taxed the same way, the gap is 5.95%. The fairest comparison is the domestic investor in the point above.
- The gap widens further. It grows every year in rupees. In percent terms, the dividend tax is the only reason it widens.
How we ran it
We considered multiple paths simulating the journey, and ran every path through the finfire calculator. The calculator currently cannot do two things: hold cash that is locked and refunded later, and tax you at sale. We worked those two out separately with a Python script (until finfire gets this enhancement). A second script re-did the maths from scratch. It matched the calculator to the rupee for Paths A and B, and for the dividend paths E0 to E4 (described below).
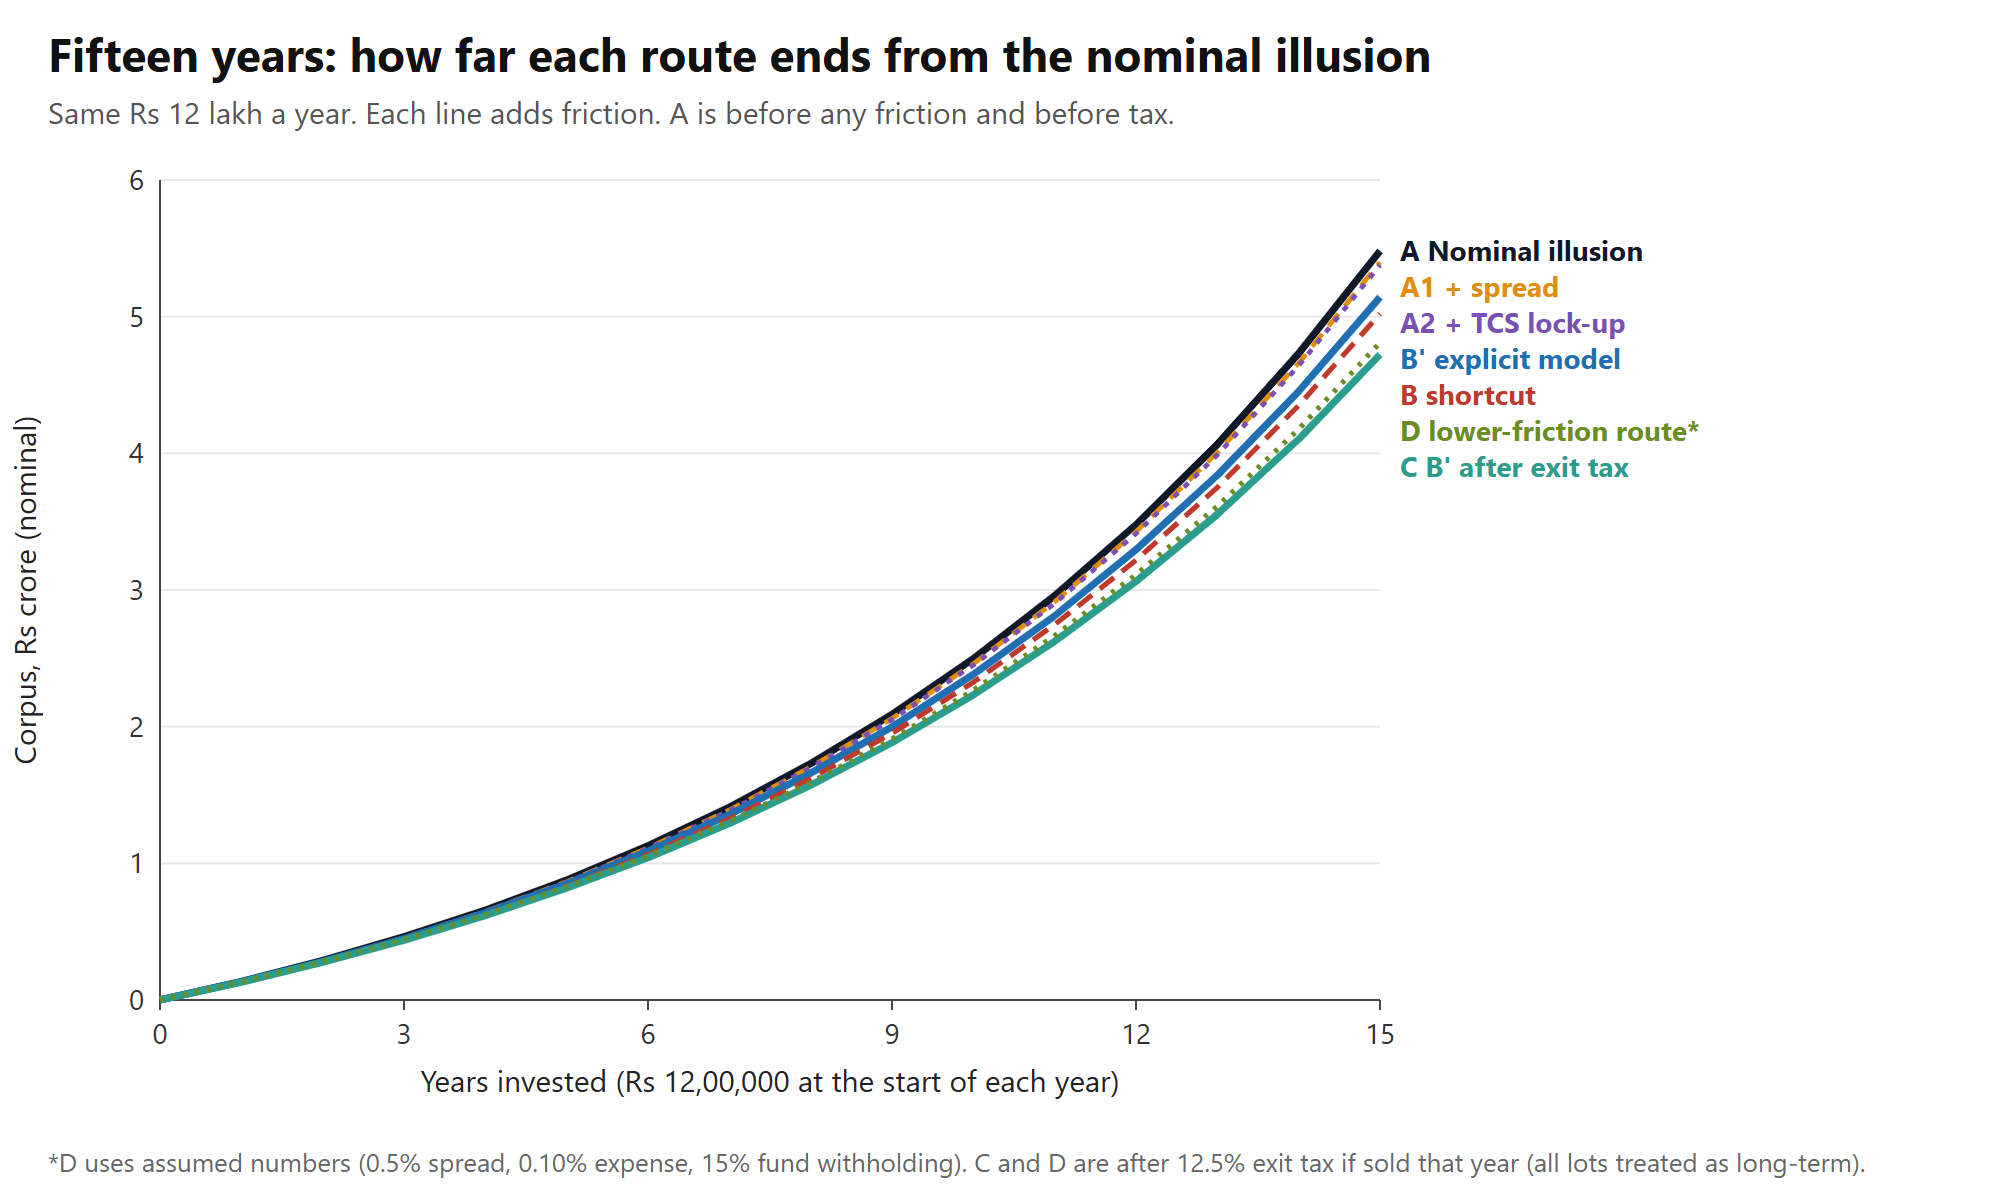
Assumptions & Method. We invest Rs 12 lakh at the start of each year for 15 years. To keep things simple, there is no other resident income. Shares grow 10% a year and the rupee falls 3%, so we use 13% (for simplicity; 13.3% changes nothing important). Each cross-border transfer loses 1.5% to the forex spread. Above Rs 10 lakh a year, 20% tax is collected at source (TCS); we assume it comes back after 12 months and count only the growth lost while it waits. The US keeps 25% of dividends, about 0.5% a year. India also taxes dividends, at 31.2% for the top tax bracket. We show one case where the US tax is credited against it and one where it is not. Long-term gains are taxed at sale at 12.5%. Every figure comes from the finfire calculator or a separate check. Illustrative, not advice.
Two more points about the setup.
- 13% is a simplification. Growth of 10% and a rupee fall of 3% really multiply to 13.3%. We ran that too. The gap to Path A hardly moves: 6.19% instead of 6.18%.
- The TCS lock-up is modelled outside the finfire calculator. The calculator shows TCS but does not take it off or refund it (future enhancement).
The paths
Every path starts from the same base: ₹12,00,000 a year, put in on day one of each year, for 15 years.
| Path | What it adds |
|---|---|
| A | Nothing. 13% a year. The "nominal illusion", zero cross-border friction. |
| A1 | A, plus the 1.5% forex spread. Only ₹11,82,000 reaches the broker in US each year. |
| A2 | A1, plus the cost of waiting for the TCS refund (12 months). |
| B′ (B-prime) | A2, plus the 25% US tax on dividends (return drops from 13% to 12.5%). It counts only the US tax. India's own tax on dividends comes in the E path below. This is our main "real-world" path. |
| B | The earlier shortcut: a flat ₹11,50,000 a year at 12.5%. |
| C | B′, followed by Indian tax when you sell. |
| D | An illustrative lower-cost route. Every number is an assumption. |
| E0 to E4 | The dividend double-tax run: a domestic benchmark (E0) and four offshore cases that differ only in the tax on dividends. See the dividend section. |
Where the money leaks
Here is the walk from Path A down to Path B′, and on to Path C.
| Step | ₹ lakh | % of Path A |
|---|---|---|
| Path A final | 548.06 | |
| Forex spread 1.5% | −8.22 | −1.50% |
| TCS lock-up, 12 months | −2.10 | −0.38% |
| US dividend tax (25%) | −23.55 | −4.30% |
| Path B′ final | 514.19 | |
| Indian tax at sale (12.5%) | −42.02 | −7.67% |
| Path C final | 472.17 |
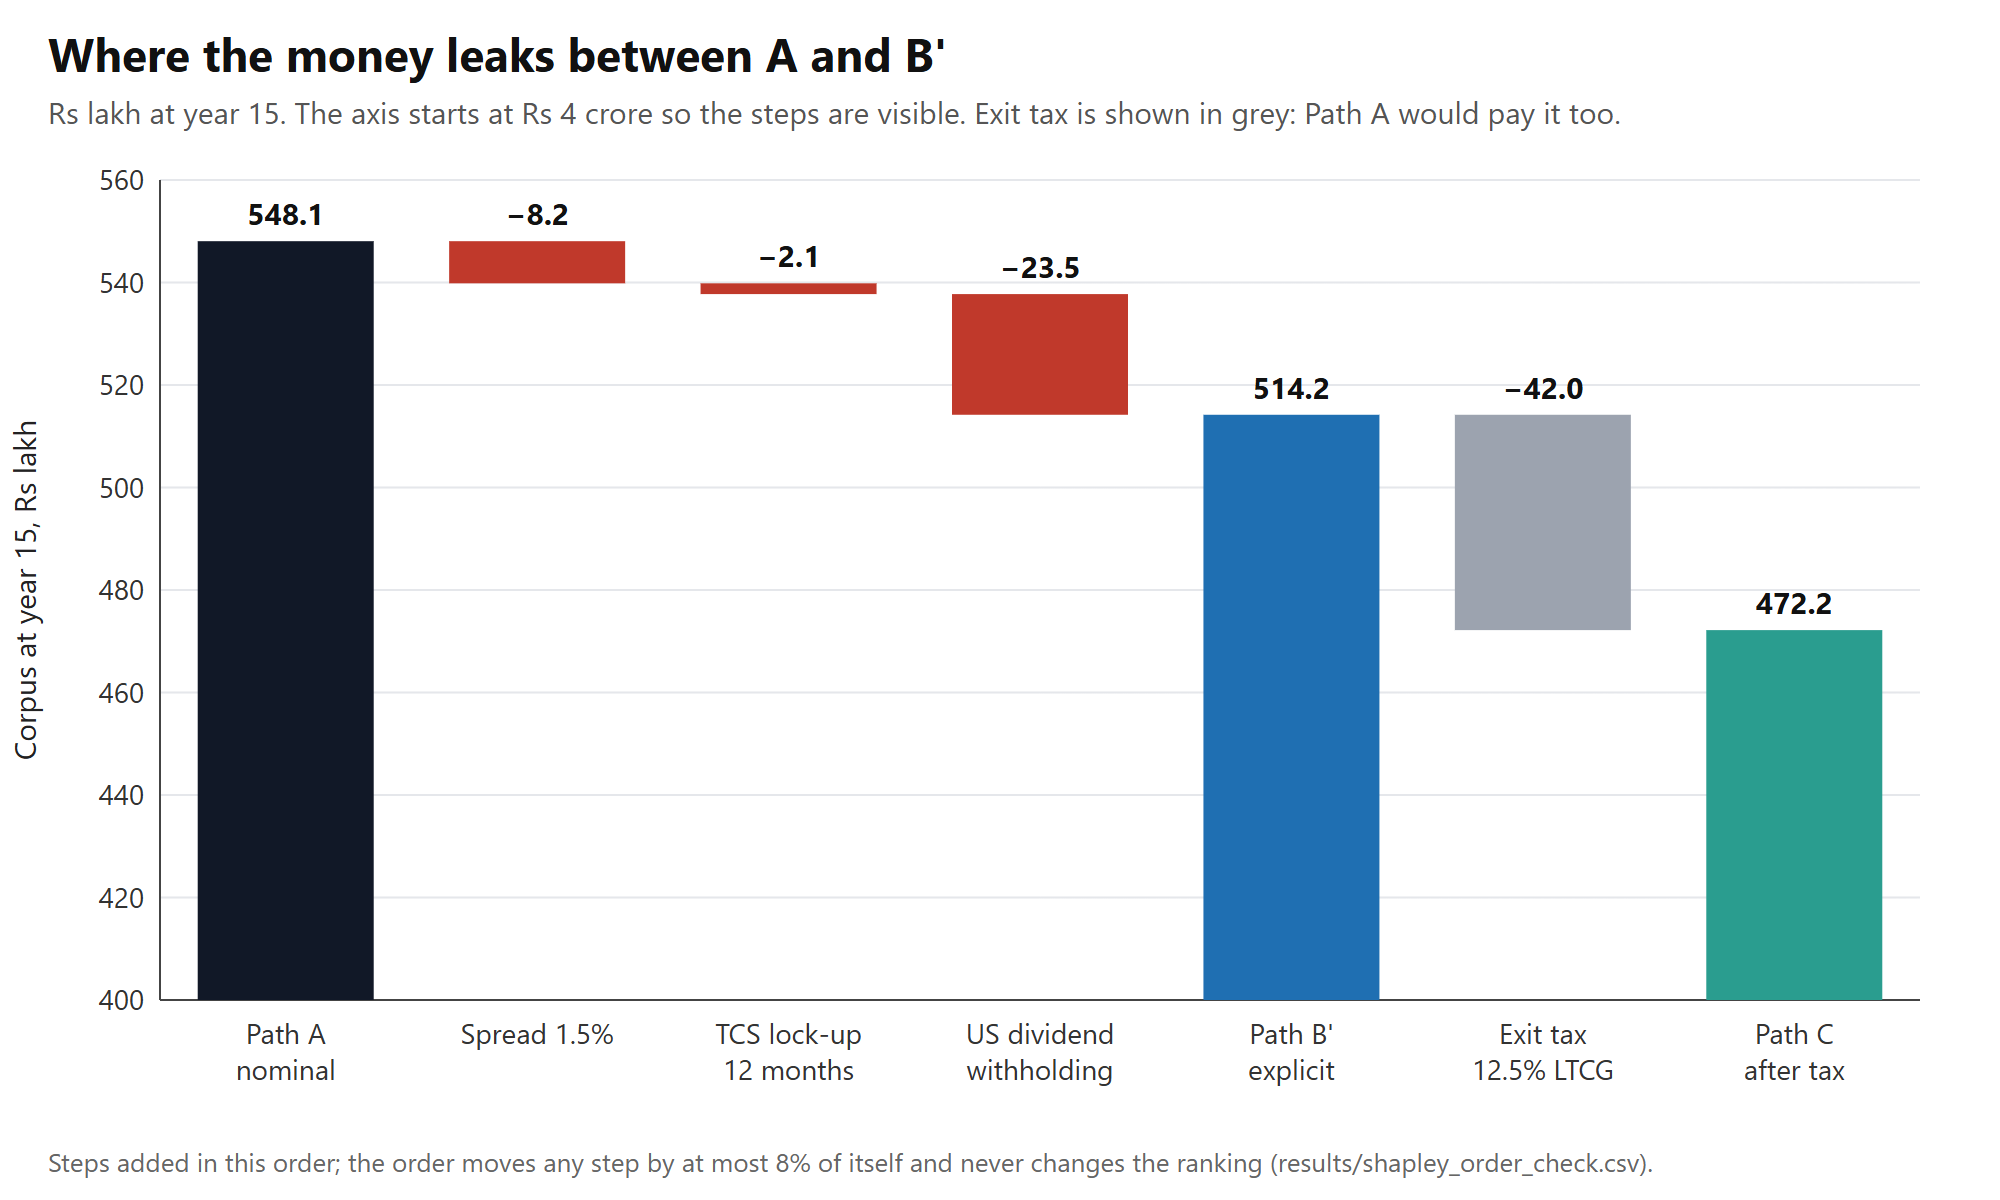
Does the order of the steps matter? Only a little. We tried all six orders. Each step moves by at most 8% of itself. The ranking never changes: dividend tax first, then spread, then TCS.
1. The forex spread: ₹8.22 lakh
Your bank gives you a worse rate than the real exchange rate. It also charges transfer fees. We assume 1.5% is lost on every transfer.
That is ₹18,000 a year. Only ₹11,82,000 reaches your broker. The loss is taken on every deposit, so it stays at exactly 1.50% of your corpus in every year. It does not snowball in percent.
2. The TCS wait: ₹2.10 lakh
LRS is the Liberalised Remittance Scheme. It lets you send money abroad. TCS is Tax Collected at Source. The bank takes it when you send money.
The rule, as we read it on the Income Tax Department's site (section 394 of the Income-tax Act, 2025, as changed by the Finance Act 2026): 20% TCS applies to investment remittances above ₹10 lakh a year. The cut to 2% covers only education and medical remittances. It does not cover investing.
We assume 20% applies only to the part above ₹10 lakh. That is long-standing practice, but the section text does not say it in so many words. Please confirm with your bank or a CA.
So on ₹12 lakh, TCS is 20% of ₹2 lakh. That is ₹40,000 a year. We treat it as an extra payment on top of the ₹12 lakh.
TCS is not a final tax. It counts toward your income tax, and any extra is refunded. But the refund comes only after you file your return. We assume 12 months.
So you do not lose the ₹40,000. You lose what it would have earned while it waited. That is the cost we count: ₹2.10 lakh over 15 years, or 0.38% of Path A.
We also assume this investment uses all of your ₹10 lakh limit. The limit is shared with all other foreign spending.
3. The dividend tax: up to ₹23.55 lakh, mostly avoidable
Our US shares pay a 2% dividend. The US keeps 25% of it. That is 0.5% of your balance a year, so the return falls from 13% to 12.5%. This small yearly cut compounds for 15 years. On the ladder it is the biggest step: ₹23.55 lakh.
But that is only half the story. India also taxes dividends. For someone in the top 30% tax bracket, adding the 4% extra charge (cess), the rate is 31.2%. A domestic investor pays that too.
The foreign tax credit stops you paying twice. If you claim it, the US tax counts against the Indian tax, and the total on the dividend is 31.2%. If you do not claim it, you pay both: 25% plus 31.2%, or 56.2%. The credit is claimed on Form 67 (before 2026-27) and Form 44 (after), according to the finfire calculator's help text.
To see what going offshore really costs, we need a fair benchmark. E0 is a domestic investor who earns the same return, pays no spread and no TCS, and pays 31.2% tax on dividends. Every path below pays 12.5% tax at sale.
| Path | Total tax on dividend | Final corpus (₹ lakh) | Gap vs E0 (₹ lakh) | Gap vs E0 |
|---|---|---|---|---|
| E0 Domestic benchmark | 31.2% | 475.92 | 0 | 0.00% |
| E1 Offshore, credit claimed | 31.2% | 467.22 | 8.70 | 1.83% |
| E2 Offshore, credit not claimed | 56.2% | 447.82 | 28.11 | 5.91% |
| E3 Offshore, credit claimed on half the dividends (our assumption) | 43.7% | 457.40 | 18.52 | 3.89% |
| E4 Offshore, US 25% only (the brief's version; same as Path C) | 25.0% | 472.17 | 3.75 | 0.79% |
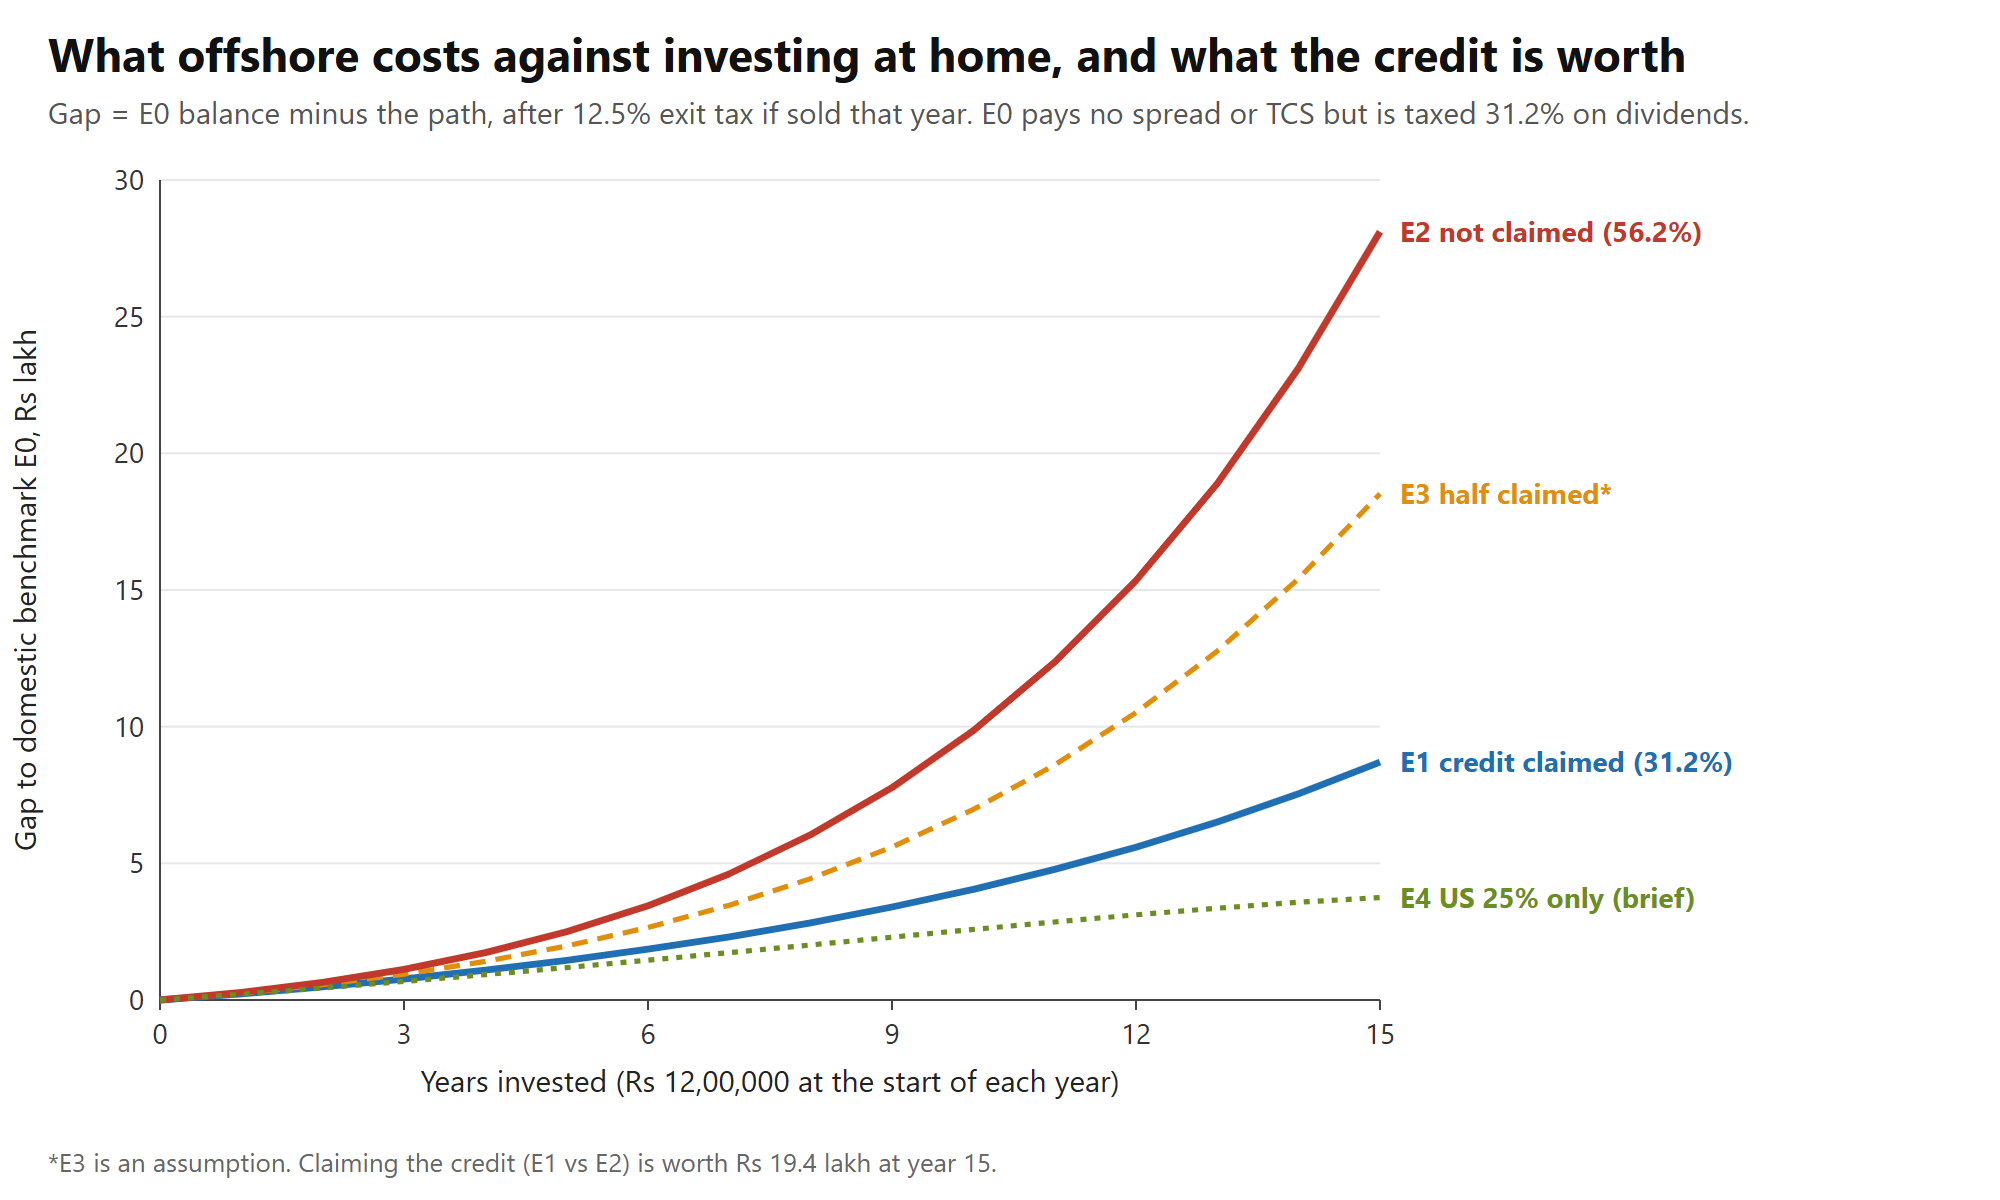
Four things to read carefully.
- What is left in E1. E1 and E0 earn the same return and pay the same dividend tax. The ₹8.70 lakh that remains comes from the spread and the TCS wait. A smaller gain also means a little less tax at sale, which offsets part of it.
- E4 looks cheapest, but it is not a like-for-like case. It taxes dividends at 25% and assumes India collects nothing on top. That is the brief's version, and it understates the cost.
- E3 is our assumption, not a rule. It is often said that filing-year mismatches or the New Tax Regime make the credit hard to use. We have no data on how often that happens. E3 only shows what a half-working credit would look like.
- E0 is a thought experiment. It earns the same return as the US shares. A real domestic fund would earn something different. We also did not give E0 the ₹1.25 lakh exemption that listed Indian shares get on gains. It is worth at most ₹15,625 at sale and changes no ranking.
One more caution. The calculator has its own "Investing abroad" tool. It takes the dividend tax out of each month's balance. That turns 13% into 12.435%, not 12.5%. Its corpus is about ₹2.7 lakh lower than ours. We kept the simple 12.5% for the ladder. The conclusions do not change.
Our shortcut overstated the drag
Our first model (Path B) was a shortcut. It cut each year's deposit to ₹11,50,000 for good and used a 12.5% return. It treated the TCS wait as a permanent loss.
| Model | Final corpus (₹ lakh) | Gap vs Path A |
|---|---|---|
| Shortcut, Path B | 502.16 | ₹45.90 lakh, 8.38% |
| Explicit, Path B′ | 514.19 | ₹33.87 lakh, 6.18% |
The shortcut overstates the gap by about ₹12 lakh (8.38% against 6.18%). Path B′ is more defensible. TCS is refundable, so only the waiting should count.
Does the gap widen?
Yes, in rupees. For Path B′:
| Year | Gap (₹ lakh) | Gap (% of Path A) |
|---|---|---|
| 1 | 0.31 | 2.30% |
| 10 | 11.60 | 4.64% |
| 15 | 33.87 | 6.18% |
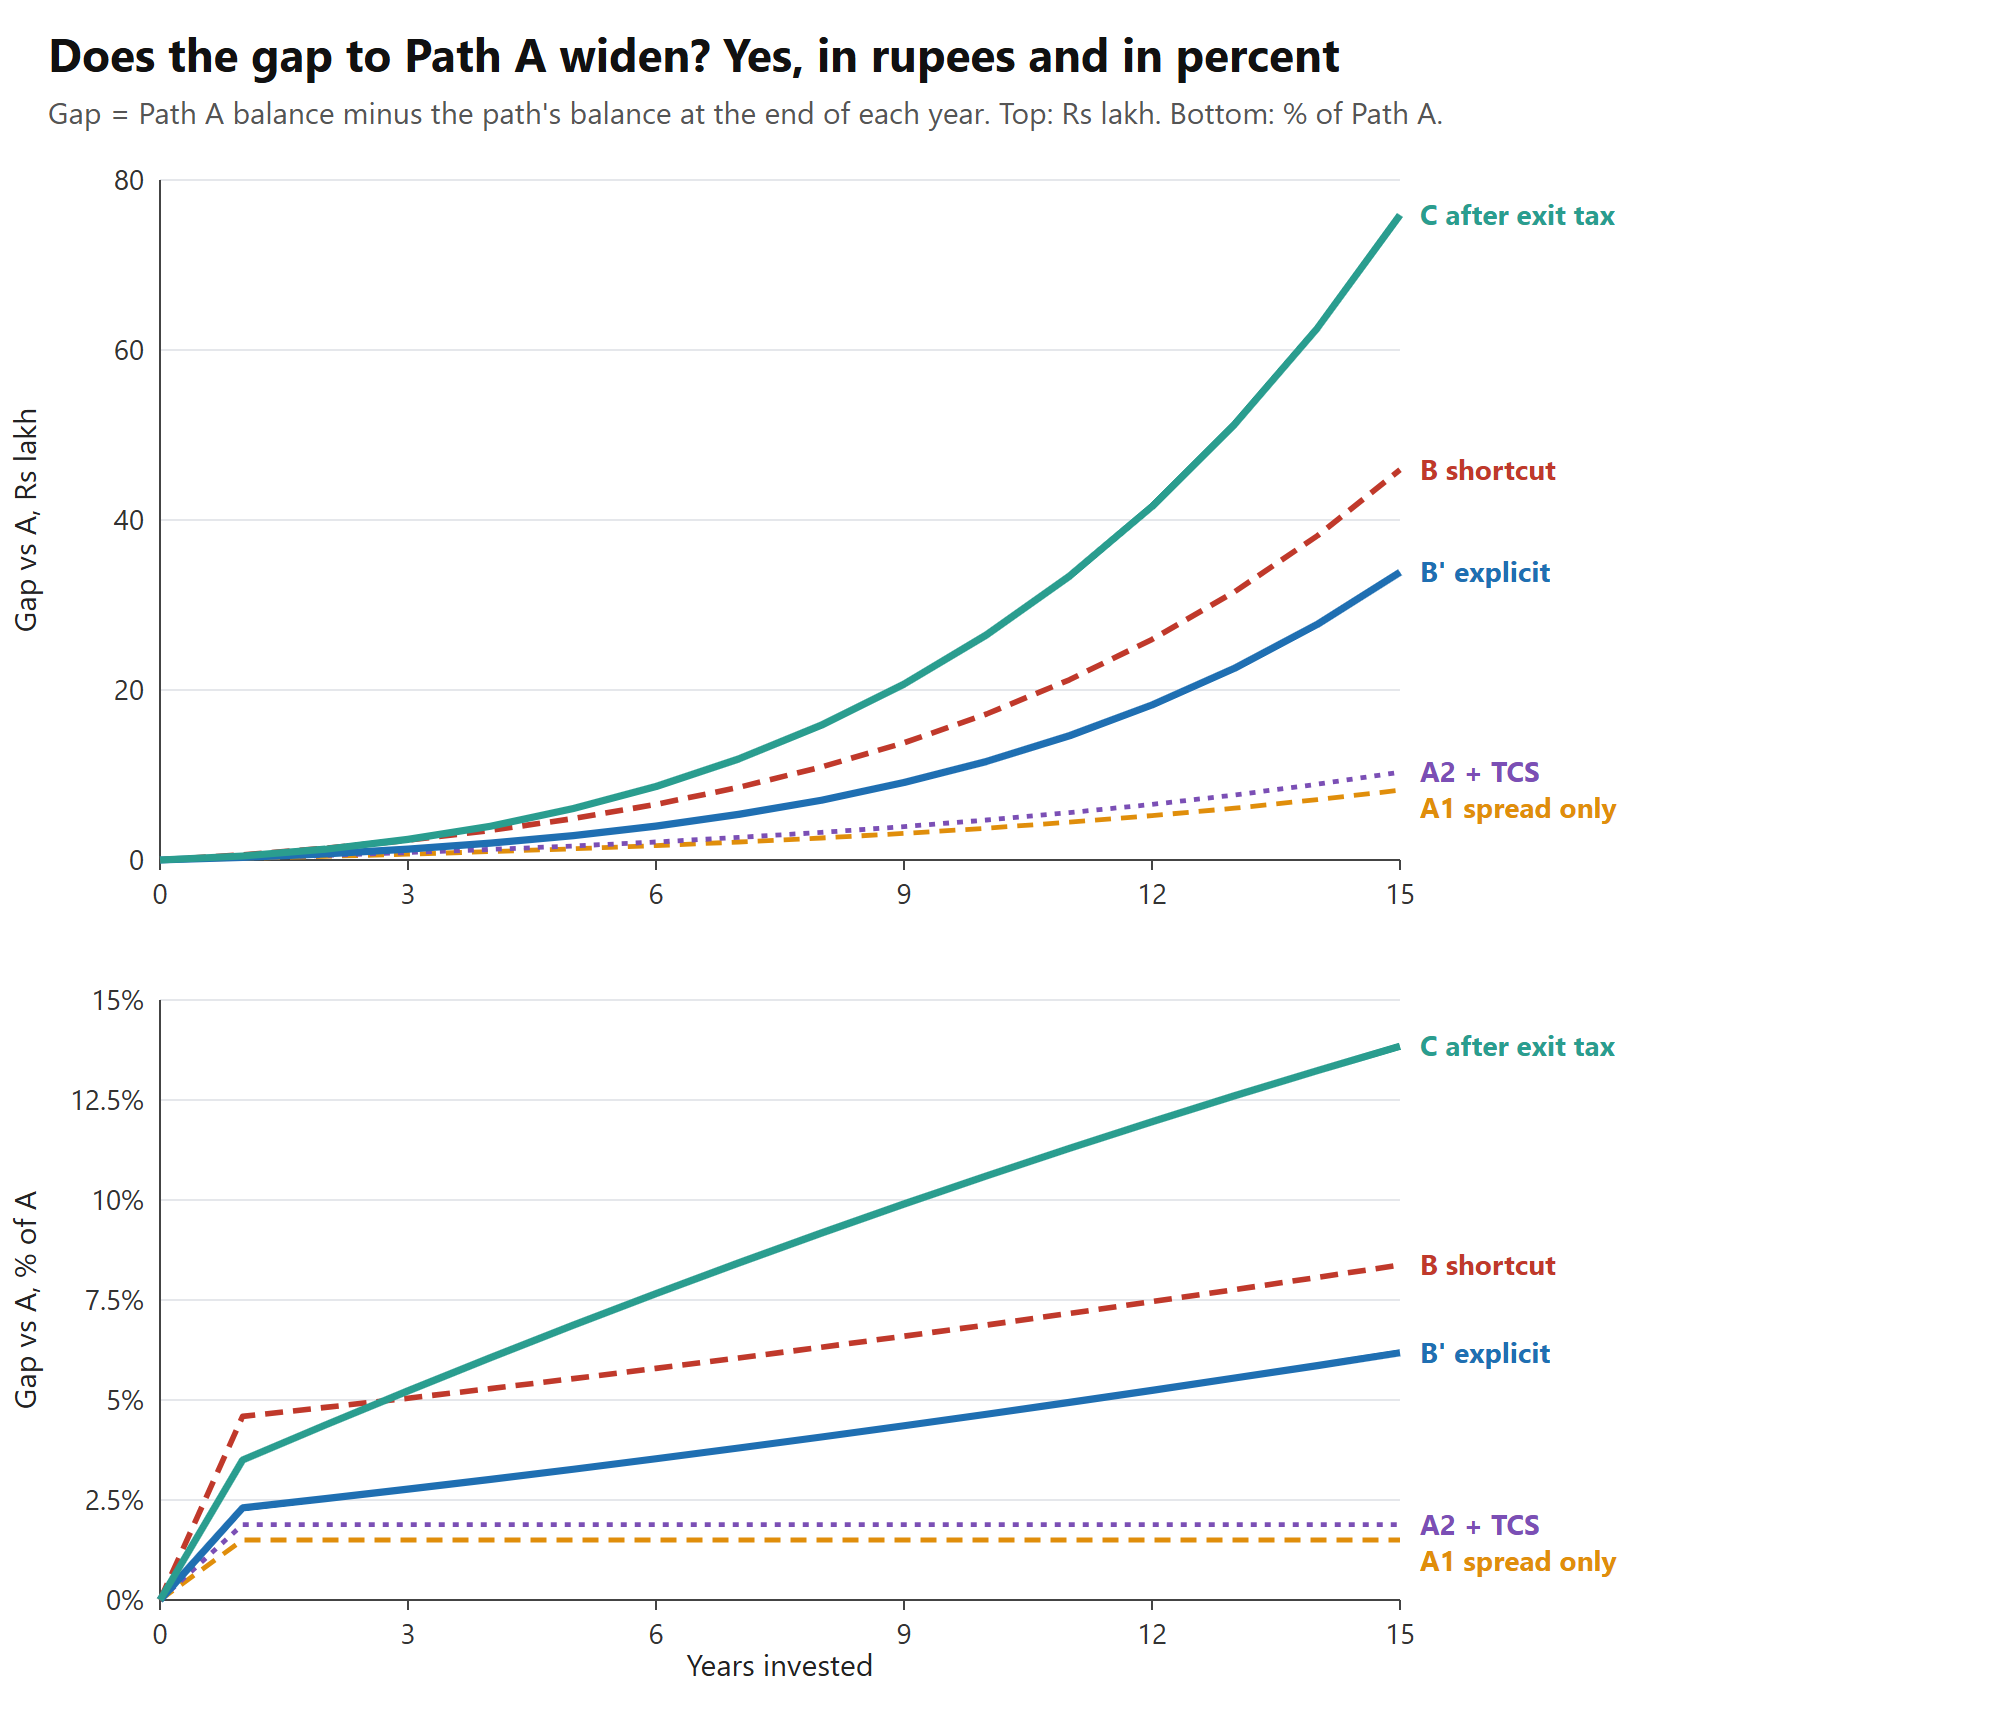
This is a more nuanced answer than "friction compounds". A cost taken from each deposit (the spread) stays a fixed share of your corpus. A cost taken from each year's return (the dividend tax) grows as a share. The "compounding gap" in our results is mostly the dividend tax.
Tax at sale (Path C)
Path C sells everything in year 15. We apply 12.5% long-term capital gains tax (LTCG) on the gain. This is the rate for foreign shares held more than 24 months, with no inflation indexation. We do not apply the ₹1.25 lakh exemption, because it belongs to listed Indian shares.
The tax is ₹42.02 lakh. Path C ends at ₹472.17 lakh, which is 13.85% below Path A.
That comparison is unfair. Path A has no tax at all. An Indian investor in domestic shares also pays tax on sale. The rules differ, but there is a tax. So we applied the same 12.5% to Path A. It ends at ₹502.05 lakh.
Against that benchmark, Path C is ₹29.88 lakh lower, or 5.95%. This is closer, but still not fair, because Path A also pays no dividend tax. The fairest comparison is E0 in the dividend section: 1.83% lower if you claim the credit, and 5.91% lower if you do not.
Small variants:
- With the 4% cess on the tax: ₹470.49 lakh (14.15% below Path A).
- Using the amount that reached the broker as cost, not the amount you sent: ₹471.84 lakh (13.91%).
What changes the answer?
We changed one input at a time. Each row compares Path B′ with Path A at the same return.
| Change | Gap vs Path A |
|---|---|
| Spread 0.5% | 5.22% (₹28.63 lakh) |
| Spread 1.0% | 5.70% (₹31.25 lakh) |
| Spread 1.5% (base) | 6.18% (₹33.87 lakh) |
| Spread 2.5% | 7.14% (₹39.11 lakh) |
| Combined return 8% | 5.91% |
| Combined return 10% | 6.03% |
| Combined return 12% | 6.13% |
| TCS refund after 6 months | 6.01% |
| TCS refund after 12 months | 6.18% |
| TCS refund after 18 months | 6.34% |
| ₹1,00,000 a month, not a lump sum | 5.97% (₹30.95 lakh) |
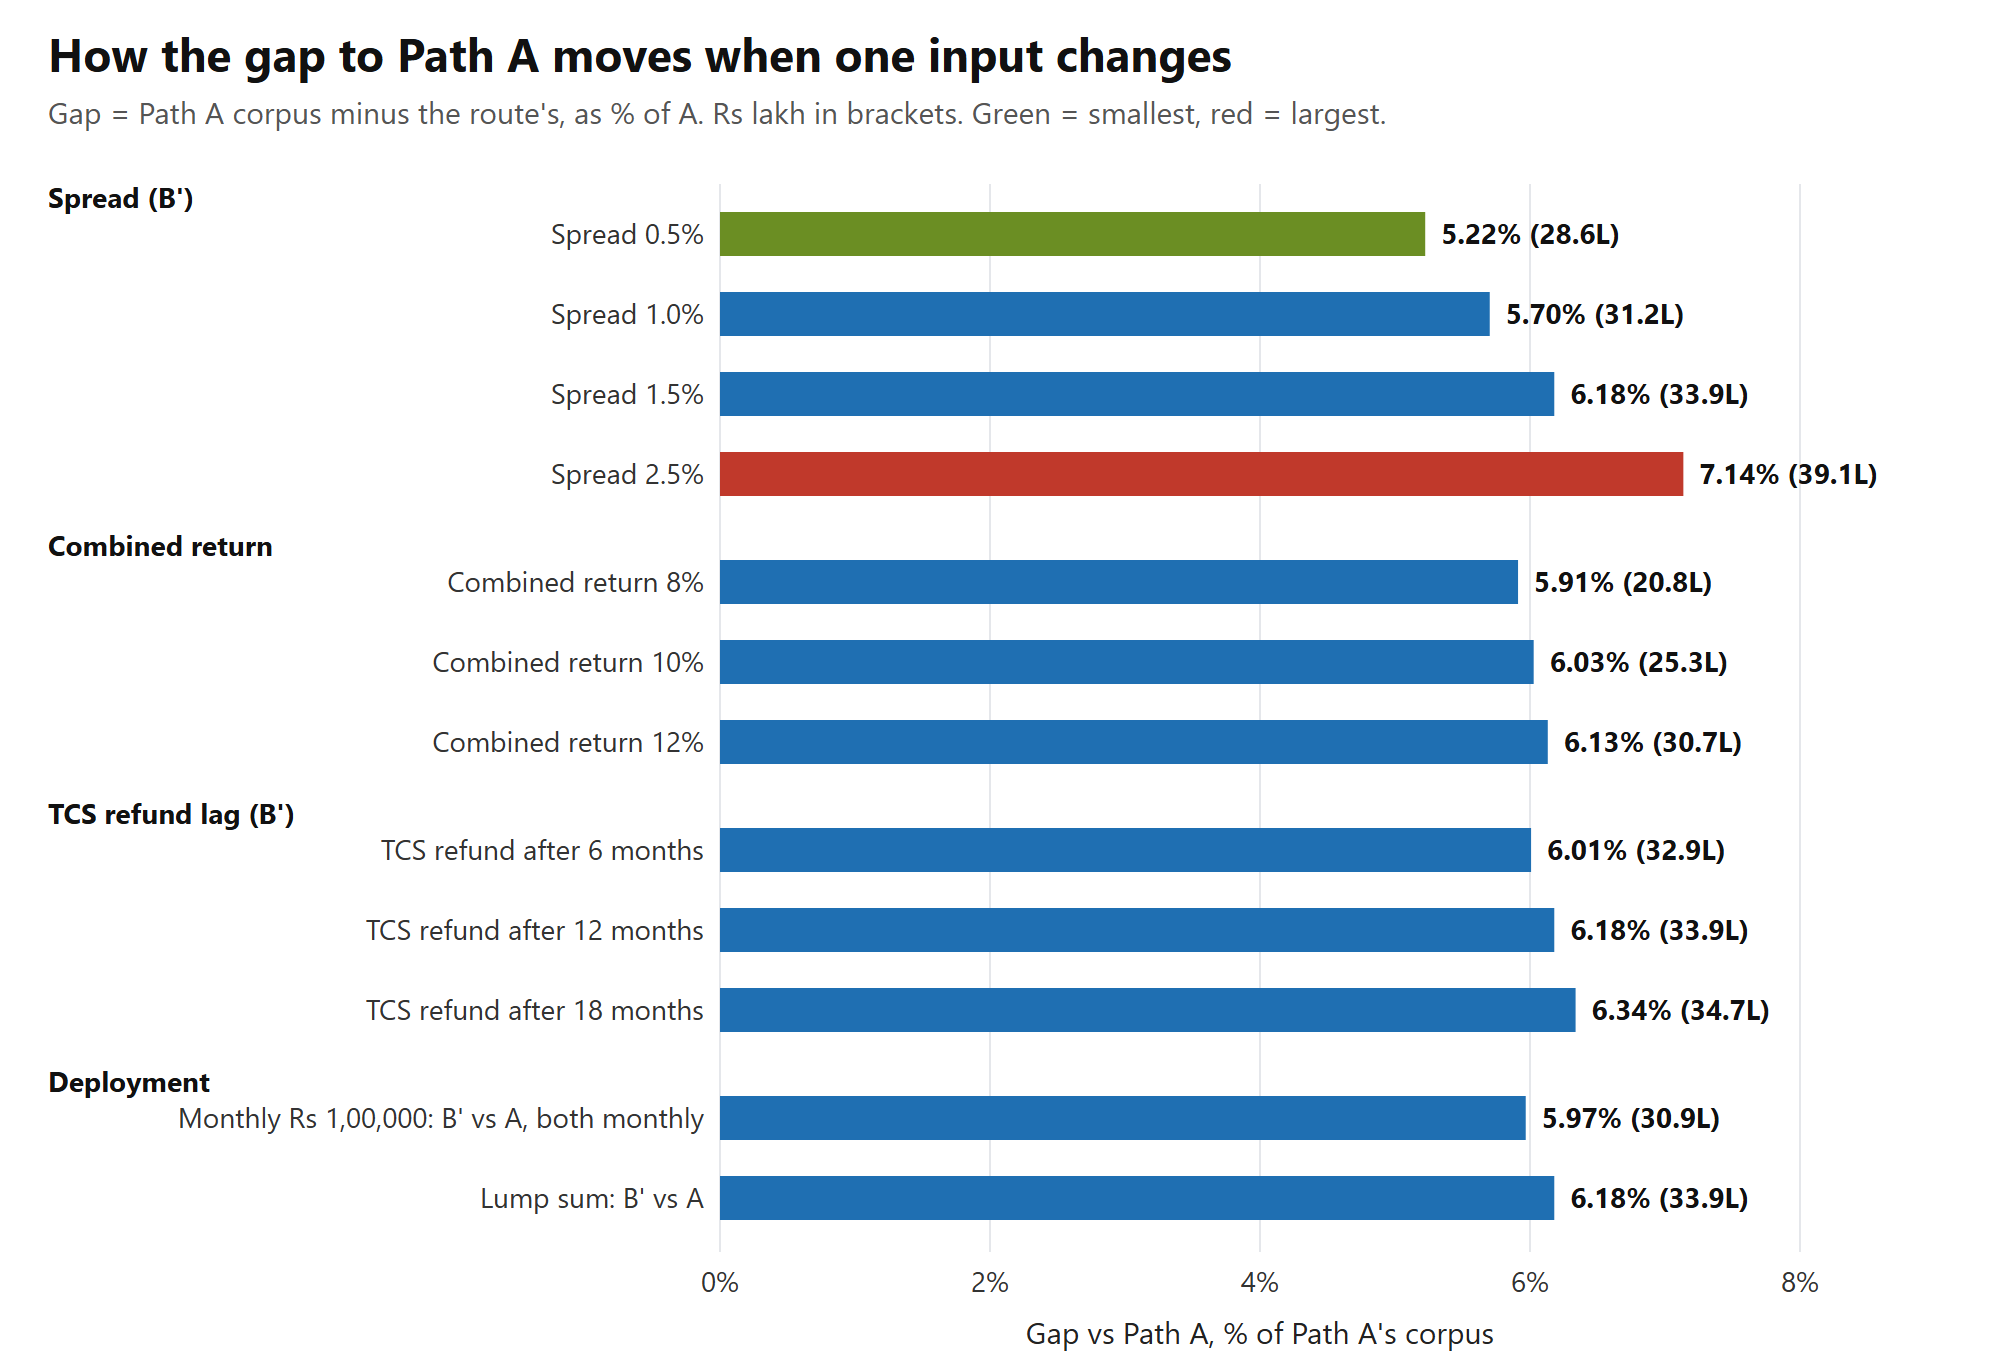
The gap is largest at a 2.5% spread and smallest at a 0.5% spread. The spread is the one lever fully in your hands.
Putting money in monthly leaves a slightly smaller gap (5.97%). But monthly investing ends lower than a lump sum on day one: ₹518.52 lakh against ₹548.06 lakh. That 5.39% difference is from timing, not friction. A domestic investor faces it too.
Could a lower-friction route help? (Path D, illustrative)
Every number in Path D is an assumption. We do not name or recommend any product.
We assumed a 0.5% spread, a 0.10% yearly fund cost, and 15% dividend tax at the fund level instead of 25%. That gives a 12.6% return. We kept the same TCS wait and the same 12.5% tax at sale.
Path D ends at ₹480.84 lakh, 12.27% below Path A. Path C ends 13.85% below. So the lower-friction route recovers some of the gap. Its gain comes from the lower spread and the lower dividend tax. The 0.10% fund cost works against it.
Real products differ, and we did not model their other rules.
What weakens the story
You should know where the evidence is thinner than the headline.
- TCS is the smallest leak. It is 0.38% of Path A. Even at an 18-month refund, the gap only moves from 6.18% to 6.34%. The remittance tax feels painful at the bank. Over 15 years, it is a minor cost, if you file on time and get the refund.
- Our shortcut was too harsh. See above.
- The spread does not widen in percent. It is a fixed 1.50% cost.
- The US dividend tax is a rule, not a hidden fee, and it is mostly recoverable. The ladder's ₹23.55 lakh counted only the US tax and ignored India's. Against a domestic investor, offshore ends 1.83% lower if you claim the credit and 5.91% lower if you don't.
- The return level hardly matters. The gap is 5.91% at 8% and 6.13% at 12%.
- Tax at sale is not an offshore penalty. Against Path A taxed the same way, 5.95% remains. Against a domestic investor, 1.83% to 5.91%.
- The credit cases are all-or-nothing. E1 assumes the credit works fully and E2 assumes it does not work at all. E3 (half) is our assumption. We have no data on how often the credit is really claimed.
- Some assumptions are too simplistic. The ladder counts only the US 25%, not India's tax on dividends. It has one sale at year 15. It assumes this investment uses the whole ₹10 lakh limit. Change these and the gap changes.
So a fair headline is not "severe". For the no-friction Path A, the gap is 6.18% before tax at sale, if only the US tax is counted. As a domestic investor who earns the same return, going offshore costs about 1.8% of your final corpus if you claim the foreign tax credit, and about 5.9% if you do not. The spread and the TCS wait are what is left once the credit works. The credit is the biggest lever you have.
What to check
This is not advice. It is a list of things worth checking for your own case.
- Compare spread quotes. A 0.5% spread leaves a 5.22% gap. A 2.5% spread leaves 7.14%.
- File the US form that sets your dividend tax rate. It is called W-8BEN. It tells your broker you are an Indian tax resident. In our model, the US keeps 25% with it and 30% without.
- File your return on time, and check Form 26AS. This is your tax credit statement. The TCS refund comes from your return.
- Claim the foreign tax credit. In our model it is worth ₹19.40 lakh over 15 years (E1 against E2).
- Watch your ₹10 lakh limit. It covers all foreign spending, not just investing.
- Report your foreign holdings in your return. (See the Schedule FA note below.)
- Test your own numbers. The finfire calculator does this in a few minutes.
What we could not model
- US estate tax. For Indians holding US-listed shares above US$60,000, it can apply. We did not model it.
- Short-term lots. Shares held under 24 months are taxed at your normal income tax rate. We treat every lot as long-term.
- Brokerage and platform fees.
- Schedule FA. This is the foreign-asset section of the return. We did not model the effort or cost of filing it.
- The currency-gain split in the tax at sale.
- Real cash dividends. We use a steady yearly drag (0.5% for the US tax alone, 0.62% to 1.12% with India's tax), not actual cash flows. India taxes dividends when you receive them.
- Whether your credit is accepted. Filing-year mismatches and your tax regime may limit it. E3 is only a rough stand-in.
- Selling or rebalancing before year 15.
- A fund cost in Paths A to C.
Rules are as on October 2026. They can change. Ask a CA about your own case.
Try this scenario yourself
You can run your own numbers in the finfire calculator: https://accumulate.finfire.org/
The calculator holds one plan at a time. It does not know about the spread, the TCS wait, or tax at sale. You add those by hand. The "Compare" section needs a Pro account and a sign-in.
- Open the starter plan. It has ₹1,00,000 a month, 13%, 15 years, and no friction: https://accumulate.finfire.org/#a=0&m=100000&r=13&i=6&n=15
- Enter your numbers. Change Monthly investing to what you really send abroad. Change Return to your own guess in rupees (US return plus rupee fall). Change Stop working after to your number of years.
- Read the answer. The line "After N years you will have ..." is your nominal illusion.
- Pin it. Open Compare (Pro). Press Pin this plan (create a baseline plan to compare). This becomes Plan A.
- Add the spread. If you lose 1.5% on every transfer, type 98,500 in Monthly investing.
- Add the dividend tax. If the US keeps 25% of a 2% dividend, lower Return from 13 to 12.5. If your route keeps only 15%, lower it by 0.3 points. India also taxes dividends. To see the double tax, set Return to 12.376 if you claim the credit (31.2% total), or 11.876 if you do not (56.2% total). Or use the Investing abroad (Pro) section.
- Count the TCS wait yourself. The calculator shows TCS but does not take it off. Our rule of thumb: the cost is the TCS locked, times your return for the months it is locked, added up over the years. In our run it was about 0.4% of the corpus.
- Read the gap. Plan A's corpus minus Plan B's, less the TCS cost, divided by Plan A's. Then take about 12.5% of your gain for the tax at sale.
The same plan after steps 5 and 6: https://accumulate.finfire.org/#a=0&m=98500&r=12.5&i=6&n=15
What to change: try spread 0.5% against 2.5%. Try Return 12.376 against 11.876 to see what the credit is worth to you. Try a 6-month and an 18-month TCS wait. Try your own monthly amount. Then see which input moves your gap the most.
Exact inputs behind this paper. Our headline paths use a lump sum each year. The calculator allows only 10 lump-sum rows per plan, so each path takes two links. Add the two corpora.
| Path | Link 1 | Link 2 |
|---|---|---|
| A (₹548.06 lakh) | open | open |
| B′ stream (₹514.19 lakh after the TCS step) | open | open |
| B shortcut (₹502.16 lakh) | open | open |
| E0 domestic benchmark (₹475.92 lakh after the outside steps) | open | open |
| E1 credit claimed (₹467.22 lakh) | open | open |
| E2 credit not claimed (₹447.82 lakh) | open | open |
The links for every other path, and the tests we ran on them, are in reproducibility.md. The B′ and E links show the stream before the TCS step and the tax at sale, which are worked out outside the calculator.
Illustrative, not investment advice. Rules as on October 2026.
Reproducibility. The exact inputs, calculator links and results behind every figure and table in this paper (path by path, with the steps worked out outside the calculator marked): reproducibility.csv