Bucket Refill vs. Single-Pot SWP: Stress-Testing the "Annual Top-Up" Rule in a Sideways Market
finfire.org Research, paper 5. Published 20 October 2026. Every number comes from the burndown.finfire.org engine. Tax rules for FY2026-27, new regime.
Key Findings - The short answer
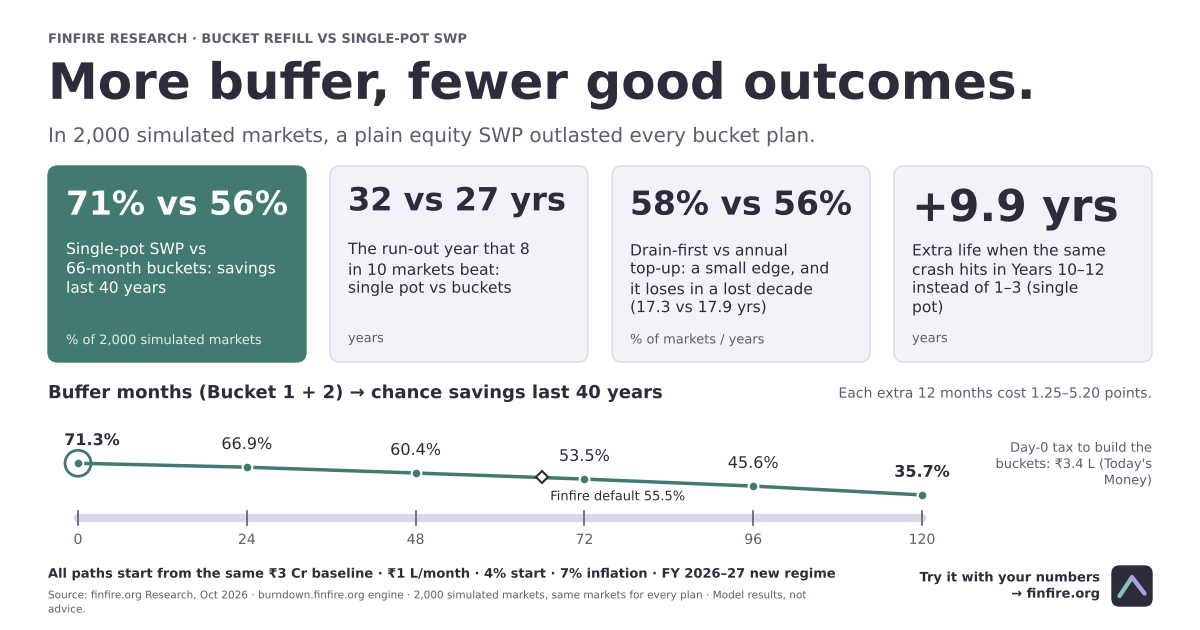
- No bucket plan beat the single pot. Across 2,000 simulated markets, a plain single-pot equity SWP kept paying for 40 years in 71.35% of markets. The Finfire-default 66-month bucket plan with an annual top-up managed 55.55%.
- More buffer meant lower odds at every step. Each extra 12 months of cash and debt cut the 40-year success rate by 1.25 to 5.20 percentage points: 71.35% at 0 months, 35.70% at 120 months.
- "Drain first" helps a little, but not in a sideways market. Pausing equity sales during a fall lifted the bucket plan from 55.55% to 58.05% of markets. In a 10-year sideways market it ran out 7 months sooner (17.3 vs 17.9 years).
- When the crash hits matters more than how you bucket. The same −20% / −15% / 0% slump in Years 10–12 instead of Years 1–3 adds 9.9 years to the single pot and 7.1 years to the bucket plan.
- Buckets carry a Day-0 tax bill. Carving 66 months of buffer out of an equity portfolio with 45% gains costs ₹3.4 L in capital gains tax on the first day (Today's Money).
Disclaimer: None of this constitutes financial, tax, or investment advice. Every figure relies on assumptions. We spell them out in this paper. finfire.org operates the calculator and offers paid tiers.
1. The question
Ask any Indian FIRE forum how to draw an income from a retirement corpus and you will get three answers.
- The single pot. Put everything in one equity fund, or a Balanced Advantage Fund (BAF), and run a monthly SWP. It is simple and fully invested.
- Buckets with an annual top-up. Keep a year or two of spending in liquid funds (Bucket 1), a few more years in debt (Bucket 2), and the rest in equity (Bucket 3). Once a year, refill the safe buckets from equity, whatever the market did.
- Buckets with "drain first". Same buckets, but when equity is down you stop selling it. You live off Buckets 1 and 2 and let equity recover first.
All three are trying to beat one enemy, sequence risk. A crash early in retirement forces you to sell more units at low prices while you pay your bills. Those units never get the chance to recover.
The bucket camp says a safe buffer lets you ride out the crash. The single-pot camp says that buffer earns too little, and 7% inflation quietly eats it. Inside the bucket camp, people argue about the refill rule itself: is it smart to keep topping up during a crash, or is that just "selling low on a schedule"?
Our earlier paper, Stress Testing India's Safe Withdrawal Rate (2026), compared a plain SWP with buckets on historical Indian data. This paper goes one level deeper and tests the refill rule itself. Every result runs on the calculator's own engine, and every scenario starts from the same family's money and changes one thing at a time.
Three terms come up again and again:
- Drain-first: stop selling equity while it is down, and spend the cash and debt buckets until it recovers.
- High-water mark: the highest unit price (NAV) the equity fund has reached so far. "Below the high-water mark" just means "still down from its peak".
- Runs out: the first month the plan cannot pay the full monthly spending.
The baseline: every path in this paper starts here
| Starting corpus | ₹3,00,00,000 (₹3 Cr) |
|---|---|
| Spending in Year 1 | ₹1,00,000 a month (₹12 L a year, a 4.0% withdrawal rate) |
| Inflation | 7% a year; spending steps up 7% every year |
| Equity (Bucket 3) | 12% a year median, with 15.5% ups and downs (standard deviation) |
| Debt (Bucket 2) | 7.25% a year |
| Liquid (Bucket 1) | 6.25% a year, no ups and downs |
| Tax | FY 2026–27 new regime |
| Unrealised gains on day one | 45% of the equity value |
Think of this as one family on one day with ₹3 Cr. We then run the same family through many "parallel lives". Each one changes a single thing, such as the bucket set-up, the refill rule or the market. Every chart in this paper shows several of those lives side by side, all starting from the same ₹3 Cr baseline.
The plans we tested
| Plan | Bucket 1 (liquid) | Bucket 2 (debt) | Bucket 3 |
|---|---|---|---|
| C1 Single-pot equity SWP | 0 | 0 | 100% equity |
| C1b Single-pot BAF SWP | 0 | 0 | 100% BAF-like fund (10% median, 9% ups and downs, taxed as equity) |
| C2 Lean buffer, 36 months | 12 months (₹12 L) | 24 months (₹24 L) | the rest in equity |
| C3 Finfire default, 66 months | 18 months (₹18 L) | 48 months (₹48 L) | the rest in equity |
| C3b C3 plus a glide path | as C3 | as C3 | equity slowly moving to 20% equity / 60% debt / 20% liquid by Year 50 |
And the four refill rules:
- A, mechanical top-up: every year end, refill Buckets 1 and 2 to their full targets from equity, no matter what. This is what the calculator does today.
- B, drain-first: no equity sales while equity is below its high-water mark.
- C, guardrail: like B, but if the safe buckets fall below 24 months of spending, sell enough equity to bring them back to 24 months.
- D, gains-only: equity may only sell the amount by which it has grown above its Day-0 value in Today's Money.
Assumptions & Method
- Start: ₹3,00,00,000, all in equity with 45% unrealised gains. Every path starts from this same baseline.
- Spending: ₹1,00,000 a month in Year 1 (4.0%), rising 7% once a year. A plan "runs out" in the first month it cannot pay in full.
- Returns: equity 12% median (geometric), 15.5% SD. Debt 7.25% (2% SD). Liquid 6.25% (0% SD). BAF stand-in 10% median, 9% SD.
- Compounding: monthly rate = (1+R)^(1/12) − 1, never R/12.
- Order: each month, spending comes from Bucket 1, then 2, then 3. At year end, tax is paid, then the refill rule runs.
- Tax: FY 2026–27 new regime as the engine applies it. Equity gains: 12.5% + 4% cess above ₹1.25 L a year. Debt gains: slab rates above the ₹4 L basic exemption, with the 87A rebate up to ₹12 L. All thresholds rise 7% a year by default (frozen thresholds tested separately).
- Day 0: buffers are bought by selling equity, and that sale is taxed (₹3.4 L for 66 months).
- Markets: fixed stories (flat 12%, early slump, mid slump, lost decade), a 2008 NIFTY 50 TRI replay, and 2,000 simulated markets (seed 20260927). Every plan sees the same 2,000 markets.
- Refill rules: A mechanical top-up; B drain-first; C drain-first with a 24-month floor; D gains-only.
- Today's Money: Nominal ÷ 1.07^years. Success = % of 2,000 simulated markets still paying at the stated year.
- Checked: the research set-up matches the live calculator to the rupee (₹0 difference, and 931 of 2,000 markets lasting 50 years in both).
- Research-only: rules B, C and D, the Day-0 tax and the multi-rate slumps run on the calculator's own engine through a research harness. They are not yet buttons in the calculator.
2. When the crash hits
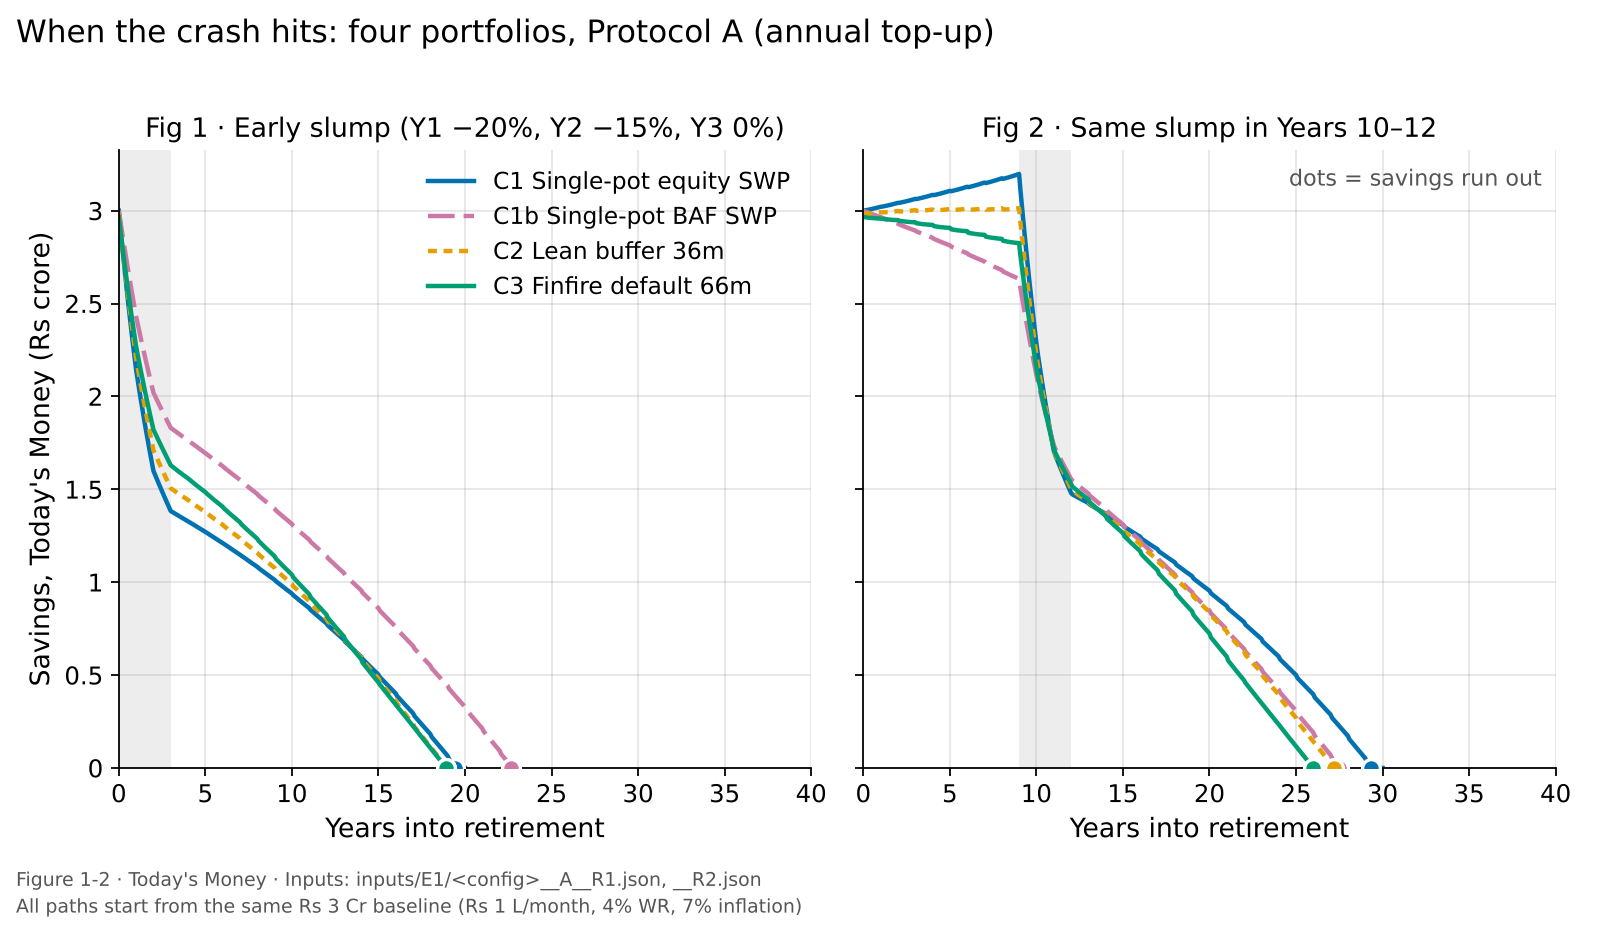
We first hit every plan with the same slump: equity −20% in Year 1, −15% in Year 2, 0% in Year 3, then back to 12%. That is a 32% fall on paper, or roughly 44% once three years of 7% inflation are counted. Then we moved the exact same slump to Years 10–12.
| Plan | Rule | Slump in Years 1–3: runs out | Slump in Years 10–12: runs out | Years lasted | Extra years from a later slump |
|---|---|---|---|---|---|
| C1 single pot | A | Year 20, Month 6 | Year 30, Month 5 | 19.4 → 29.3 | +9.9 |
| C1b BAF single pot | A | Year 23, Month 9 | Year 28, Month 7 | 22.7 → 27.5 | +4.8 |
| C2 36 months | A | Year 19, Month 12 | Year 28, Month 3 | 18.9 → 27.2 | +8.3 |
| C2 36 months | B | Year 20, Month 1 | Year 28, Month 5 | 19.0 → 27.3 | +8.3 |
| C3 66 months | A | Year 19, Month 12 | Year 27, Month 1 | 18.9 → 26.0 | +7.1 |
| C3 66 months | B | Year 20, Month 4 | Year 27, Month 6 | 19.3 → 26.4 | +7.2 |
What this shows:
- The buckets did not outlast the single pot, even in the early crash they were built for. The single pot lasted 19.4 years. The 66-month plan lasted 18.9 years.
- Timing beat structure. Moving the slump nine years later bought every plan between 4.8 and 9.9 extra years. Among the three equity-based plans (C1, C2, C3), the choice of plan changed the outcome by less than a year in the early slump, and by about 3 years in the mid slump.
- The BAF did best in the early slump (22.7 years) because it fell less. In our model the BAF dropped −9.5%, −6.3% and then +3.0% in those three years. Section 5 shows the price of that smoother ride.
These two slumps use three different equity returns in a row, which the calculator's Market Slump control cannot do yet (it holds one rate). They ran on the calculator's own engine through the research harness. Section 11 shows how close you can get in the calculator itself.
3. Inside the buckets: what a top-up actually sells
Here is the heart of the debate. Under the early slump, what does rule A sell, and what does drain-first (B) do instead?
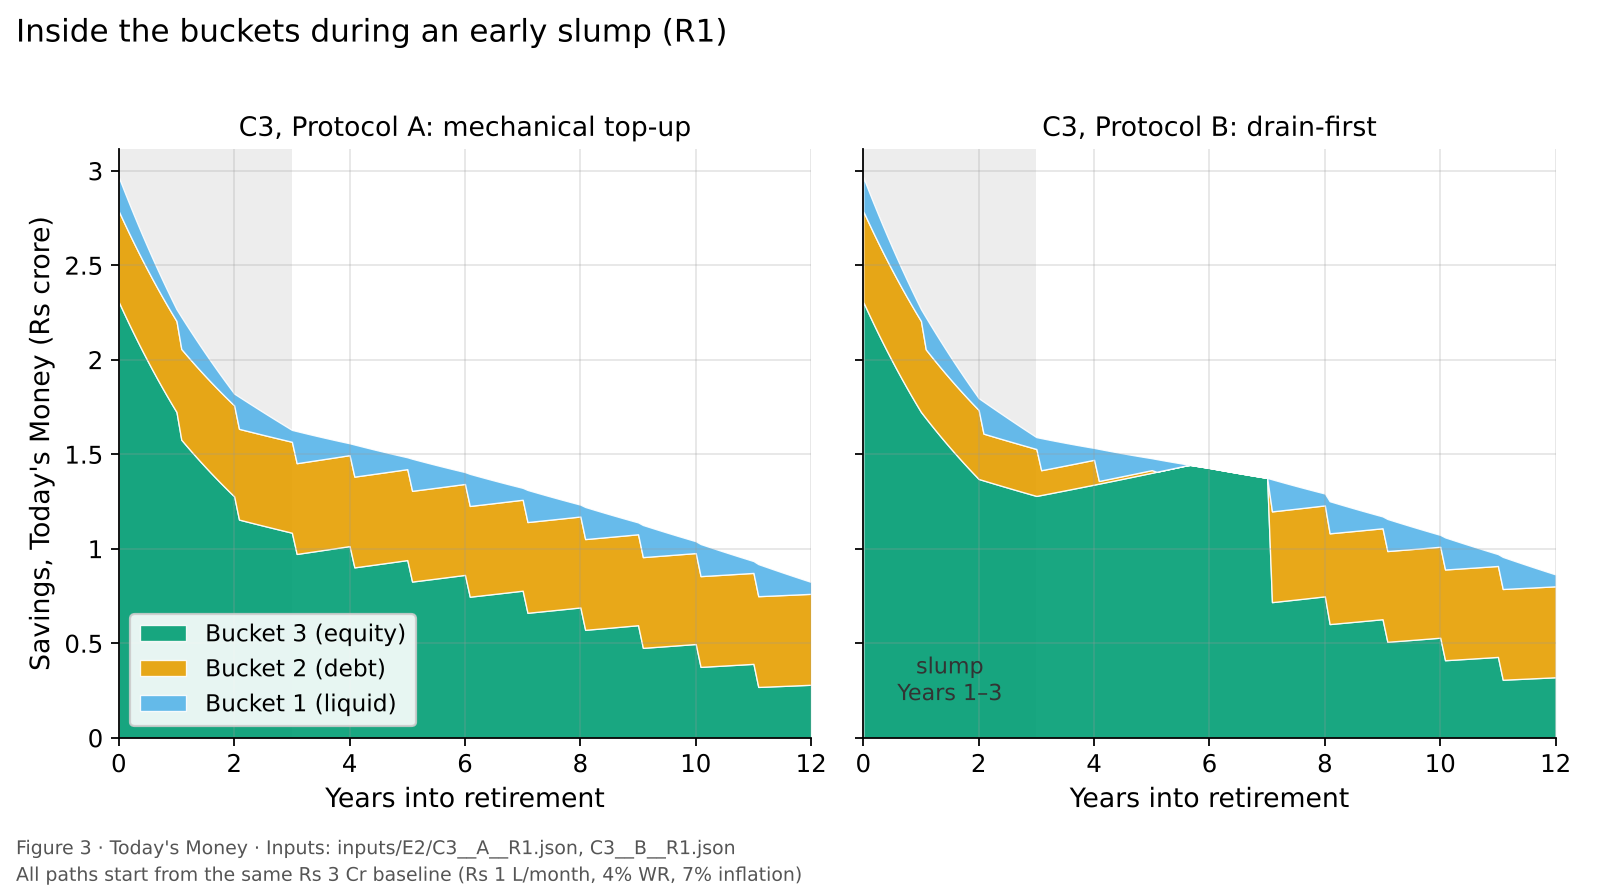
Year-end balances, 66-month plan, early slump (Nominal)
| Year | Equity return | A: Bucket 2 | A: Equity sold into Bucket 2 | A: Total | B: Bucket 1 | B: Bucket 2 | B: Total |
|---|---|---|---|---|---|---|---|
| 1 | −20% | ₹51.4 L | ₹12.4 L | ₹2.43 Cr | ₹19.3 L | ₹38.9 L | ₹2.43 Cr |
| 2 | −15% | ₹55.0 L | ₹13.3 L | ₹2.09 Cr | ₹20.6 L | ₹28.4 L | ₹2.06 Cr |
| 3 | 0% | ₹58.8 L | ₹14.2 L | ₹2.00 Cr | ₹22.1 L | ₹16.1 L | ₹1.95 Cr |
| 4 | 12% | ₹62.9 L | ₹15.2 L | ₹2.04 Cr | ₹23.6 L | ₹1.9 L | ₹2.01 Cr |
| 5 | 12% | ₹67.3 L | ₹16.4 L | ₹2.08 Cr | ₹10.8 L | ₹0 | ₹2.08 Cr |
| 6 | 12% | ₹72.0 L | ₹17.7 L | ₹2.11 Cr | ₹0 | ₹0 | ₹2.14 Cr |
Read it like a bank statement:
- Rule A sold equity at the bottom. It moved ₹12.4 L, ₹13.3 L and ₹14.2 L (Nominal) from equity into debt at the end of each slump year.
- Rule B kept its equity, but the buffer ran dry. Bucket 2 fell from ₹48 L to ₹1.9 L by Year 4, and both safe buckets were empty by Year 6. Equity then had to pay the bills directly, which happened in 17 months. Around Year 7, equity climbed back above its old peak and drain-first refilled the buckets in one go (the step in Figure 3).
- Rule B really did avoid selling low. It sold ₹8.9 L of equity while equity was below its peak, against ₹69.9 L under rule A (Today's Money).
- And yet it lasted only 4 months longer (19.3 vs 18.9 years). The equity sales B skipped did not go away. They came back a few years later at similar prices.
Was the Year-1 top-up a mistake? We reran rule A and skipped exactly one top-up at a time.
| Plan, market | Top-up skipped | Equity A sold that year (Today's Money) | Years lasted: A → skip that one |
|---|---|---|---|
| C3, early slump | End of Year 1 | ₹11.6 L | 18.9 → 18.6 |
| C3, early slump | End of Year 2 | ₹11.6 L | 18.9 → 18.8 |
| C3, early slump | End of Year 3 | ₹11.6 L | 18.9 → 18.9 |
| C3, mid slump | End of Year 10 | ₹12.6 L | 26.0 → 25.7 |
| C3, mid slump | End of Year 11 | ₹12.5 L | 26.0 → 25.8 |
| C3, mid slump | End of Year 12 | ₹12.5 L | 26.0 → 26.0 |
Skipping the Year-1 top-up made the plan 0.33 years shorter, not longer. That is because Year 2 fell another 15%: selling after the first fall turned out better than holding through the second. No single skipped top-up helped in any slump we tested.
Drain-first is a bet that the market recovers soon. When it recovers fast, you win. When the fall keeps going, the bet costs you.
With a lean buffer, the bet runs out of road faster. In the 36-month plan (C2), drain-first had emptied Bucket 2 by the end of Year 2 (₹84,100 left, Nominal). Both safe buckets were at ₹0 by Year 4, in the middle of the recovery.
Rule B runs through the research harness, not the calculator. Rule A is the calculator's own logic.
4. The sideways market
A sharp crash that bounces back is the easy case for buckets. The scarier one for Indian retirees is the lost decade: equity falls, then crawls for years. Think of the Sensex from 1992 to 2003. We modelled it as −20% in Year 1, then 4% a year for ten years (about −3% a year after inflation), then back to 12%.
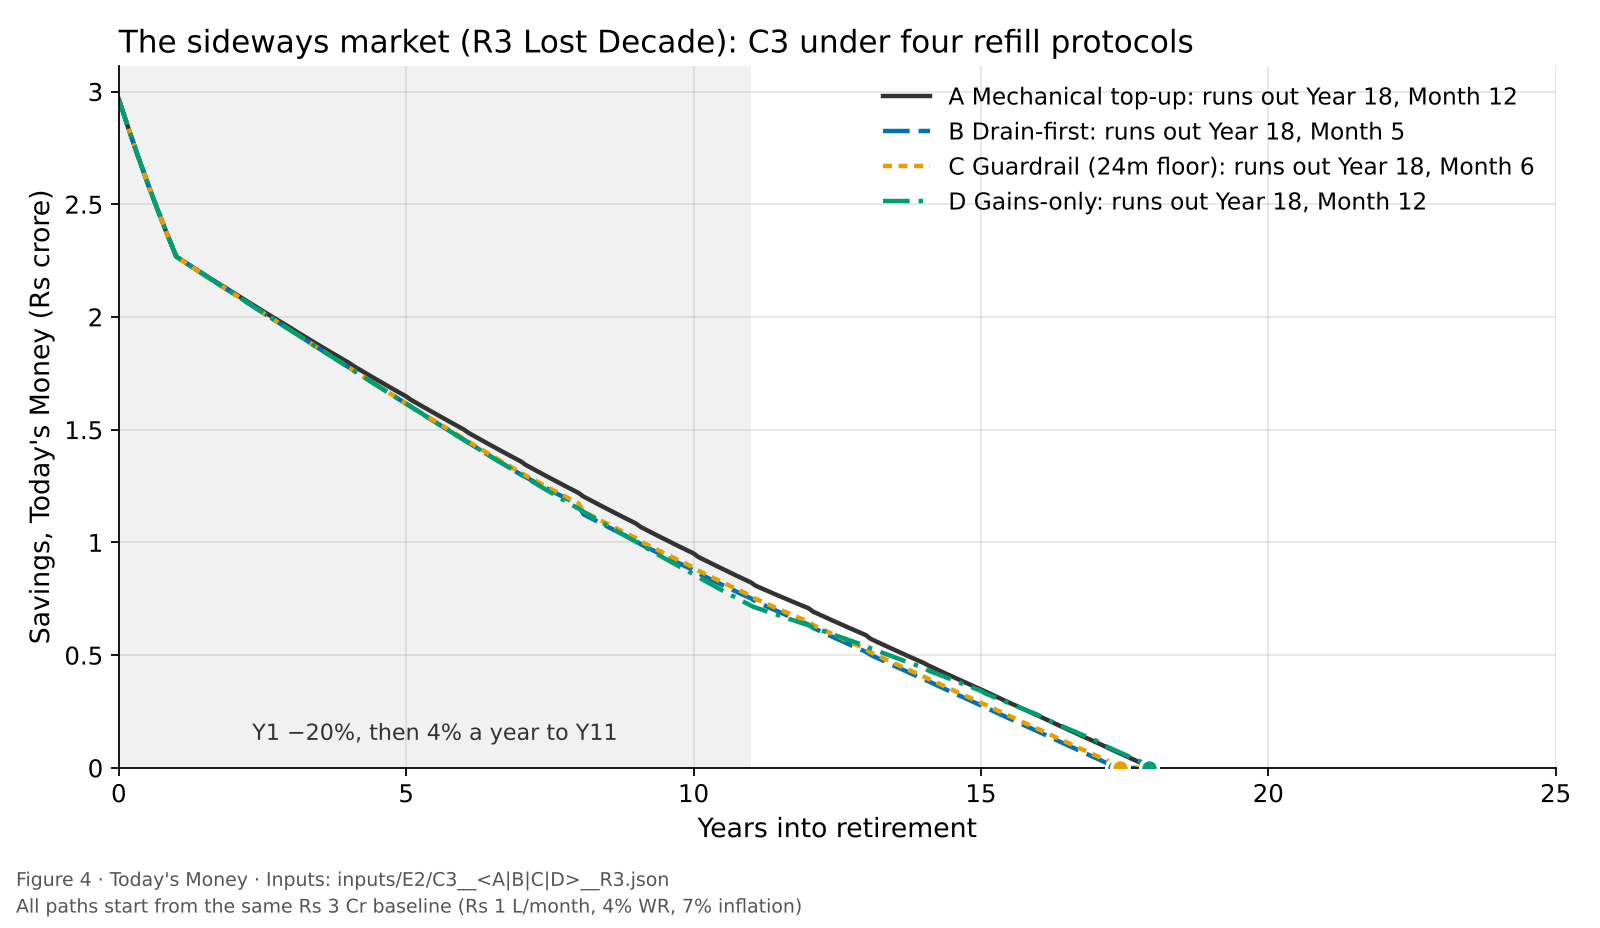
66-month plan (C3): years the money lasts, by refill rule and market. Today's-Money savings at Year 20 are in brackets.
| Rule | Flat 12% | Early slump | Mid slump | Lost decade | Lost decade from Year 10 |
|---|---|---|---|---|---|
| A top-up | 48.3y (₹2.44 Cr) | 18.9y (₹0) | 26.0y (₹71.3 L) | 17.9y (₹0) | 25.6y (₹66.6 L) |
| B drain-first | 48.3y (₹2.44 Cr) | 19.3y (₹0) | 26.4y (₹77.1 L) | 17.3y (₹0) | 25.1y (₹59.9 L) |
| C guardrail | 48.3y (₹2.44 Cr) | 19.1y (₹0) | 26.3y (₹75.4 L) | 17.4y (₹0) | 25.2y (₹61.4 L) |
| D gains-only | 79.8y (₹2.66 Cr) | 22.9y (₹34.5 L) | 29.1y (₹93.0 L) | 17.9y (₹0) | 25.3y (₹58.1 L) |
Drain-first lost in the sideways market, the very case it is supposed to protect against. With the 66-month plan it ran out in Year 18, Month 5, against Year 18, Month 12 for the plain annual top-up. When the lost decade started in Year 10, it lost again: 25.1 vs 25.6 years. In the 36-month plan the gap was the same story: 16.8 years for drain-first vs 17.2 for the top-up.
Why? In a sideways market, debt at 7.25% earns more than equity at 4%. The annual top-up keeps moving money from the weak asset into the stronger one. Drain-first freezes that transfer, spends the debt first, and is left holding the 4% asset. The guardrail rule (C) only softened this a little.
What about rules D and "real" drain-first? Both look great in the early slump (D: 22.9 years; drain-first with a Today's-Money high-water mark: 21.8 years). That is not because they protect the buckets. It is because they almost never sell equity, so the buckets drain and the plan turns back into a single-pot SWP. In the early slump, D paid spending straight from equity in 209 months. It wins exactly when the single pot wins.
Rules B, C and D, and the lost-decade sequence, ran through the research harness.
5. 2,000 markets: the scoreboard
Fixed stories are useful, but nobody knows which story they will get. So we ran every plan through the engine's 2,000 simulated markets. Every plan saw the same 2,000 markets, so the differences come from the plan, not from luck.
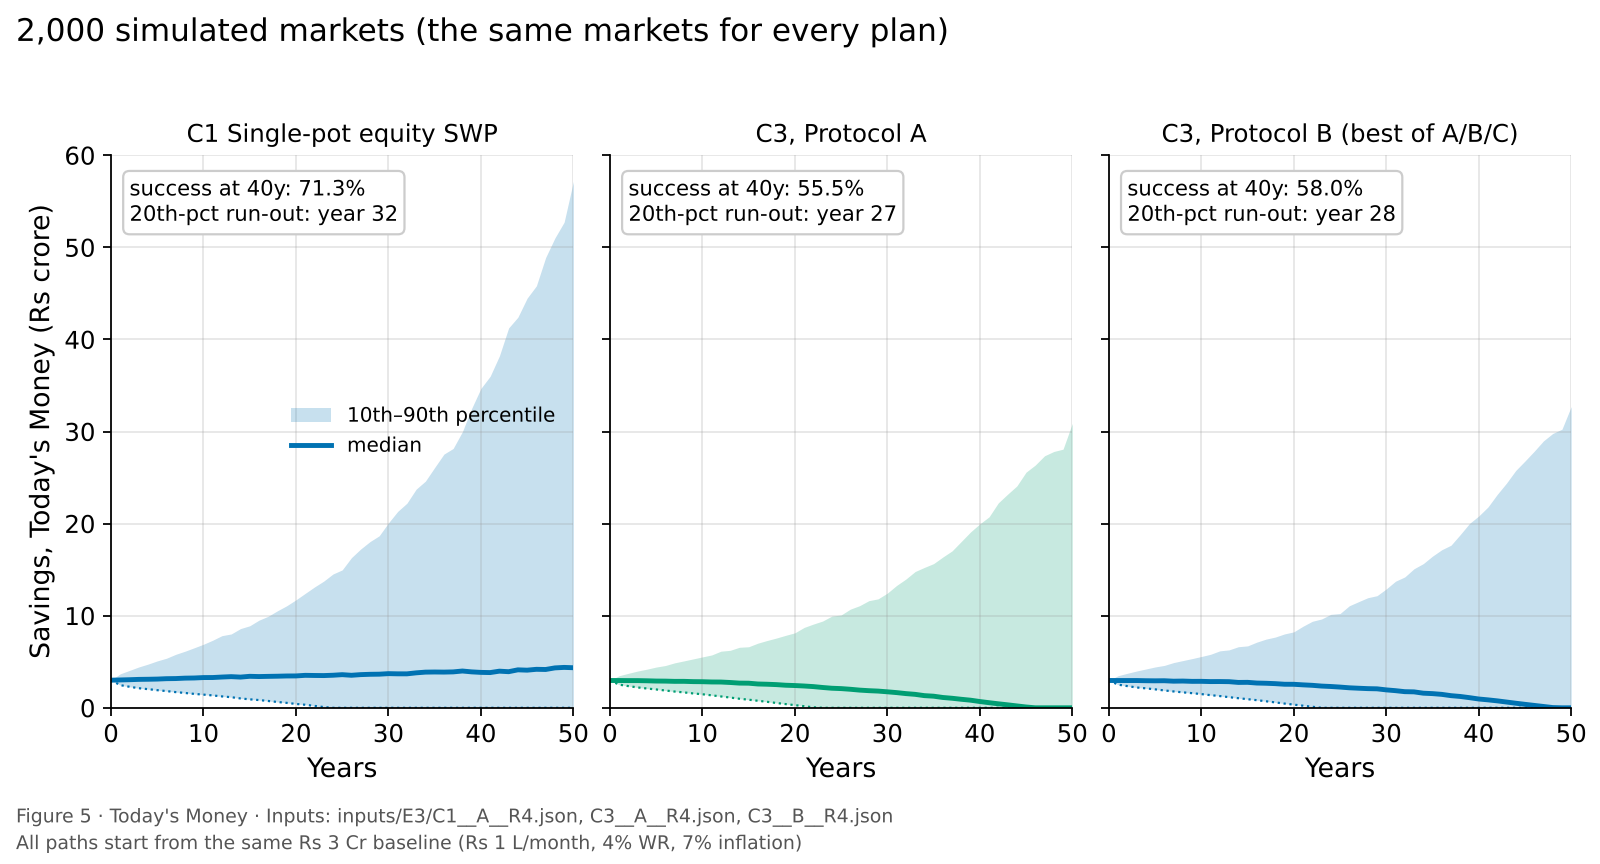
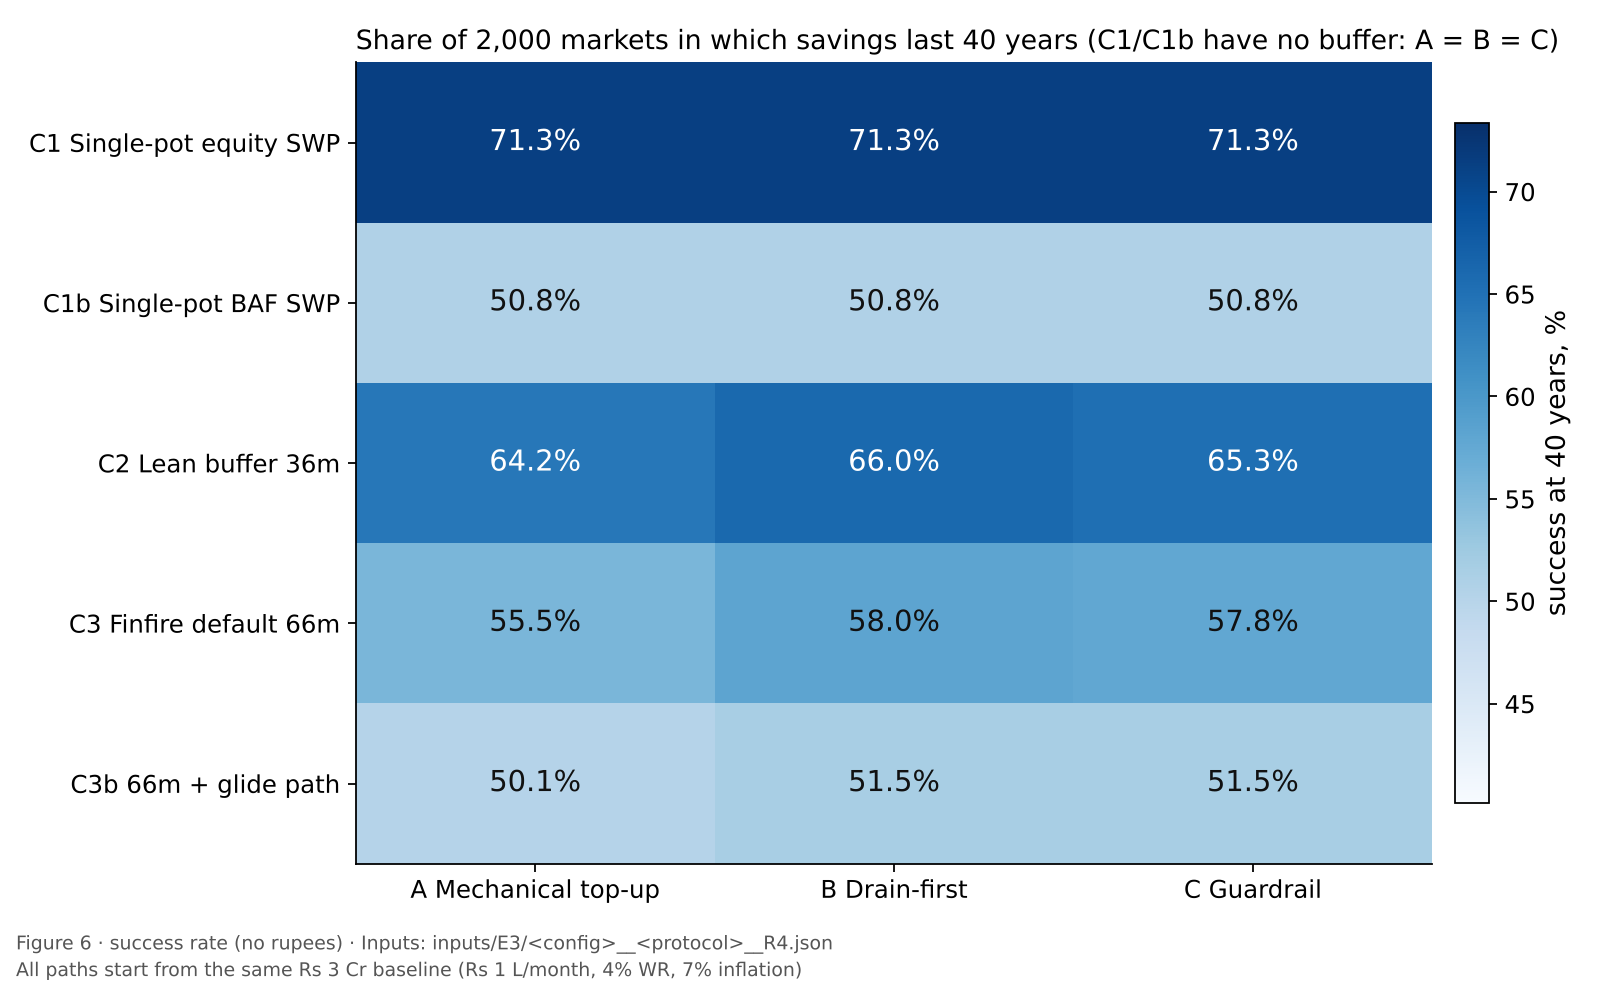
| Plan (rule A) | Lasts 30 years | Lasts 40 years | Lasts 50 years | Run-out year 8 in 10 markets beat | Middle-path savings at Year 40 (Today's Money) |
|---|---|---|---|---|---|
| C1 single-pot equity | 81.2% | 71.3% | 64.8% | 32 | ₹3.85 Cr |
| C2 36 months | 77.7% | 64.3% | 55.6% | 29 | ₹2.08 Cr |
| C3 66 months | 72.0% | 55.5% | 46.2% | 27 | ₹68.2 L |
| C3b 66 months + glide path | 70.8% | 50.1% | 38.1% | 27 | ₹1.8 L |
| C1b single-pot BAF | 76.3% | 50.8% | 35.5% | 29 | ₹4.9 L |
Percentages are % of 2,000 simulated markets.
With drain-first instead of the top-up: C2 lasts 40 years in 66.0% of markets (vs 64.3%), and C3 in 58.0% (vs 55.5%). The guardrail rule sits in between (65.3% and 57.8%).
Market by market, on the same 2,000 markets:
| Comparison | First plan lasts longer | Second plan lasts longer | Same month | Typical gain when first wins | Typical loss when second wins |
|---|---|---|---|---|---|
| C1 single pot vs C3 buckets (both A) | 45.3% | 8.1% | 46.6% | 77 months | 16 months |
| C3 drain-first vs C3 top-up | 42.7% | 9.3% | 48.0% | 14 months | 7 months |
| C2 drain-first vs C2 top-up | 32.2% | 10.5% | 57.3% | 11 months | 6 months |
"Same month" is mostly markets where both plans last the full 50 years.
What the scoreboard says:
- The single pot won clearly. It lasted longer than the 66-month plan in 45.3% of markets, and when it won, it won by about 77 months (6 years). The bucket plan won in only 8.1% of markets, by about 16 months.
- Drain-first is a small, real improvement over the top-up. It lasted longer in 42.7% of markets and shorter in 9.3%. That is worth about 2.5 percentage points of 40-year success.
- The glide path hurt. Slowly moving equity into debt gave the lowest bucket score: 50.1% at 40 years.
- Even the winner is not "safe". At a 4% start with 7% inflation, the single pot still ran out within 40 years in about 3 of every 10 markets. In India, 4% is not a guaranteed-safe withdrawal rate.
Rule A is the calculator's own logic and can be reproduced by link. Rules B and C ran through the research harness.
6. The inflation drag cliff
If a buffer does not help, does a bigger one hurt? We kept the plan shape and swept the safe buffer from 0 to 120 months in 12-month steps (Bucket 1 up to 18 months, the rest in Bucket 2).
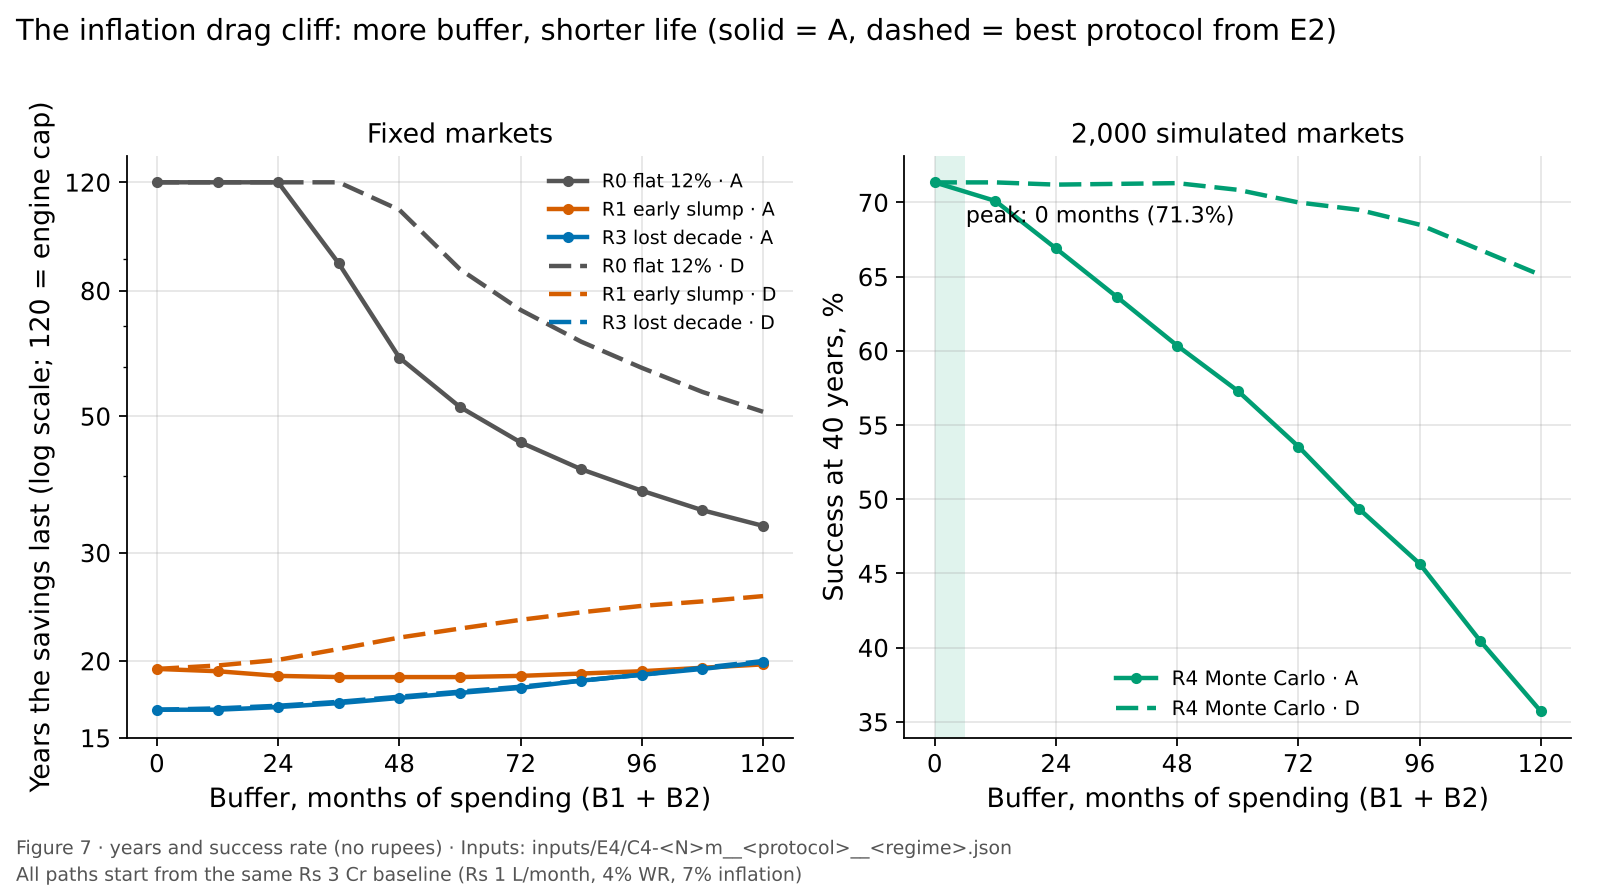
| Buffer (months) | Lasts 40 years, rule A (% of markets) | Change per extra 12 months | Lasts 40 years, rule D (% of markets) | Early slump, rule A (years) | Lost decade, rule A (years) | Flat 12%, rule A (years) |
|---|---|---|---|---|---|---|
| 0 | 71.3% | 71.3% | 19.4 | 16.7 | 120+ | |
| 12 | 70.1% | −1.25 | 71.3% | 19.3 | 16.7 | 120+ |
| 24 | 66.9% | −3.20 | 71.2% | 18.9 | 16.8 | 120+ |
| 36 | 63.6% | −3.25 | 71.3% | 18.8 | 17.1 | 88.6 |
| 48 | 60.4% | −3.30 | 71.3% | 18.8 | 17.4 | 62.3 |
| 60 | 57.3% | −3.05 | 70.8% | 18.8 | 17.8 | 51.8 |
| 72 | 53.5% | −3.75 | 70.0% | 18.9 | 18.1 | 45.3 |
| 84 | 49.4% | −4.20 | 69.5% | 19.1 | 18.6 | 41.0 |
| 96 | 45.6% | −3.70 | 68.5% | 19.3 | 19.0 | 37.8 |
| 108 | 40.5% | −5.20 | 66.8% | 19.5 | 19.4 | 35.2 |
| 120 | 35.7% | −4.75 | 65.1% | 19.8 | 19.9 | 33.2 |
Years in fixed markets are capped at 120 by the engine.
- In simulated markets there is no sweet spot. The cliff starts at zero. With the annual top-up, every 12 months of buffer lowered 40-year success, and the drop got steeper past about 6 years (−3.75 to −5.20 points per step, against −1.25 to −3.30 below that). The 66-month default sits at 55.5%. A 10-year buffer falls to 35.7%.
- The one story where buffers paid off was the lost decade. There, going from 0 to 120 months added about 3 years (16.7 → 19.9), because the buffer's debt beat equity's 4%. In the early slump the line is almost flat (19.4 years with no buffer, 19.8 with 120 months).
- In a steady 12% market, buffers are expensive. Every 12 months past 24 cost years: 120+ years with no buffer, 33.2 years with 120 months. (This steady-market line is a knife edge, though. At 4% withdrawal and 7% inflation, 12% is only just enough, so small drags move it a lot. Treat those numbers as a direction, not a lifetime.)
- Rule D flattens the cliff (71.3% → 65.1%) because it stops refilling the buffer and drifts back towards a single pot. In the early slump, a 120-month buffer under rule D lasted 25.5 years, against 19.4 for the single pot. But in simulated markets it never beat having no buffer at all.
The rule-A sweep in steady and simulated markets can be reproduced by link. Rule D and the slump sequences ran through the research harness.
7. Tax: the Day-0 sale, frozen slabs, and why debt paid nothing
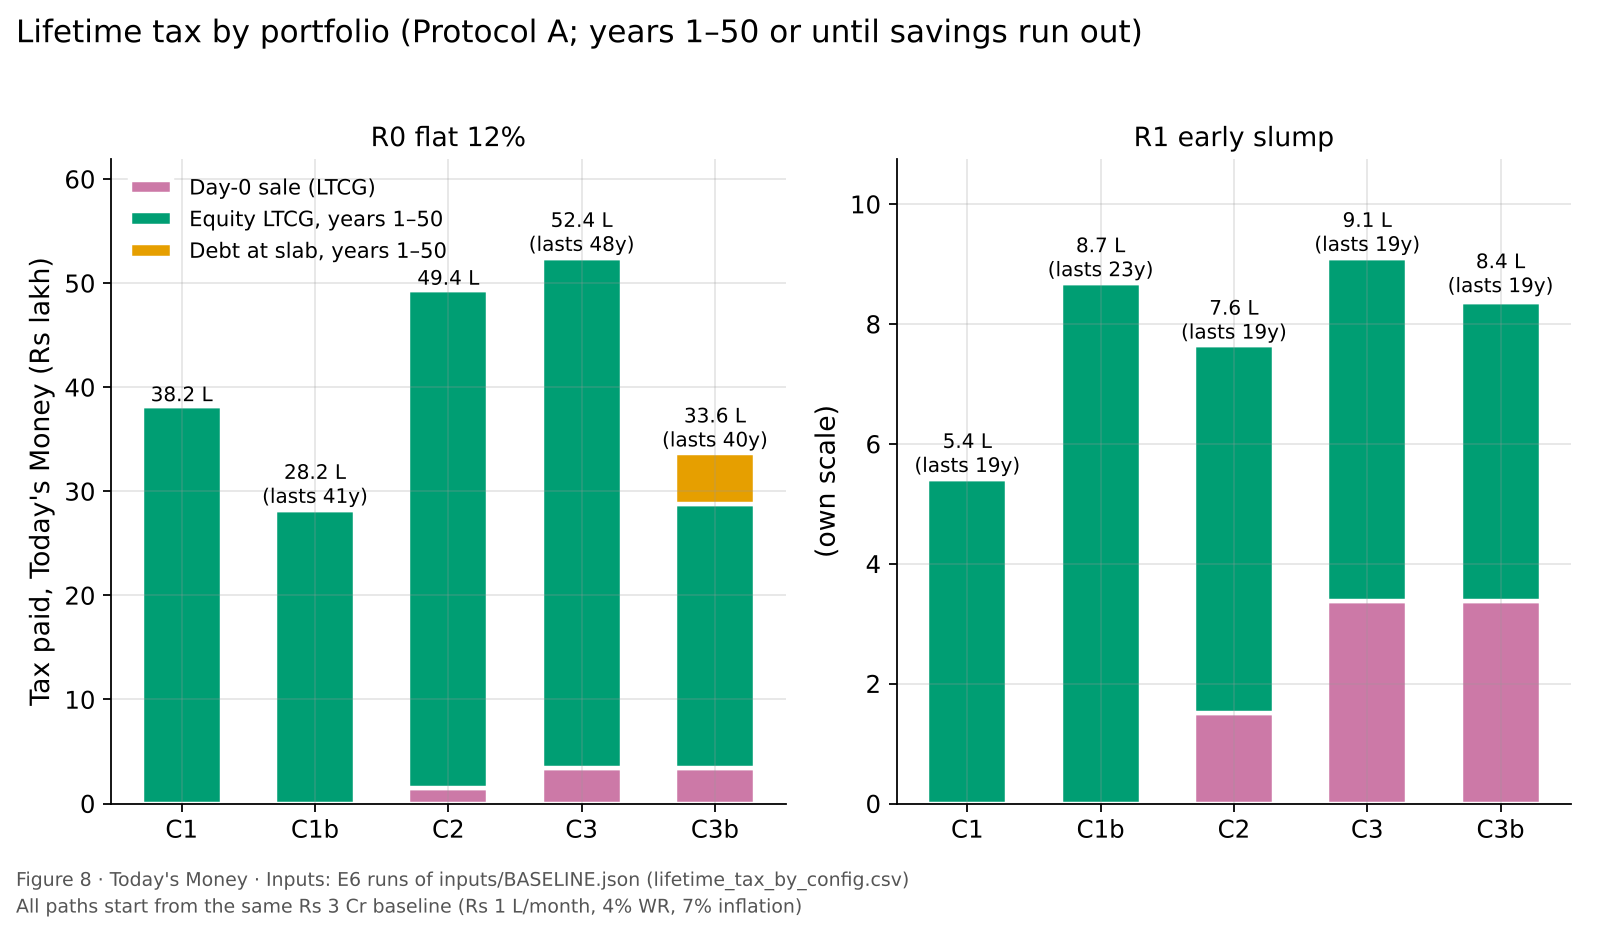
1. Building buckets costs tax on Day 0. If your ₹3 Cr is sitting in equity funds with 45% gains, you must sell equity to fill the buckets.
- The 66-month plan pays ₹3.4 L on Day 0 (₹3,37,600; Nominal and Today's Money are the same on Day 0).
- The 36-month plan pays ₹1.5 L. The single pot pays nothing.
- In simulated markets, that Day-0 bill costs about 1 percentage point of 40-year success (55.5% if you sell equity vs 56.5% if the buffer comes from fresh cash).
- At 70% embedded gains, the bill is ₹6.5 L and the cost is 2.6 points (53.3% vs 55.9%).
The calculator does not charge this Day-0 tax yet, which is why its answers come out slightly better than ours for the bucket plans (Section 11).
2. Debt paid no tax at all. In every plan except the glide path, the debt buckets paid ₹0 slab tax. The reason is that the yearly gains realised from debt stayed under the 87A rebate limit (₹12 L, rising 7% a year in the engine's default). Only the glide-path plan, which moves much more money into debt, paid slab tax: ₹4.8 L over its life in the flat-12% market.
3. Bucket plans paid more lifetime tax than the single pot, not less.
| Plan (rule A, flat 12%) | Day-0 | Equity gains tax | Debt slab tax | Total (Today's Money) |
|---|---|---|---|---|
| C1 single pot | ₹0 | ₹38.2 L | ₹0 | ₹38.2 L |
| C1b BAF | ₹0 | ₹28.2 L | ₹0 | ₹28.2 L |
| C2 36 months | ₹1.5 L | ₹47.9 L | ₹0 | ₹49.4 L |
| C3 66 months | ₹3.4 L | ₹49.1 L | ₹0 | ₹52.4 L |
| C3b glide path | ₹3.4 L | ₹25.4 L | ₹4.8 L | ₹33.6 L |
Across simulated markets, the middle lifetime tax bill is ₹37.9 L for the single pot and ₹48.6 L for the 66-month plan (Today's Money).
4. The big tax risk is frozen slabs. The engine raises tax slabs, the rebate limit and the ₹1.25 L exemption with inflation by default. In real life, governments often leave them unchanged for years. With frozen thresholds:
- The single pot's middle lifetime tax jumps from ₹37.9 L to ₹70.3 L (Today's Money).
- Its 40-year success falls from 71.3% to 68.7%. The 66-month plan falls from 55.5% to 52.3%.
- Debt starts to pay tax too: ₹1.2 L for the 66-month plan in the early slump.
The Day-0 sale tax ran through the research harness. Frozen thresholds and embedded gains can be set in the calculator.
8. Does it flip?
We tried to break the result by changing one assumption at a time.
Higher withdrawal rates make the gap wider, not narrower. (% of 2,000 simulated markets lasting 40 years)
| Starting withdrawal | C1 single pot | C1b BAF | C3 top-up | C3 drain-first |
|---|---|---|---|---|
| 4% | 71.3% | 50.8% | 55.5% | 58.0% |
| 5% | 52.5% | 20.6% | 27.6% | 30.6% |
| 6% | 35.1% | 6.0% | 10.7% | 11.8% |
At 5%, the single pot keeps paying in roughly half the markets, while the 66-month plan manages about a quarter. The popular "6% SWP from a BAF" lasted 40 years in only 6.0% of markets.
Different return assumptions don't change the winner. (% of markets lasting 40 years)
| Equity assumption | C1 single pot | C2 top-up | C2 drain-first | C3 top-up | C3 drain-first | Single pot beats C3? | Drain-first beats top-up? |
|---|---|---|---|---|---|---|---|
| Base (12%, 15.5% SD) | 71.3% | 64.3% | 66.0% | 55.5% | 58.0% | yes | yes |
| 11% median | 60.1% | 53.1% | 55.0% | 45.0% | 47.3% | yes | yes |
| 13% median | 79.8% | 74.0% | 75.3% | 65.5% | 67.8% | yes | yes |
| 14% SD (calmer) | 73.7% | 66.2% | 67.5% | 56.4% | 58.4% | yes | yes |
| 18% SD (wilder) | 68.0% | 61.4% | 64.0% | 54.0% | 57.0% | yes | yes |
A BAF single pot is a bet on the BAF's return. At a 9%, 10% or 11% median return, it lasted 40 years in 31.1%, 50.8% or 70.3% of markets. A single percentage point of fund return moves the outcome by about 20 points. That is fund-selection risk, not safety.
A real crash: a retiree starting in January 2008 (NIFTY 50 TRI, 2008–2025, then 12%):
| Plan | Runs out | Years lasted | Savings at Year 10 (Today's Money) | Equity sold below its peak (Today's Money) |
|---|---|---|---|---|
| C1 single pot | Year 28, Month 2 | 27.1 | ₹1.38 Cr | ₹77.0 L |
| C1b BAF | Year 27, Month 12 | 26.9 | ₹1.61 Cr | ₹44.7 L |
| C3 top-up | Year 22, Month 11 | 21.8 | ₹1.32 Cr | ₹59.1 L |
| C3 drain-first | Year 24, Month 6 | 23.4 | ₹1.46 Cr | ₹0 |
This was the best case for drain-first: a deep crash followed by a fast rebound. Drain-first beat the top-up by 1.6 years. But the single pot, which sold the most equity at low prices (₹77.0 L), still lasted the longest. Selling low hurts, but leaving money in low-return buckets for decades hurt more.
The 2008 replay ran through the research harness.
9. So what should a retiree take from this?
This is education, not advice. Here is what the numbers support:
- A bucket buffer is insurance, and it has a price. On average across our 2,000 markets, the 66-month default cost about 16 points of 40-year success compared with no buffer (55.5% vs 71.3%). If buckets help you sleep and stop you from panic-selling, that can be worth paying for. Just know the price.
- If you use buckets, keep them lean. Each extra 12 months cost 1 to 5 points. Past about 6 years of buffer, the cost per year of buffer grows.
- Drain-first is a small upgrade, not a shield. It added about 2.5 points on average and helped in fast recoveries like 2008. It lost in the slow, sideways decade, which is exactly the market people fear most.
- Don't treat the Year-1 top-up as the villain. In our slumps, skipping any single top-up never helped.
- Budget for the Day-0 tax and for frozen slabs. Both are easy to forget, and frozen slabs can nearly double lifetime tax.
- The early years matter most, whatever you choose. The same crash ten years later added 7 to 10 years of life to every plan.
10. What the model does not capture
- Moves within a year. Each year's return is spread evenly across its 12 months. There is no mid-year crash and no monthly ups and downs. A drain-first rule checked every month might behave differently.
- Fat tails and market memory. Simulated years are independent. Real markets have more extreme years, plus momentum and bounce-backs. Debt and equity shocks are also drawn independently.
- Changing inflation. Inflation is a flat 7%. A decade of high inflation combined with weak equity, which is the real danger for a debt-heavy buffer, is not modelled.
- Health and lump-sum shocks. Spending is smooth. Many people keep buckets partly as an emergency reserve for big one-off bills, and we did not test that.
- Behaviour. The model always follows the rule. The strongest argument for buckets is psychological: they stop people panic-selling. A model cannot score that.
- Real funds. The BAF is one return-and-risk stand-in. Real BAF allocations, expense ratios and tracking are not modelled. Arbitrage funds are taxed as debt here (the engine's default), not as equity.
- Tax law changes. FY 2026–27 rules are held for 50 years, with thresholds rising 7% a year by default (frozen thresholds tested separately).
- Research-only pieces. Rules B, C and D, the Day-0 sale tax and the multi-rate slumps (early, mid, lost decade, 2008) are not yet in the calculator. They ran on the calculator's own engine through a research harness. Rule A, the flat-12% market and the 2,000 simulated markets are the calculator's own logic and can be reproduced by link, except for the Day-0 tax.
11. Try this scenario yourself
Every number in this paper came out of the burndown.finfire.org engine. You can rerun the core scenarios, and then put in your own corpus, spending and buckets.
Sign in first. Every link below uses Tax Slabs, and most also use Simulated Markets, Market Slump, the Glide Path or Compare. These are Pro features, so open the links while signed in to a Pro account.
A. The headline result: single pot vs buckets in 2,000 markets
- Open the single pot (Pro). Open The calculator says it lasts 40 years in 71.35% of 2,000 markets, exactly the paper's number. There is no Day-0 sale here, so nothing differs.
- Open the 66-month bucket plan (Pro). Open The calculator says 56.15%; the paper says 55.55%. The gap is the Day-0 sale tax (₹3.4 L), which the paper charges and the calculator doesn't yet.
- Do the same for the lean buffer and the glide path (Pro).
B. Build the comparison graph with Compare (Pro)
- One click: Open single pot vs 66-month buckets in Compare (Plan A = single pot, Plan B = 66 months). The calculator says: "Plan B runs out in year 50, which Plan A does not within 120 years; Plan B ends with ₹169.45 Cr less." That sentence describes the steady-12% path. It matches the paper's flat-12% numbers (Year 49, Month 4 vs 120 years+). For the odds, use the simulated-market results from steps 1 and 2.
- Lean vs default, one click: Open 66 months vs 36 months in Compare (Plan A = 66 months, Plan B = 36 months). The calculator says: "Plan B runs out 49 years later than Plan A; Plan B ends with ₹80.89 Cr more." This is again the steady-12% path: 36 months runs out in Year 99 there, against Year 50 for 66 months.
- Now do it with your own numbers.
- Open the single-pot link from step 1.
- Change the corpus, monthly spending and unrealised gains to yours.
- Under Compare (Pro), press "Pin this plan".
- Now change Bucket 1 months and Bucket 2 months to the buffer you are thinking about (for example 12 and 24, or 18 and 48).
The Compare view shows both plans side by side on your numbers.
C. Crash timing and the sideways market (approximate)
The calculator's Market Slump control holds one equity rate for the whole slump. These links replace −20% / −15% / 0% with a steady −12.06% for 3 years, which ends at the same total fall. That is close, but not identical, so the answers can differ from the paper by a few months.
- Slump in Years 1–3 (Pro):
- The same slump in Years 10–12 (Pro):
- The lost decade (Pro): 66 months: Open. Runs out in year 20 (paper: Year 18, Month 12). The gap is bigger here because the link spreads the Year-1 fall of −20% evenly over 11 years (a steady 1.55%), so the early damage is milder than in the paper.
D. Find your own inflation drag cliff (Pro)
- Step through buffer sizes in the steady-12% market. The calculator's answers, with the paper's in brackets:
The calculator's years run a little longer because it doesn't charge the Day-0 sale tax.
- Find the cliff in simulated markets. Open the single pot from step 1, then raise Bucket 1 months to 12 and then 18. After that, raise Bucket 2 months 12 at a time. Write down the 40-year success rate at each step. You are drawing your own version of Figure 7.
E. What you can't click yet
- Your own tax position: change Unrealised gains (try 0%, 20%, 45%, 70%), and set the threshold growth to 0% to see frozen slabs.
- Drain-first (rule B): this is not a button yet. You can approximate it by hand. Open the early-slump link, then read the year-end table and imagine skipping the Bucket 3 → Bucket 2 top-up in the slump years. Section 3 gives you the exact ledger to compare against.
12. Test your own numbers
The paper's family has ₹3 Cr, spends ₹1 L a month and has 45% gains. Yours won't. Each link below opens with the paper's plan already typed in. Change the cells in the last column to your own and watch the answer move.
Compare is a Pro feature. In the Compare links, Plan A is pinned as a dashed line and Plan B is on screen. Anything you change only affects Plan B. Press Unpin to drop Plan A. If you're on a free account, the links open a sample plan with a short note explaining why. Sign in first.
| # | Link | Plan A (pinned) | Plan B | What you'll see | Then try changing |
|---|---|---|---|---|---|
| 1 | Single pot vs 66-month buckets | Single-pot equity SWP, ₹3 Cr, ₹1 L a month | Finfire default buckets (18 + 48 months) | Plan B runs out in year 50; Plan A lasts 120 years+ (steady 12% path) | Bucket 1 and Bucket 2 months. Find the smallest buffer you would actually sleep with |
| 2 | 66 months vs 36 months | Finfire default buckets (18 + 48 months) | Lean buckets (12 + 24 months) | Plan B runs out 49 years later (year 99 vs year 50) | Bucket 2 months, in steps of 12, to see the inflation drag build up |
| 3 | Single pot in 2,000 markets | — | Single-pot equity SWP | Lasts 40 years in 71.35% of 2,000 simulated markets | Monthly spending. At ₹1.25 L a month (5%) the paper's single pot fell to 52.5% |
| 4 | 66-month buckets in 2,000 markets | — | Finfire default buckets | Lasts 40 years in 56.15% of markets (the paper's 55.55% also charges the Day-0 sale tax) | Unrealised gains (0%, 20%, 45%, 70%), and threshold growth set to 0% to see frozen tax slabs |
| 5 | Early slump, 66-month buckets | — | Finfire default buckets with a 3-year Market slump | Runs out in year 20 (paper: Year 19, Month 12) | The slump's start year (1 vs 10), to see how much timing matters for you |
Your own five-minute check:
- Start from link 3. Change Corpus, Monthly spending, Unrealised gains and Inflation to your own, and note your chance of lasting 40 years (or your own horizon).
- Pin it. Under Compare (Pro), press "Pin this plan". This is your Plan A.
- Add the buffer you are considering. Set Bucket 1 months and Bucket 2 months (for example 12 + 24, or 18 + 48). This is your Plan B.
- Read the gap. That gap is the price of your buffer in your situation. In our baseline the 66-month buffer cost about 16 points (71.3% vs 55.5% of markets). If your gap is small and the buffer helps you sleep, it may be worth it.
- Allow for the Day-0 tax. If you would sell equity to build the buckets, the calculator does not charge that sale yet. In our baseline it cost about 1 point at 45% gains, and about 2.6 points at 70%.
What the calculator can and can't show you. It runs the annual top-up (rule A), the steady market, the 2,000 simulated markets and a one-rate Market slump. It does not yet run drain-first, the guardrail or gains-only rules, multi-rate slumps or the Day-0 sale tax. When we set our research harness to the calculator's own rules, the two match to the rupee.
Appendix. Checking our work yourself
You can rebuild every chart and table from the research/bucket-refill/ folder:
- The baseline is in
inputs/BASELINE.json. - Every rule is in
inputs/DEFINITIONS.md, written down before any experiment ran. - One input file per scenario is in
inputs/E1toinputs/E8, each with the engine version it ran on. - The 2008 replay uses NIFTY 50 TRI calendar-year returns, 2008–2025, from NSE.
- The 2,000 simulated markets use the random seed 20260927, and every plan saw the same 2,000.
./run_all.sh reruns everything, and a rerun gives the same answer to the rupee.
How we checked it. Before any experiment, the research harness was matched to the live calculator page to the rupee (₹0 difference) on:
- steady-market runs of every plan;
- the Market slump;
- all 2,000 simulated markets (931 lasting 50 years on both);
- the Day-0 tax formula;
- the monthly compounding rule.
The exact inputs, calculator links and results behind each chart and table are in results/reproducibility.csv.
Every number in this paper rests on assumptions, not forecasts. Tax rules are FY2026-27 under the new regime and may change. None of this constitutes financial, tax, or investment advice. finfire.org operates the calculator and offers paid tiers.
Reproducibility. The exact inputs, calculator links and results behind every figure and table in this paper (scenarios run through the research harness are marked): reproducibility.csv